In: Ecological Restoration Editors: George H. Pardue and Thomas K. Olvera
ISBN 978-1-60741-013-3 © 2009 Nova Science Publishers, Inc.
Chapter 4
INTEGRATING STRUCTURAL AND FUNCTIONAL METRICS TO ASSESS THE EARLY SUCCESS OF SALT MARSH RESTORATION Keith Walters1 Department of Marine Science, Coastal Carolina University, Conway, SC, USA
ABSTRACT The restoration or creation of estuarine wetlands is predicated on two presumptions: marsh habitats have significant value that if lost will produce negative effects on coastal ecosystems, and engineered wetlands are equivalent to historical marsh systems. Few studies directly have documented wetland value, but a greater number have attempted to assess the equivalency of restored and existing marshes. A majority of the restoration studies focus on monitoring the convergence of certain metrics (e.g., plant density, resident species richness) between marshes. Monitoring structural changes over time can be labor intensive, often requires decades of data before observing convergence, and potentially are confounded by ecosystem resilience, modified constraints to community change, and the existence of alternative stable states for systems. Recent advocacy of an experimental approach to assessing marsh restoration progress may offer a number of advantages over strict monitoring. An experimental approach was applied to the study of early progress in a Southeastern US created salt marsh. A 6 ha pine upland along the North River, GA was graded to intertidal elevations and planted with marsh vegetation (primarily Spartina alterniflora) as part of a federally mandated mitigation project. A series of experiments were conducted to assess the functional similarity of the created and an existing reference marsh along the same tidal creek. Structural characteristics of the marshes were both similar (e.g., stem densities, particulate settlement) and different (e.g., plant nearest neighbor distances, sediment organic content), but would suggest that after 3-4 yrs. the restored marsh had not progressed to the point of resembling the existing marsh. However, experimental results suggested restored and existing marshes functionally are similar. The growth and survival of caged bivalves and marked snails typically resident in marshes either were not significantly different between marshes or 1 Correspondence to: Department of Marine Science, P.O. Box 261954, Coastal Carolina University, Conway, SC 29528, Phone: 843.349.2477, email:
[email protected]
112
Keith Walters were greater within the restored marsh. Foraging crabs appeared to exhibit a preference for natural marsh sediments, but feeding experiments indicated similar effects on sediments from both marshes. The survival of enclosed or tethered mollusks was similar between marshes except for a single instance and suggested marshes provide the same refuge function. Application of an experimental approach led to the conclusion that the restored marsh had progressed in a relatively short time to exhibit many ecological functions existent in historical marshes. An experimental approach also should provide greater insight into the potential reasons for why created marshes may not progress to historical targets.
Key Phrases: salt marsh functional similarity, monitoring marsh restoration progress, mollusk shell and tissue growth strategies Keywords: Spartina alterniflora, feeding preference, habitat restoration, refuge effect, enclosure experiments, fiddler crabs, Geukensia demissa, Southeastern marshes, freerange snails, tethering, success metrics
INTRODUCTION The relatively recent emphasis on ecological restoration of salt marsh habitats either by creation of new or rehabilitation of existing marshes acknowledges both the value of marshes to nearshore environments (e.g., Constanza et al. 1997) and an ability to alleviate most or all of the negative effects of marsh loss (Dobson et al. 1997, Young et al. 2005). Active restoration of U.S. estuarine marshes dates from the 1970s (Seneca et al. 1985, Broome et al. 1986) and typically involves the transplantation of one or a few marsh plant species such as salt marsh cordgrass, Spartina alterniflora. Although qualified successes exist (Roman et al. 2002, Warren et al. 2002, Teal & Peterson 2005, Baustian & Turner 2006, Konisky et al. 2006), a consensus on the efficacy of past restoration efforts has not been reached (Matthews & Minello 1994, Craft et al. 1999, Zedler & Callaway 1999, Peterson & Lipcius 2003, Luken & Walters 2009). The ability to document success of any restoration project first involves the identification of appropriate goals and metrics (e.g., Weinstein et al. 1997, Short et al. 2000, Luckenbach et al. 2005). Although increasing emphasis is placed on societal objectives (Weinstein et al. 2001, Higgs 2005), reestablishment of ecological function continues to remain a major goal for marsh restoration. Historically, re-creating the structural aspects of the marsh (e.g.; plant and animal biomass, density or species composition) was viewed as sufficient for the return of ecological function (Simenstad & Thom 1996, Piehler et al. 1998). Early studies of natural and restored marsh structure suggest that macrophyte biomass recovered quickly (Seneca et al. 1985, Broome et al. 1982, 1986, Broome 1990), but significant differences in sediment microbial nitrogen dynamics (Thompson et al. 1995, Currin et al. 1996), nutrient cycling (Craft et al. 1988, Langis et al. 1991, Craft et al 1991), benthic infaunal abundance and composition (Moy & Levin 1990, Sacco et al. 1994, Levin et al. 1996), nekton marsh utilization (Minello & Zimmerman 1992, Allen et al. 1994, Minello & Webb 1997), and avian nesting behavior (Zedler 1993) continued many years after project completion. Longer term and/or more recent studies indicate attributes of restored marsh structure can equal values from native marshes if factors including time since restoration are considered (Posey et
Integrating Saltmarsh Restoration Metrics
113
al. 1997, Craft et al. 1999, Brady et al. 2002, Keer & Zedler 2002, Warren et al 2002, Able et al. 2004, Konisky et al. 2006). Unfortunately, the development of marsh structural equivalency over time represents only a first step towards functional equivalency and can perpetuate the myth of successful ecological restoration (Hilderbrand et al. 2005). A frequent lack of adequate experimental designs and confounded analyses also has plagued restoration studies that attempt to document success (Chapman 1999, Grayson et al. 1999, Holl et al. 2003). One pervasive difficulty is a lack of replication at the appropriate treatment level. To logically infer restoration is the cause of similarities or differences between habitats traditionally would require assessing the variation across multiple restored sites (see Hurlbert 1984). Unfortunately, restoration efforts typically are “projects of opportunity” for reasons that include site availability and lack of financial resources. Restored sites rarely are replicated (but see Craft et al. 1999, Walters & Coen 2006). Alternative design and analysis approaches have been developed to avoid the replication issue and include, naming a few, Beyond BACI (Underwood 1994), Bayesian statistics (Dixon & Ellison 1996), information-theoretic models (Burnham & Anderson 1998), and likelihood methods (Hilborn & Mangel 1997). Another alternative approach to identifying similarities and/or differences in ecological functions between natural and restored marshes is the use of targeted, manipulative experiments. As has been demonstrated many times at the population, community or ecosystem level the use of manipulative experiments is one of the most powerful approaches for identifying differences in ecological processes (e.g., Carpenter et al. 1996). The objective of this study was to conduct a series of manipulative experiments to determine if restored and natural marshes are similar in two critical ecological functions identified for salt marsh systems (Nixon 1980, Dame 1989): (1) a source of food for marsh fauna; (2) a refuge from predation. Specific questions addressed with manipulative experiments included: Is the growth of resident bivalve and gastropod fauna different between restored and natural marshes? Are decapod feeding rates different between restored and natural marshes? Are predation rates on and survival of resident marsh bivalves and gastropods different between restored and natural marshes? Along with the experimental investigations structural metrics including floral and faunal densities and sediment salinities and organic content were measured to determine if a connection between physical structure and ecological function could be established. Results from this study will identify whether differences exist in a number of ecological processes between natural and restored marshes and will provide insights into potential explanations for the differences in ecological functions.
MATERIALS AND METHODS All studies were conducted within adjacent natural and restored Kamehameha salt marshes on the Naval Submarine Base at Kings Bay, GA, USA (81°32′W, 30°47′N). The Kamehameha marshes are located along the North River, a drowned tidal river with precipitation and run-off the only freshwater input. Extensive natural salt marshes predominated by S. alterniflora surround the North River from an origin on the Naval Base to a terminus in the St. Marys River. In spring 1995 ca. 6 ha of pine upland were logged and all logs, stumps, shrubs and brush removed. Matted roots and roots >5.1 cm in diameter were
114
Keith Walters
grubbed from the cleared area to a depth of 45.7 cm. A series of tidal channels were dug to connect the acreage to the adjoining North River and the cleared area was graded to establish typical intertidal elevations. Cleared intertidal areas between 12.7 and 17.8 cm in elevation were planted in November 1996 with 10.2 cm plugs of S. alterniflora placed 0.9 m on center. An elevational gradient in plant morphology and composition typical of southeastern saltmarshes (Wiegert & Freeman 1990) existed within natural and, to an extent, restored Kamehameha marshes at the beginning of the study in May 1997. Spartina stands in lowmarsh elevations directly along the tidal channels were taller (>1 m) compared to the shorter (2 d prior to determining dry mass. To assess possible differences in pelagic food availability settlement traps were deployed in June and August 1998 to estimate the amount of material transported through the water column to each mid- and low-marsh zone where mussels were enclosed. Individual traps (n = 10) with an aspect ratio >5 were buried with ca. 1 cm above the sediment surface to minimize accumulation of material horizontally transported along the benthic boundary layer. Deployments lasted from 3-4 d and all material collected by the end of the sampling period was frozen immediately at -20 °C and stored until processed. Stored settlement samples initially were thawed and filtered through pre-ashed, pre-weighed Whatman GF/F filters. All filters were dried at 60 °C for >2 d to determine total particulate dry mass and ashed at 450 °C for >4 h to calculate AFDM.
116
Keith Walters
Separate L. irrorata mark-recapture growth experiments were conducted in 1997 and 1998 within natural and restored Kamehameha marshes. All snails (>500) initially were collected haphazardly from mid-marsh zones within a common site along the St. Marys River. The collection of snails from a common site had the same advantages as in the mussel enclosure experiments (see above) and was necessitated by a complete absence of naturally occurring L. irrorata in both natural and restored Kamehameha marshes. Exhaustive surveys of either Kamehameha marsh throughout the study did not find a single, naturally occurring L. irrorata, although other saltmarsh snail species (e.g., Melampis bidentatus) were common (Walters, pers. obs.). Collected snails either were frozen immediately for later processing to predict initial shell and tissue mass (>100) or individually numbered with bee tags (Chr. Graze, FRG) and shell length, tip of apex to edge of operculum opening, and wet mass after toweling dry measured. Numbered snails (50 ea.) were released at 4 haphazardly selected sites within both Kamehameha natural and restored marshes. Sites were located within >1 m height stands of S. alterniflora and widely separated, >20 m apart, along a total distance of ca. 300 m in either marsh. Comprehensive efforts to recover all marked, free-ranging snails were conducted in August 1997 and 1998. The length and wet mass of all recaptured snails were measured before all individuals were frozen at -20 °C. Shells of recaptured snails in the 1997 experiment were cracked and all tissue separated from the shell. Cracked shell and tissue were dried at 60 °C for >2 d to determine dry mass. In August 1998 feeding and preference experiments were conducted using only female U. pugilator placed into 500 ml containers with varying sediment treatments. Crabs were collected from a single intertidal marsh site 24 hrs before the start of the experiment and starved. On the day of the experiment sediments were collected intact to a depth of 2 cm from natural and restored marshes along tidal creeks where crabs were observed foraging at low tides. In the feeding experiment undisturbed natural or restored marsh sediments were placed within each container. Half of the containers with either marsh sediment (n = 5) were left as controls and one crab each was placed in the remaining half (n = 5). In the preference experiment containers were filled with ½ natural and ½ restored marsh sediments. Again half the containers (n = 5) were left as controls and one crab each was placed in the remaining half (n = 5). The ½ - ½ containers were designed to assess whether crabs were able to distinguish between natural and restored marsh sediments when offered the choice. Additional sediment samples (n = 60 ea.) were collected from the same tidal creek sites to determine initial differences between natural and restored marshes. Both feeding and preference experiments ran for ≈48 hr. under natural light conditions. Crab escape was prevented with a mesh top and sediments were kept moist. At the termination of the experiments sediment to a depth of 2 cm was collected using a 10 cc syringe corer. A total of 12 cores were collected from each container; 6 cores from each sediment side in the preference experiment. Sediment cores and crabs were frozen immediately at -20 °C and returned to the lab for processing. Homogenized 2 cm3 subsamples were dried at 60 °C for >2 d to determine sediment dry mass and ashed at 450 °C for >4 h to calculate AFDM.
Integrating Saltmarsh Restoration Metrics
117
Survival Experiments Relative differences in the survival of natural and restored marsh mussels were determined in the mussel enclosure experiments and a June to August 1998 tethering experiment (Heck & Wilson 1987, Aronson & Heck 1995). Enclosure experiments measured the effects of differences in physical stress and/or bottom-up resource availability on mortality. Tethering results measured relative differences in top-down or refuge effects (Rozas & Odum 1988, Hovel et al. 2001, Bortolus et al. 2002). Individual mussels collected from the St. Marys mid-marsh site in June 1998 were attached to a 1-2 m length of monofilament line. Tethered mussels (n = 3) were tied to survey flags (n = 5) that were placed within natural and restored mid- and low-marsh sites. The survival of mussels was recorded throughout the first 5 d and finally in August 1998. Mussels that were no longer tethered and missing (e.g., not located within the immediate vicinity of identified mussels), present but with noticeable shell perforation or present with no living tissue were classified as dead. Although the efficacy of tethering techniques have been questioned (Peterson & Black 1994, Kneib & Scheele 2000 but see Aronson et al. 2001) the approach has been used effectively to provide comparative estimates of organism loss (Clark et al. 2003, Eggleston et al. 2005, Orth et al. 2007). For the relatively immobile mussels, tethering primarily aided locating buried individuals and did not appear to restrict normal behavior. Given the potential for artifacts in tethering experiments results are interpreted cautiously. Natural and restored marsh differences in L. irrorata survival also were examined in two tethering experiments conducted between May and July 1998. Individual snails were attached to a 1-2 m length of monofilament line, tied to survey flags and placed in the field. In May 40 snails were placed within the low-marsh zone among S. alterniflora stems in both natural and restored marshes. In June 40 snails again were placed in the low-marsh zone of natural and restored marshes but 10 in each marsh were placed outside of the leading marsh edge on the adjacent mud flat. The survival of tethered snails was determined daily for 5 d and ca. 30 d later when each experiment was terminated. Individuals no longer tethered and missing (e.g., tethers cut and identifiable snails not within the immediate vicinity) and present but with no living tissue were classified as dead; individuals that became entangled with S. alterniflora and committed suicide (e.g., snails suspended above the sediment with no access to stems) were not considered to have suffered predation. Snail tethering results also are interpreted cautiously especially given the stem-climbing behavior of L. irrorata (Vaughn & Fisher 1988, Hovel et al. 2001) and the observed but infrequent tendency to suicide.
Statistical Analyses Natural and restored marsh differences in abiotic and biotic parameters were analyzed, where possible, using a blocked, 2-factor ANOVA or MANOVA. Marsh zones were the blocking factors to account for typical effects of spatial variation (e.g., low- to high-marsh) while focusing on date and marsh effects. ANOVA was applied to univariate measures of marsh success (e.g., stem height, sediment salinity) and MANOVA was used for data where dependent variables had an obvious multivariate structure (e.g., live and dead stems and shoots). An alternative nested ANOVA design was applied to stem height data (stems nested within quadrats, marsh effects tested over quadrat within marsh mean square error) and a 2-
118
Keith Walters
factor ANOVA was applied to nearest-neighbor distances (marsh and stem type). A lack of marsh treatment replicates common in restoration studies (see Introduction) reduced the generality of inferences that can be drawn from the results of monitored biotic and abiotic parameters. All data were evaluated and appropriately transformed if data violated critical ANOVA/MANOVA assumptions. MANOVA tests were evaluated based on the generalized F of Wilks’ lambda distribution which provided greater power and immunity from violations of assumptions. Mussel and snail growth and feeding experiments also were analyzed using parametric procedures and ANOVA tests. To determine the initial shell and tissue mass for experimental mussels and snails, dry mass by total length least square regressions were generated from a sacrificed, representative sample collected from within the common North or St. Marys River marshes. The growth or change in shell or tissue mass was calculated by subtraction of regression-estimated initial from observed final values. Results were analyzed by 2-factor ANOVA blocking for zone effects in the mussel experiments and site effects in the snail experiments. Cage effects on mussel growth were tested for in 1998 and, if significant, included in the model. Crab feeding and preference experiments were analyzed either as a nested ANOVA (container nested within marsh and crab treatments) or a blocked MANOVA. Analyzing feeding preference experiments can be problematic (Peterson & Renaud 1989), but suggestions to include appropriate controls (Peterson & Renaud 1989) and use a multivariate approach (Roa 1992, Manly 1993, Lockwood 1998) were incorporated into the analysis of crab preference data. Natural and restored marsh AFDM, the non-independent feeding choice results, were the dependent variables, containers were the blocking factor and crab presence or absence the treatment effect analyzed in the MANOVA. Hierarchical loglinear models were used to analyze count data for snail mark-recapture and mussel and snail tethering experiments. A model selection process based on the change in likelihood ratio χ2 values was applied. All statistical tests were run on SAS 9.1 (Clark 2004) or SPSS 16.0 for Windows (Norušis 2008).
RESULTS Marsh Characteristics Live and dead S. alterniflora stem and shoot numbers varied appreciably among marshes and years but not marsh zones (Fig. 1). Densities were significantly different between natural and restored mid-marsh zones analyzed separately for 1997 (MANOVA, F3, 16 = 12.17, p < 0.001) and were affected by a significant year*marsh interaction (MANOVA, F3, 112 = 34.03, p < 0.001) but not a significant zone or block effect for 1998 to 1999 (MANOVA, F6, 224 = 1.36, p > 0.05). Low- and high-marsh live stem densities increased by ≈50% in natural and declined by ≈40% in restored marshes between 1998 and 1999 (Fig. 1). Rarely did restored exceed natural marsh stem densities, but in 1998 shoot densities were at least twice as great in all restored compared to natural marsh zones (Fig. 1). However, the increased shoot production did not result in greater numbers of restored marsh live stems the next year.
Integrating Saltmarsh Restoration Metrics
Low-Marsh
Mid-Marsh
High-Marsh 350
119
1997
300
Natural Restored
250 200 150 100 50
Stem Density (# m-2)
0 1998 350
350
300
300
300
250
250
250
200
200
200
150
150
150
100
100
100
50
50
50
0
0
0
350
350
300
300
300
250
250
250
200
200
200
150
150
150
100
100
100
50
50
50
350
350
1999
0
0
0 Live
Dead
New
Live
Dead
New
Live
Dead
New
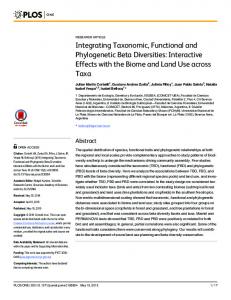
S. alterniflora Stem Category Figure 1. Spartina alterniflora live and standing-dead stems and new shoots (mean + 1 se) enumerated from 0.25 m2 quadrats (n=10) haphazardly placed in a mid-marsh zone in May 1997 and low-, mid-, and high-marsh zones in May 1998 and 1999 within natural and restored Kamehameha marshes.
Mid-marsh stem heights were similar but nearest-neighbor distances differed between marshes. Natural, 82.4 ± 2.2 cm, compared to restored marsh live stems, 79.3 ± 2.4 cm, were slightly taller, not significantly different between marshes (F1, 18 = 0.53, p > 0.05), but significantly different among quadrats (F18, 90 = 2.26, p < 0.007). Nearest-neighbor distances were not affected by a marsh*stem type interaction (F1, 96 = 0.02, p > 0.05) or stem type (F1, 96 = 3.61, p > 0.05), but were significantly different between marshes (F1, 96 = 21.55, p < 0.001). Both live and dead stems were almost twice as far apart within the restored marsh (Fig. 2). Based on stem densities and nearest-neighbor distances natural marsh live (χ250 = 20.4, p > 0.05) and dead stems (χ250 = 19.1, p > 0.05) were randomly distributed while restored marsh live (χ250 = 83.8, p < 0.005) and dead stems (χ250 = 76.0, p < 0.025) were significantly clumped (Thompson 1956).
120
Keith Walters
Nearest Neighbor Distance (cm)
14 Natural Restored
12 10 8 6 4 2 0 Live
Dead
Stem Type Figure 2. Natural and restored Kamehameha mid-marsh live and standing-dead stem mean (±1 se) nearest neighbor distances (n = 25) in May 1998.
Sediment parameters in a number of instances varied unpredictably by zone, date and marsh treatments. Pore water salinities were not significantly different between low- to highmarsh zones (F2, 54 = 0.44, p > 0.05) unlike patterns typically observed within southeastern marshes (Pennings et al. 2005). Date*marsh (F1, 54 = 1.60, p > 0.05) and marsh effects (F1, 54 = 1.11, p > 0.05) were not significant, but salinities were significantly different between years (F1, 54 = 41.39, p < 0.001). Salinities were reduced slightly in 1997 compared to 1998 (Fig. 3). The silt/clay sediment fraction was significantly different among zones (F2, 54 = 23.52, p < 0.001) and between marshes (F1, 54 = 112.52, p < 0.001), but date*marsh (F1, 54 = 0.32, p > 0.05) and date effects (F1, 54 < 0.001, p > 0.05) were not significant. Natural compared to restored marsh sediments contained greater percentages of silt/clay (Fig. 4). In the sandier restored marsh, the silt-clay content of low-marsh sediments was greater compared to sediments from other zones (Fig. 4). Sediment organic content was significantly different among zones (F2, 52 = 6.92, p < 0.003) and between dates (F1, 52 = 6.83, p < 0.015) and marshes (F1, 52 = 138.72, p < 0.001), but the date*marsh interaction was not significant (F1, 52 = 0.07, p > 0.05). In general organic content was greater in natural compared to restored marshes (Fig. 5). The collection of natural, high-marsh samples from within J. roemerianus stands in 1998 likely was a greater influence on AFDM date differences than actual year to year variation in sediment organic content. Similarly, the Chl a content of surface sediments was significantly different among zones (F2, 53 = 18.55, p < 0.001) and between dates (F1, 53 = 9.23, p < 0.005) and marshes (F1, 53 = 15.82, p < 0.001), but the date*marsh interaction was not significant (F1, 53 = 0.04, p > 0.05). Chl a amounts were twice as much in natural compared to restored sediments except in the high-marsh where amounts where almost equal (Fig. 6). The greater organic content of high-marsh natural sediments (Fig. 5) was not the result of differences in microalgal biomass between marshes.
Integrating Saltmarsh Restoration Metrics
30
121
1997 Natural Restored
25
Pore Water Salinity (ppt)
20 15 10 5 0
30
1998
25 20 15 10 5 0 High
Mid
Low
Marsh Zone
Figure 3. The mean (±1 se) pore water salinity measured from 0-2 cm depth sediment samples (n = 5) collected in July 1997 and June 1998 within low-, mid-, and high-marsh zones in natural and restored Kamehameha marshes. 1997
40 Natural Restored
30
Silt/Clay Fraction (%)
20
10
0 40
1998
30
20
10
0 High
Mid
Low
Marsh Zone
Figure 4. The mean (±1 se) percent silt-clay content (n = 5) of sediments collected from 0-2 depths within July 1997 and June 1998 low-, mid- and high-marsh zones in natural and restored Kamehameha marshes.
122
Keith Walters
700
1997 Natural Restored
600 500
Sediment AFDM (mg / g)
400 300 200 100 0 1998
700 600 500 400 300 200 100 0 High
Mid
Low
Marsh Zone
Figure 5. The mean (±1 se) sediment AFDM (n = 5) measured from 0-2 cm depths within July 1997 and June 1998 low-, mid- and high-marsh zones in natural and restored Kamehameha marshes. 20
1997
15
Chlorophyll a (mg / g)
10
5
0 1998
20 Natural Restored
15
10
5
0 High
Mid
Low
Marsh Zone
Figure 6. The mean (±1 se) chlorophyll a amounts (n = 5) in sediment samples collected from 0-2 cm depth in July 1997 and June 1998 low-, mid- and high-marsh zones in natural and restored Kamehameha marshes.
Integrating Saltmarsh Restoration Metrics
123
Growth and Feeding Experiments Marsh Mussels Densities of mussels collected within the field varied among zones and between dates and marsh (Fig. 7). Numbers were significantly different among zones (F2, 114 = 11.49, p < 0.001) and reflected a significant date*marsh interaction (F1, 114 = 4.12, p < 0.05). The natural marsh always had greater numbers of mussels except in 1999 when an influx of G. demissa resulted in similar densities between natural and restored mid-marsh locations (Fig. 7). The haphazard allocation of mussels to enclosures in both 1997 and 1998 experiments resulted in few meaningful initial differences between zones and marshes. The average length of mussels deployed within enclosures in 1997 was 38.8 ± 0.5 mm (29.0 to 48.8 mm) and in 1998 was 58.3 ± 3.6 mm (32.1 to 78.2 mm). Shell lengths were significantly different between zones (F1, 37 = 5.04, p < 0.04) but not marshes in 1997 (F1, 37 = 0.04, p > 0.05). The actual mean difference between elevations was < 3.0 mm. In 1998 shell lengths were not significantly different by zones (F1, 140 = 1.66, p > 0.05), marsh (F1, 28 = 0.86, p > 0.05), or cages within marsh (F28, 140 = 1.24, p > 0.05).
30
1998
Natural Restored
25 20
-2
Mussel Density (# m )
15 10 5 0 30
1999
25 20 15 10 5 0 High
Mid
Low
Marsh Zone Figure 7. Mussel field densities (mean ±1 se) in 1998 and 1999 from haphazardly placed 0.25 m2 quadrats (n = 10) within low-, mid- and high-marsh zones in natural and restored Kamehameha marshes.
124
Keith Walters
Initial shell and tissue dry mass for mussels used in growth experiments were calculated from power equation regression results for 1997 (n = 39) and 1998 initial field samples (n = 41). In 1997 shell length was a best-fit predictor of shell (r2 = 0.86, F1, 37 = 226.04, p < 0.001; dry mass = 0.056*(length)2.779) and tissue dry mass (r2 = 0.43, F1, 37 = 27.74, p < 0.001; dry mass = 0.03*(length)2.115). Shell length also was a significant predictor of shell (r2 = 0.96, F1, 2.939 ) and tissue dry mass in 1998 (r2 = 0.85, 39 = 927.5, p < 0.001; dry mass = 0.038*(length) 2.526 F1, 39 = 215.3, p < 0.001; dry mass = 0.013*(length) ). In both 1997 and 1998 experiments, the growth in shell length and mass and tissue mass varied by marsh and elevation. Shell length and mass and tissue mass increased in a majority of the 65% of the mussels surviving in 1997, but tissue mass declined in a majority of the 64% of mussels surviving in 1998. The linear growth of shell was significantly different between zones and marshes in both 1997 and 1998 experiments (Table 1). Changes in shell length were greater in natural mid-marsh sites in 1997 but were greater in all restored marsh zones in 1998 (Fig. 8). Changes in shell mass were not appreciably different between zones and marshes in either 1997 or 1998 experiments (Table 1). Mussels generally added shell at a greater rate in 1998 and appreciably more shell was added in restored marsh mussels (Fig. 8). Changes in tissue dry mass were significantly different between zones with low-marsh mussel tissue generally increasing in both 1997 and 1998 experiments (Table 1). The interpretation of patterns in tissue growth are confounded by a general lack of tissue growth in 1998 and the reversal of order in 1997, especially since low-marsh values are based on a single observation (Fig. 8). Table 1. Summary of ANOVA results for 1997 and 1998 enclosure experiments determining the block effect of elevation (low, mid) and the main effect marsh (natural, restored) and on the change in shell length and mass and tissue mass of mussels. Only restored low-marsh mussels had positive tissue growth in 1998 so analyses not included. Experiment
1997
Variable
Shell length Marsh Shell mass Tissue mass
1998
Shell length Shell mass
Source of Variation Elevation Elevation Marsh Elevation Marsh Elevation Marsh Elevation Marsh
F
df
13.76 14.56 0.81 0.84 6.78 0.28 33.37 63.72 3.33 3.90
1, 19 1, 19 1, 16 1, 16 1, 15 1, 15 1, 91 1, 91 1, 67 1, 67
p
0.05 0.05 0.05) and was not affected by a significant date*marsh interaction (F1, 35 < 0.001, p > 0.05). Particulate AFDM percents were significantly different between dates (F1, 35 = 5.28, p < 0.03) and marsh (F1, 35 = 259.92, p < 0.001). Although generally greater amounts of particulates settled in the restored marsh the overall AFDM of the particulates was significantly less during both sampling periods (Fig. 9).
126
Keith Walters 60
August 1998
June 1998
AFDM (%)
40 30 20 10 0 400
-1
Particulates (mg d )
Sediment Settlement
50
Natural Restored
300
200
100
0 Low
Mid
Low
Mid
Marsh Zone Figure 9. The mean (±1 se) daily amount of particulates and percent particulate AFDM (n = 5) for sediment settling out of the water column in July and August 1998 within low- and mid-marsh zones in natural and restored Kamehameha marshes.
Marsh Periwinkles In both 1997 and 1998 experiments individuals were returned haphazardly to sites within marshes and the results were significant but few consequential initial differences existed between sites, dates and marshes. The average length of snails released in May 1997 was 16.3 ± 0.1 mm (9.8 to 20.4 mm) and May 1998 was 16.9 ± 3.6 mm (12.7 to 21.1 mm). Shell lengths were significantly different between sites (F1, 793 = 4.43, p < 0.005), dates (F1, 37 = 73.06, p < 0.001) and marshes (F1, 793 = 8.30, p < 0.005); there was no significant date*marsh interaction (F1, 793 = 0.78, p > 0.05). Actual mean differences between sites, dates or marshes were < 0.5 mm. To calculate snail shell and tissue growth between May and August 1997, initial dry mass values were estimated from regression results for field collected individuals from the common St. Marys location (n = 69). Shell length was a best-fit predictor of shell (r2 = 0.79, F1, 68 = 260.4, p < 0.001; dry mass = 1.113*(length)2.262) and tissue dry mass (r2 = 0.58, F1, 68 = 91.95, p < 0.001; dry mass = 0.154*(length)2.183). Snail recapture rates primarily varied between marshes. Recovery ranged between 35.5 to 37.0% for natural and 51.0 to 55.0% for restored marsh individuals in 1997 and 1998 experiments, respectively. Recapture rates were dependent on marsh (Δχ21 =14.38, p < 0.001) and site within marsh (Δχ21 =26.96, p < 0.001) but not year (Δχ21 < 0.01, p > 0.5). Visually locating snails within restored compared to natural marshes was easier (Walters pers. obs.).
Integrating Saltmarsh Restoration Metrics
127
The changes in snail wet mass, shell length and mass, and tissue mass varied by site, marsh and date. A majority of recaptured snails, >90%, increased in size and mass. The linear growth of shell was significantly different between sites, dates and marshes (Table 2). Shells grew more in 1997 than 1998 but consistently grew significantly more in the restored compared to the natural marsh (Fig. 10). The change in snail wet mass was significantly different between sites and marshes, but not dates (Table 2). Similar to length, snail wet mass was greater in the restored marsh (Fig. 10). Increased length and wet mass growth in restored marsh also translated into significantly greater increases in shell but not tissue dry mass in 1997 (Table 2). Shells increased by 68% in the restored compared to the natural marsh, but tissue mass was identical between marshes (Fig. 10). 400 Natural Restored
2.0 1.5 1.0 0.5
Δ Wet Mass (mg)
Δ Shell Length (mm)
2.5
300
200
100
0.0
0 1997
1998
1997
1998
Date
Δ Dry Mass (mg)
300
1997
250 200 150 100 50 0 Shell
Tissue
Snail Part Figure 10. The mean (±1 se) May to August change in snail shell length and wet mass for 1997 and 1998 snail growth experiments and the change in shell and tissue dry mass for 1997 within natural and restored Kamehameha marshes.
128
Keith Walters
Table 2. Summary of ANOVA results for 1997 and 1998 mark-recapture experiments determining the block effect of site and the main effects of date and marsh on the change in snail wet mass and shell length. Analyses of changes in shell and tissue mass also are included for 1997. Experiment
1997 & 1998
Variable
Shell length
Wet mass
1997
Shell mass Tissue mass
Source of Variation
Site Date Marsh Date * Marsh Site Date Marsh Date * Marsh Site Marsh Site Marsh
F
6.81 63.27 7.62 0.58 9.36 0.54 51.58 1.31 2.73 18.68 8.03 0.06
df
3, 341 1, 341 1, 341 1, 341 3, 341 1, 341 1, 341 1, 341 3,151 1, 151 3, 151 1, 151
p
0.05) were not significant. The AFDM increased from initial amounts in all treatments and almost doubled in both crab and no crab natural marsh sediments (Fig. 11). MANOVA identified significant container (F8, 226 = 2.85, p < 0.006) and crab treatment effects (F2, 113 = 51.18, p < 0.001) in the preference experiment. The presence of crabs appeared to increase AFDM in restored marsh sediments while decreasing amounts in natural marsh sediments (Fig. 11).
Survival Experiments Mussel survival was dependent on marsh and zone. Individual losses in 1997 were influenced by marsh (Δχ21 =4.05, p < 0.05) while losses in 1998 were dependent on both marsh (Δχ21 =12.75, p < 0.001) and zone (Δχ21 =4.10, p < 0.05). The effect of zone on survival, consistent with mortality in enclosure experiments not resulting from macropredators, tended to be greater in natural and mid-marsh locations (Fig. 12). However, survival always was greater in the restored marsh, between 70 to 90%, at all zones. Survival during the June to August 1998 tethering experiment, a measure of relative differences in
Integrating Saltmarsh Restoration Metrics
129
macropredator mortality, was influenced by both marsh and zone effects. Survival Experiments Mussel survival was dependent on marsh and zone. Individual losses in 1997 were influenced by marsh (Δχ21 =4.05, p < 0.05) while losses in 1998 were dependent on both marsh (Δχ21 =12.75, p < 0.001) and zone (Δχ21 =4.10, p < 0.05). The effect of zone on survival, consistent with mortality in enclosure experiments not resulting from macropredators, tended to be greater in natural and mid-marsh locations (Fig. 12). However, survival always was greater in the restored marsh, between 70 to 90%, at all zones. Survival during the June to August 1998 tethering experiment, a measure of relative differences in macropredator mortality, was influenced by both marsh and zone effects.
Sediment AFDM (mg / g)
Feeding Experiment
Preference Experiment
150 Crab No Crab
Natural Restored
125 100 75 50 25 0 Crab
No Crab
Crab Treatment
Natural
Restored
Marsh Treatment
Figure 11. Crab effects on sediment AFDM (mean ±1 se) in feeding and preference experiments.
Only 1 mussel was lost during the first 5 d of observations. Survival after ca. 60 d was dependent on marsh (Δχ21 =4.09, p < 0.05) and zone (Δχ21 = 6.10, p < 0.015). Mid-marsh mussels had greater survival rates in either natural or restored marshes (Fig. 13), but survival was reduced in the restored marsh and was half that in the natural low-marsh (Fig 13). Mussel behavior appeared unaffected by tethering. All individuals were buried within the sediments similar to adjacent, untethered mussels and could be found within natural clusters of untethered mussels (Walters pers. obs.). Snail survival during May - June and June – July tethering experiments was not influenced by marsh. No snails were lost during the first 5 d of each experiment. Fifty percent of the snails survived after ≈30 d in both natural and restored marshes in May – June. In the June – July experiment 30 d survival was dependent on zone (Δχ21 = 8.42, p < 0.004) but not marsh (Δχ21 = 2.53, p > 0.5).
130
Keith Walters 1998
1997
Natural Restored
Mussel Survival (%)
100 80 60 40 20 0 Mid
Mid
Low
Low
Marsh Zone Figure 12. The percent survival of mussels deployed in 1997 and 1998 enclosure experiments. July-August 1998
June-July 1998
100
Snail Survival (%)
Mussel Survival (%)
100 80 60 40 20 0
Natural Restored
80 60 40 20 0
Mid
Low
Marsh
Mudflat
Marsh Zone/Site Figure 13. The percent survival of mussels or snails deployed in 1998 tethering experiments.
Mortality for snails tethered on the mud flat was greater than for snails within the marshes (Fig. 13). Tethering snails did not appear to prevent typical movements up and down stems and except for a few instances when individuals became entangled and suspended off the sediment appeared to have a minimal effect on behavior (Walters pers. obs.).
Integrating Saltmarsh Restoration Metrics
131
DISCUSSION Significant structural differences existed between the Kamehameha marshes during the first 3-4 yrs since the creation of the restored marsh. An early parity in 1998 stem densities was replaced in the last year of the study by a >3 fold increase in low-marsh numbers within natural compared to restored marshes. Plant biomass typically is one of the first attributes to recover in marshes but can take anywhere from 14 mo. up to 10 yrs. to equal natural marsh amounts (Craft et al. 1999, Laegdsgaard 2002). The similar Kamehameha stem densities in 1998 was rapid, but the 1999 increases in natural marsh densities coupled with a decline in restored marsh numbers, especially given the greater shoot densities the year before, is not readily explained. The spatial arrangement of plants in restored mid-marsh sites also resulted in greater distances among stems, but unexpectedly canopy architecture was similar between marshes in only the second growing season. Stem distances likely still reflect the grid-pattern of initial S. alterniflora plug planting, but the similar canopy heights are distinct from past studies where equivalency can take many years (Zedler 1993). Physical differences in soil characteristics are consistent with previous studies of restored marshes and reflect the often decades necessary to accumulate organic matter (Craft et al. 1999). The 2-5 fold differences in silt/clay fraction and sediment AFDM occur in both years and all marsh zones. Except in low-marsh sites, the biomass of microphytobenthos is not responsible for observed marsh and zone differences in organic matter. Chlorophyll a levels only are greater for natural low-marsh sites and likely contribute to the natural vs. restored marsh differences in AFDM. The early similarity in Chl a amounts does not conform with results from North Carolina marshes where restored marsh age significantly affected algal biomass (Zheng et al. 2002). Total particulate settlement tended to be greater within the restored marsh and, although measured for only a relatively short period of time, also does not explain the greater AFDM in natural marsh sediments. However, the AFDM of settling particulates was consistently lower and could contribute to a slower accumulation of organics in the restored marsh. Pore water salinities are unremarkably similar between marshes but did not exhibit a typical increase from low- to high-marsh zones (Pennings et al. 2005). The normal evaporation experienced in high-marsh zones resulting in increased salinity may not occur in the Kamehameha marshes. Both marshes are located in close proximity, 100% in a number of instances and were the only mussels adding tissue mass in 1998. Inundation frequency and water column food availability affect the growth of marsh mussels (Franz 1997), and differences in relative elevation between natural and restored mid-marsh sites could explain the greater 1997 growth of natural marsh mussels. However, detailed field maps indicate enclosures were placed in close proximity each year, though exact elevations were not determined. The reversal of growth patterns between years, restored greater than natural in 1998, also suggests some factor other than elevation is responsible for year to year differences. Snails that rely directly on extant and not tidally transported marsh resources (Bärlocher & Newell 1994, Silliman & Newell 2003) grew better in the restored marsh during both summers. Increases in shell length and mass primarily accounted for the 1997 difference in summertime growth, but molluscs frequently exhibit temporal disconnects between the growth of shell and tissue (e.g., Borrero & Hilbish 1988). Fiddler crabs demonstrated no difference in feeding on either natural or restored marsh sediments but did seem to prefer natural marsh sediments when offered a choice. Sediment characteristics (Robertson & Newell 1982, Jaramillo & Lunecke 1988) along with temperature and salinity regimes (Frusher et al. 1994) can affect intertidal Uca spp. distributions, but fiddler growth rates appear to vary little among different habitats (Koch et al. 2005). The feeding preference exhibited by crabs in this study also may be more apparent than real. In the crab addition treatment natural and restored marsh sediment AFDM were equivalent, but the AFDM in restored marsh sediments consistently are significantly lower in all other samples. One possible explanation is that crab behavior may redistribute organic matter across the two sediment types within the containers confounding the ability to detect a feeding preference. Although similar to or better than natural marshes for feeding, growth and non-predatory mortality, the restored marsh was an inconsistent refuge from predators. Mussel losses to predators were ca. 25-67% greater in the restored marsh, but snail losses were just the opposite and were greater in the natural marsh. Vegetated habitats typically provide a refuge against numerous macro-predators (Leber 1985, Halpin 2000), but the mechanism can be complex involving intraguild as well as predator-structure interactions (Grabowski & Powers 2004, Griffen & Byers 2006). In the Kamehameha marsh system the clumped distribution of stems within the restored marsh likely resulted in a less effective inhibition for predators feeding on mussels. However, the ability of snails also to crawl up S. alterniflora stems (Hovel et al. 2001) provided an additional, effective predator avoidance behavior. The ability of salt marsh restoration efforts to deliver marshes similar in ecological function remains an open question. Depending on the goal and metrics applied most marsh restoration projects could be considered qualified successes. The equivalency of plant biomass (Broome et al. 1986, Roman et al. 2002), genetic diversity (Travis et al. 2002), fish utilization (Roman et al. 2002, Able et al. 2004), and pore water salinities (this study) to name just a few can be established rapidly in restored marshes. Other metrics including sediment organic content (Craft et al. 1999), nutrient cycling (Thompson et al. 1995, Craft et al. 1999), faunal density and richness (Sacco et al. 1994, Levin et al. 1996), and plant canopy
Integrating Saltmarsh Restoration Metrics
133
architecture (Zedler 1993) tend to require significant time if not decades before reaching parity with natural marshes. Although each of the above metrics contributes either individually or in concert to ecological function, comparisons between marshes do not address directly the question of functional similarity. In this study experiments designed to test for differences in the primary marsh functions of providing food for consumption and/or a refuge from predation indicate that in a radical marsh restoration project, where pine upland was converted to intertidal elevations, functional equivalency between marshes can occur in