Scientific Studies of Reading, 18:235–254, 2014 Copyright © 2014 Society for the Scientific Study of Reading ISSN: 1088-8438 print/1532-799X online DOI: 10.1080/10888438.2013.862248
Using Complexity Metrics to Assess Silent Reading Fluency: A Cross-Sectional Study Comparing Oral and Silent Reading Beth A. O’Brien
Downloaded by [210.193.45.163] at 22:26 02 July 2014
National Institute of Education, Nanyang Technological University
Sebastian Wallot Interacting Minds Center, Aarhus University
Anna Haussmann and Heidi Kloos University of Cincinnati
Reading typically undergoes a qualitative shift around Grade 4, becoming more fluent and silent, but there is no established measure for fluency in children’s silent reading. The present study presents a measure of self-paced reading in children, examining the use of complexity measures for time-series analyses recently established with adults. Cross-sectional groups of adults and children in Grades 2, 4, and 6 read the same passage of a Grade 2-level story, either silently or aloud. The dynamical structure of fluency in reading times was explored with fractal and recurrence quantification analysis. Results revealed that more fluent reading (with increasing age) was marked by greater structure and stability and that oral reading compared with silent reading showed less fractal structure, indicating silent reading as a more flexibly stable, adaptive coordinated behavior. The complexity metrics show promise for an alternate way to characterize reading fluency.
Fluent readers readily comprehend text and grasp its meaning, progressing through a text quickly and flexibly, almost effortlessly. Fluency itself has been considered as a bridge between decoding and comprehension (Bashir & Hook, 2009; Pikulski & Chard, 2005), and it is thus a central educational goal, considered to be one of the five pillars of reading instruction (report from the National Reading Panel, 2000). Moreover, measures of oral reading fluency have advanced the field of reading intervention, facilitating the preventive approach of response to intervention (e.g., Good, Kaminski, & Dill, 2002). These oral fluency assessments, developed as indicators of progress (DIBELS), came to be viewed in American schools as the educational goal or outcome in and of themselves. In contrast to the view of effortless enjoyment, reading fluency has thus come Correspondence should be sent to Beth A. O’Brien, Centre for Research in Pedagogy & Practice, National Institute of Education, Nanyang Technological University, 1 Nanyang Walk, Singapore, SG 637616. E-mail:
[email protected]
Downloaded by [210.193.45.163] at 22:26 02 July 2014
236
O’BRIEN ET AL.
to be equated with fast reading at the expense of comprehension. As noted by Rasinski (2012), “Reading fluency instruction has become in many classrooms a quest for speed” (p. 516). Although reading fluency is no longer considered a top priority in educational research (Cassidy, Ortlieb, & Shettel, 2011), it is nonetheless strongly correlated with reading comprehension (Fuchs, Fuchs, Hosp, & Jenkins, 2001; Hosp & Fuchs, 2005). Therefore, fluency instruction may contribute to better comprehension. However, issues with defining and measuring fluency hamper research efforts on best methods of assessing and teaching reading fluency. The goal of the present article is to explore novel methods of assessing reading fluency conceptualized as an integrative process that coordinates the multiple perceptual, cognitive, and linguistic components involved in reading. Formal definitions of reading fluency vary but often include accuracy and degree of automaticity when reading aloud, with good comprehension (Rasinski, 2008; Samuels, 2006), as well as aspects of expressive prosody or phrasing in oral reading and adherence to syntax (Meyer & Felton, 1999; Raskinski, 2004). Beyond the aspects of prosody and phrasing, fluency is usually thought to refer to a more general ease or naturalness of reading (Pinnell et al., 1995). Two major theoretical foci of fluent reading have emerged: word reading fluency and fluent integration of words across text (Klauda & Guthrie, 2008). Although word reading automaticity accounts for significant variance in text reading fluency (67%; Torgesen, Raschotte, & Alexander, 2001), its explanation is not complete. Something beyond word identification is needed for fluent reading— and indeed context accounts for 22% of adult reading rates (Pelli & Tillman, 2007). Text reading fluency is in this regard distinct from word reading fluency, involving coordination of serially identified words, and synchronization of processes that support reading “in real time” (Berninger et al., 2010, p. 5). And in line with this distinction, fluent text reading bears a stronger relation to comprehension than fluent word reading (Denton et al., 2011; Fuchs et al., 2001; Jenkins, Fuchs, van den Broek, Espin & Deno, 2003). However, text reading fluency has not been well articulated empirically, at least not to the same extent as word reading fluency. Therefore, the focus of the current article is on assessing fluent reading of connected text. The focus of text fluency research has been on oral reading, namely because it is directly observable. Besides oral reading rate, oral expression and prosody are assumed to link directly with comprehending the text because they require syntactic parsing (Dowhower, 1991; Kintsch, 1998; Kuhn & Stahl, 2003). Although fluent reading can be readily described in terms of oral features of adjusting volume, pitch, and pauses to reflect textual meaning (Paige, Rasinski, & Magpuri-Lavell, 2012), it has proven more difficult to objectively measure these elements. However, in studies that have done so, oral reading prosody contributed only weakly, over and above word reading speed, to account for variation in comprehension (e.g., Schwanenflugel, Hamilton, Kuhn, Wisenbaker, & Stahl, 2004). In addition, oral reading is a skill demonstrably independent from silent reading (Kim, Wagner, & Forster, 2011). Given the developmental shift from oral to silent reading around fourth grade, it is important to consider these differences with regard to measuring and training fluency (Hiebert, Samuels, & Rasinski, 2012; Rasinski, Samuels, Hiebert, Petscher & Feller, 2011). Moreover, relations between fluency and comprehension differ between oral and silent reading modes, where oral reading contributions to comprehension decline with age, across Grades 2 to 10 (Denton et al., 2011; Miller & Smith, 1985). Oral reading fluency stabilizes earlier in development than comprehension (Hasbrouck & Tinsdal, 2006; Jenkins & Jewell, 1993; Silberglitt, Burns, Madyun & Lail, 2006), suggesting that oral rate is not a sensitive measure for older readers.
Downloaded by [210.193.45.163] at 22:26 02 July 2014
COMPLEXITY METRICS FOR SILENT READING FLUENCY
237
In sum, oral reading does not appear to adequately gauge fluent text comprehension. Measures of silent reading fluency are currently limited to tasks with short texts (e.g., sentence verification, cloze or maze tasks), which do not correspond well to the types of extended texts that make up much of student work (e.g., chapter or novel reading). This calls for improved means of measuring fluency during silent reading of ecologically valid text, which can contribute to a practical understanding of the factors involved in fluency development (Whithear, 2011). The aim of the present study is to expand the research on text reading fluency to include silent reading. Thus, in this article we aim to advance investigation on reading fluency by examining silent as well as oral reading of connected passages of text from the perspective that fluency involves coordination of the component skills of reading. From this perspective, the interrelationships of these component skills are assumed to be nonlinear. Therefore, we undertook an application of nonlinear analytic methods from dynamical systems theory to the problem of assessing reading fluency. These methods have become increasingly used in experimental psychology, beyond measuring performance speed, and may contribute to the call for new ways of measuring silent reading. So-called complexity metrics were developed to study the stability of systems that involve a complex weave of processes and products (e.g., Riley & Van Orden, 2005). That is, traditional assumptions that human behavior (including reading times) can be adequately summarized with a static mean and variance statistic have given way to new conceptualizations of behavior as a dynamic process that involves changes over time, and that information about the cognitive system can be gained from observing these dynamic changes. Although aspects of a behavior, such as response times, change from moment to moment, these aspects may nevertheless repeat in predictable patterns. Recurring patterns, then, suggest dependencies in the underlying system that manifest as a type of memory. That is, a cognitive system tuned to fluent reading involves coordination of multiple processes (for sound, print, and meaning) across multiple levels of language (subword, word, and integration across words). Such coordinative structure does not simply engender faster moment-to-moment responses but instead a patterning of responses connected by linguistic features of the text, for instance. Complexity metrics (explained next) can enable detection of these more subtle signatures of rhythmicity in behavior. That is, like the observable patterns in oral reading, where fluent readers sometimes speed up or slow down across sentence and phrase boundaries, for example (Paige et al., 2012), such patterns may also occur in silent reading. This form of fluency contrasts with simply efficient decoding, with consistently automatic word-by-word reading that some teachers refer to as “word calling” (Hamilton & Shinn, 2003; Meisinger, Bradley, Schwanenflugel, Kuhn, & Morris, 2009). Complexity measures might provide a viable alternative to the metric of speed to evaluate self-paced silent reading of continuous text. Complexity metrics have previously been applied to study many kinds of motor and cognitive performances (e.g., Gilden, 2001; Riley & Turvey, 2002), including language development (e.g., Dale & Spivey, 2006; Shockley, Richardson, & Dale, 2009) and reading (Holden, 2002; Holden, Van Orden, & Turvey, 2009; Van Orden, Holden, & Turvey, 2003; Wallot & Van Orden, 2011; Wallot, O’Brien, & Van Orden, 2012). A key advantage of these methods is that they make no assumptions about the component processes of the systems they measure, seeking to characterize the form of the interaction among the components instead (e.g., Holden et al., 2009; Kelso, 1995). For reading fluency, this means that the components that give rise to it need not be identified prior to evaluating the stability of reading fluency. This approach therefore provides a means of
238
O’BRIEN ET AL.
Downloaded by [210.193.45.163] at 22:26 02 July 2014
evaluating the quality of the coordination of multiple processes brought to bear on the task of resolving serially identified words for text reading. To this end, we investigated several complexity metrics that have previously been used to evaluate text and word reading performance (Wallot et al., 2012; Wijnants, Hasselman, Cox, Bosman, & Van Orden, 2012). In the current reading study, these metrics are used to compare oral and silent reading modes. The first analysis examines the fractal structure of the time series of word reading across a text passage and yields a fractal scaling exponent (Hurst exponent). The second and third analyses quantify recurrent patterns in the reading time series within a single reader, and across a set of readers (recurrence quantification analysis and cross-recurrence analysis, respectively). Both recurrence quantification methods yield measures of recurrence, determinism and average pattern length (mean-line). Each of these three analysis methods and their implications for reading dynamics are explained next.
COMPLEXITY METRICS Fractal Analysis Fractal analysis describes how trial-by-trial variability in a time series changes (or remains stable) across different time scales and is used here to describe the fractal structure of the intereventtimes (see Gilden, 2001; Holden, 2005; Peng, Havlin, Stanley, & Goldberger, 1995), such as the word-by-word reading times across a text passage in this study. If a data series contains only independent observations, then it is classified as white noise. However, most cognitive performances have been shown to contain substantial degrees of long-range correlations that can be summarized in scaling relations between time-scales of observations and magnitude of variation, which is informative about cognitive processes (Van Orden, Kloos, & Wallot, 2011). In terms of reading performance, the degree of long-range correlations in the data series would index the impact of the history of the text on the current reading process for each word. One could envision the data series as a set of nested waves having different frequencies and amplitudes, where the frequencies correspond to time-scales and the amplitudes to variation in the data. A scaling relation between time-scales and their variations can be estimated as a fitted slope of the plotted variance by time scale data. These scaling exponents have been used previously to quantify the degree of long-range correlation in a time series and are found to be related to the coordination of cognitive processes in human cognition and behavior (Van Orden, 2010; Van Orden et al., 2003). There are several methods available to estimate the scaling relations, including spectral analysis (SA; similar to the description just noted), standardized dispersion analysis (SDA), and detrended fluctuation analysis (DFA). We use DFA to quantify the strength of long-range correlations (the findings are corroborated with SA and SDA techniques). In essence, DFA captures how variance changes with time series length. First, the data series is segmented into equal parts (halves, quarters, eighths, etc.), and variance is computed over these different lengths of the subdata series (e.g., half the words, one fourth of the words in the text, etc.). These variances are then plotted as a function of series length on a log-log plot. The slope of a fitted least-square line estimates the relationship between variance and series length yielding the so-called Hurst exponent, H (see Peng et al., 1995, for a full description of the method). The scaling exponent can be classified as more random (white noise, H = 0.5) to more constrained
Downloaded by [210.193.45.163] at 22:26 02 July 2014
COMPLEXITY METRICS FOR SILENT READING FLUENCY
239
(brown noise, H =1.5). Between these two states exists so-called pink noise (H = 1.0), where the magnitude of response variation is proportional to the timescale (or series length) in which it is measured. Systems that show adaptive coordinated behavior (e.g., a healthy heart rate) are often characterized by such a proportional relationship (power law) between series length and variability, with H close to 1. This suggests that scaling exponents close to 1 can be considered a signature of emergent coordination (Diniz et al., 2011) and might describe fluent reading, whereas less fluent reading is closer to white noise, or random structure. For reading that is fluent, coordination should occur over larger stretches of text, where processing a word would be affected by the prior word, but also by phrases or sentences that came before it. In this way, silent reading may emulate the scheme developed to rate oral reading prosody—as oral expression on a word-by-word, phrase-by-phrase, or sentence-by-sentence basis (see National Assessment of Educational Progress report by Pinnell et al., 1995). With increasing fluency, then, reading performance should move away from uncorrelated white noise (i.e., processing on a word-by-word basis) toward longer range correlations. That is, fluent readers would be expected to have a longer range dependency in their reading times, integrating over slower time-scale processes that deal with such properties of the text as the linguistic and narrative structure. Less fluent readers would, on the other hand, be expected to process the text primarily word by word, and would therefore not show such longer range dependencies. Recurrence Quantification Analysis (RQA) The second set of complexity metrics involves quantifying repeating patterns of the word-reading time-ordered series of an individual reader to assess the degree of constraint, or randomness versus determinism, of the reading system. Recurrence quantification measures stability within the task’s phase space, be it simple or more complex, nonlinear temporal patterns of variation across multiple dimensions. This is done by reconstructing the dynamics of a system with timedelayed copies of its time series that act as surrogate dimensions in the phase space (Webber & Zbilut, 2005). Estimated parameters include the rate of recurrence (or how often a state is revisited, indicating an attractor), percentage determinism (proportion of data points that are part of a recurring pattern, indicating degree of order), and meanline (or the length of time a system repeats itself, indicating stability of the system). Reading systems of more fluent readers are expected to exhibit more structure and stability, with higher recurrence rate, determinism and meanline, as performance (such as change in reading times) is increasingly stabilized by level of skill (Wallot et al., 2012; Wijnants, Bosman, Hasselman, Cox, & Van Orden, 2009; Wijnants et al., 2012). That is, fluent readers would be expected to spend a greater proportion of their reading time (higher percentage determinism) showing longer stretches (longer meanline) of recurring patterns (higher recurrence rate) of word reading variability as they process the story. Cross-Recurrence Analysis (CRQ) The third set of complexity metrics extends RQA to a kind of nonlinear correlation between two different time series (i.e., from two readers) to determine the extent to which the two data sets share dynamic structure. Here, we calculated CRQ for pairwise sets of data within each condition (grade by reading mode). For the present study, this analysis indicates how different individuals approach the same task. This analysis speaks more to the relation of readers to the text, by
Downloaded by [210.193.45.163] at 22:26 02 July 2014
240
O’BRIEN ET AL.
examining whether performance across the individual readers is very similar or very diverse. Similar to RQA, CRQ analysis yields parameters of shared recurrence, shared determinism, and shared mean line. The individual performance of more fluent readers should be less constrained by the text and more idiosyncratic and will thus differ between individuals (Wallot & Van Orden, 2011). That is, when reading the same text under the same conditions, fluent readers will be less constrained by word-by-word processing of the text, following instead their own meanderings through the story in light of larger time scale aspects of the story’s plot, characters, and setting. Although this seems counterintuitive, it follows from reading eye movement findings, where better readers tend to adapt their reading in order to better monitor their understanding of the text (e.g., van der Schoot, Reijntjes, & van Lieshout, 2012). Therefore, fluent readers should show lower shared recurrence, average determinism, and average line length. Two studies have used complexity metrics to evaluate reading performance and how it varies with the ability of individuals (Wijnants et al., 2012) and the difficulty of the task (Wallot, et al., 2012). Wijnants et al. (2012) examined serial word naming performance of dyslexic and nondyslexic children and found that dyslexic word naming times were characterized by lower degrees of coordinative structure and stability. Fractal analysis showed that the dyslexic readers’ response variability across trials had scaling exponents closer to white noise, and RQA showed that they had lower recurrence, determinism, and meanline. Wallot et al. (2012) investigated text reading performance of college students who repeatedly read a text in a self-paced manner (i.e., revealing the text word by word with a key press), where repeated reading is known to increase fluency (e.g., Therrien, 2004). Compared to the initial reading, repeated reading of the text lead to increased individual differences of readers’ time series: CRQ analysis showed lower average recurrence and determinism. In this case, practice yielded performances that were increasingly idiosyncratic. Fractal exponents also increased with text familiarity. In sum, both studies provide first evidence that reading skill is related to aspects of stability and instability of reading performance. Overall, more fluent reading, due to either reader skill or task ease from practice, was characterized by more stable and flexible as well as idiosyncratic performance. In the present study, we examined the use of complexity metrics in characterizing silent as compared with oral reading as a viable way to evaluate the quality of the interaction of readers with text. That is, we tested whether these measures can be used to quantify fluency as processing text across longer time scales, with more orderliness but also the cognitive flexibility to navigate changes as they unfold in the story. Time-ordered series of readers’ word-by-word response times during story reading were collected from children in Grades 2, 4, and 6, and from adults in college who were randomly assigned to reading mode conditions (oral vs. silent reading). All participants read the same story (rated as second-grade level), yielding different degrees of fluency competence. We compared the temporal structure of response variability in oral versus silent reading, and observed differences across cohorts that varied in fluency in this contrast. Based on the published results of nonlinear dynamics in reading, whereby more fluent reading was more flexibly stable, closer to pink noise, and more structured with greater recurrence but less shared recurrence values, the following hypotheses were tested: H1: With increasing fluency, across grade level cohorts, we expect that: a. fractal scaling exponents will shift from white to pink noise as fluent readers show longer range dependencies in their reading-time series.
COMPLEXITY METRICS FOR SILENT READING FLUENCY
241
b. recurrence quantification will show more stable, deterministic structure as increasing recurrence rate, determinism, and meanline. c. cross-recurrence quantification will show less similarity, marked by decreasing shared recurrence, shared determinism, and shared mean line between peers, indicating that younger peers have common sources of constraint from the text while older peers interact with text in unique ways.
Downloaded by [210.193.45.163] at 22:26 02 July 2014
H2. Silent reading compared with oral reading will be more coordinated, stable, and deterministic, especially for more fluent readers, that is, for older cohorts. We therefore expect that: a. fractal scaling exponents will be closer to pink noise for silent reading than oral reading overall, and silent reading will diverge more from oral reading fractal scaling in older cohorts, as silent compared with oral reading is expected to become more fluent in the older groups. b. recurrence quantification will show greater stability and deterministic structure for silent reading overall, with higher recurrence rate, determinism, and meanline compared with oral reading, and increasingly so for older groups. c. generally, reading times should show decreased shared recurrence, average shared determinism, and average shared mean line between peers with age for both oral and silent reading.
METHOD Participants Sixty-two children between 6 and 13 years of age were recruited from urban elementary schools in the United States serving predominantly middle-class families of mixed racial background. Children considered as average readers by their teacher were selected to take part. Eight children (six second graders and two fourth graders) were tested but excluded from the final sample because they did not complete the story and thus did not meet the inclusion criterion of having produced a data series of more than 900 data points. Most of these children were in the silentreading condition (n = 7). This criterion was adopted as a trade-off, considering that it would include those who had read at least five of the six pages of the story and that 900 data points are still sufficient to estimate reliable fractal scaling exponents (Holden, 2005). The final sample (26 boys and 28 girls) consisted of 19 second graders (M = 7.8 years, SD = 4.9 months), 20 fourth graders (M = 10.0 years, SD = 5.7 months), and 15 sixth graders (M = 12.0 years, SD = 3.9 months), as well as 17 adults (M = 24.5 years, 6 men, 11 women) who functioned as a comparison group. All participants were native speakers of English, and all had normal or corrected-to-normal vision. Also, all participants reported that they were unfamiliar with the story. Participants were randomly assigned to either the silent-reading condition (n = 35) or the read-aloud condition (n = 36). Stimuli and Apparatus Children read the story Alien and Possum: Hanging Out by Tony Johnston (2003). The text describes two friends, Alien and Possum, and the various things they do over several days (such
242
O’BRIEN ET AL.
Downloaded by [210.193.45.163] at 22:26 02 July 2014
as having conversations about their lives, celebrating birthdays, or climbing trees). The difficulty of the text was rated to be appropriate for somewhat advanced second graders (ATOS book level of 2.5), with the content being rated as interesting (4.5 out of 5) by readers (Accelerated Reader, 2011). The original text consisted of 1,201 words, but it was carefully trimmed down to 1,099 words to reduce reading time for the children, while satisfying the lower bound of data points necessary to conduct the analyses (see Holden, 2005; Wallot & Van Orden, 2011). Also, none of the illustrations in the original book were presented with the text. The text was displayed on a conventional 15-in. MacBook, with a custom script (MatLab-Psychophysicstoolbox; Brainard, 1997) running the text presentation software. Participants advanced through the text in a self-paced manner by pressing the space bar to reveal every new word of the text, with text accumulating on the screen word by word. The time between key presses was taken to estimate the reading time of the word unit. Procedure Children were tested individually in a quiet area at their school, and adults were tested in a university laboratory room. A sample sentence was presented first, before commencing the story. Participants were instructed to read at their own pace for understanding and told that they would be given comprehension questions when they completed the story. Participants in the silent-reading condition were instructed, “Read the words as they come up silently, to yourself.” Participants in the read-aloud condition were instructed, “Say the words as they come up—so you are reading out loud.” Comprehension was assessed with six multiple-choice questions that were read to the participants, then with free recall asking them to summarize the story. Only the multiple-choice response accuracy is reported here (Cronbach’s α = .71) and was considered as a check that participants read for understanding. Reading took 10 to 20 min, and children were rewarded with a little gift.
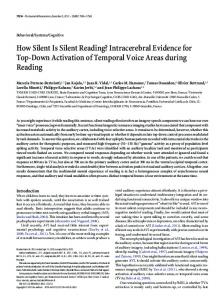
DATA PREPARATION The time between key presses was turned into a time-ordered series of word reading times for each participant (Figure 1 shows examples of individual readers’ time series data). Extreme response times of 10 s or longer were removed (eliminating 0.1% of all data points), a threshold adapted to relatively slow reading performance of second graders (extreme times were more than 4 SD beyond the Grade 2 mean). Fractal scaling exponents were quantified using Detrended Fluctuation Analysis (Peng et al., 1995). The measures obtained from recurrence and crossrecurrence quantification analyses were computed using the Commandline Recurrence Plots software (Marwan, 2011). For the computation of cross-recurrence, reading times were converted to z-scores to ensure that cross-recurrences were not influenced by simple differences in level and magnitude of variation (Shockley, 2005). The RQA parameters were estimated using recommendations by Webber and Zbilut (2005).1 1 All
data sets were entered into the analysis with parameters of delay = 1, dimension = 5, and Euclidean norm.
Downloaded by [210.193.45.163] at 22:26 02 July 2014
COMPLEXITY METRICS FOR SILENT READING FLUENCY
243
FIGURE 1 Individual readers’ time series data. Examples of time series data from eight participants in the silent (left panel) and oral (right panel) reading conditions. Readers across the different cohorts are displayed by row: first row—Grade 2, second row—Grade 4, third row—Grade 6, and bottom row—adults. Data points represent the response time (y-axis, in seconds) per word in the order in which it appears in the story (x-axis).
After all statistics were computed, normality test revealed that all moments resulted in significantly skewed distributions (K-S < .282, all ps < .035) with the exception of DFA (K-S < .241, all ps > .189). Hence, all data were logarithmically transformed before submission to analysis of variance (ANOVA; Schroeder, 2011), resulting in fair normal distribution (K-S < .250, all ps > .076). For the CRQ measures, a bootstrap technique was used because there was concern that using all pairwise CRQ metrics may violate the assumption of independence of observations. Because six contrasts were evaluated (fractal analysis and three RQA measures and three CRQ measures), we used a Bonferroni adjustment to the alpha value for significant effects from the conventional α = 0.05 to α = 0.007. For CRQ, this meant that confidence intervals (CI) are reported for the 99th CI instead of the conventional 95th CI.
244
O’BRIEN ET AL.
RESULTS Traditional Analysis
Downloaded by [210.193.45.163] at 22:26 02 July 2014
Reading Rate Table 1 shows traditional metrics of reading fluency, reported as reading rate (words per minute), and separated by mode condition (silent vs. oral reading) and cohort (second graders, fourth graders, sixth graders, adults). An ANOVA revealed a mode by cohort interaction, F(3, 66) = 6.62, p = .005, η2 = .232. Looking at reading times separately for each condition, two separate one-way ANOVAs were conducted, one for silent-reading times and one for the oral-reading times, both of them revealing significant effects (Fs > 6.0, ps < .01). For silent reading, all children’s reading times were reliably slower than those obtained for adults, with no differences between the child cohorts (Student-Newman-Keuls range test [SNK], ps < .05). For oral reading, second graders’ reading times were reliably slower than fourth graders’, which in turn were slower than adults’ (SNK, ps < .05). Sixth graders’ reading times were reliably different neither from those of fourth graders nor from those of adults. Comprehension A two-way (mode by cohort) ANOVA was run comparing comprehension scores on the multiplechoice questions. Overall, there was no general difference in comprehension between the two reading modalities, F(1, 66) = 1.26, p = .27, but performance did increase over grade, F(3, 66) = 14.24, p < .001, η2 = .393, whereby second graders had lower comprehension scores
TABLE 1 Reading Rate and Comprehension Scores for Oral and Silent Reading by Grade
Age
Comprehension
Reading Rate (Sample)
Reading Rate (Benchmarks)
Oral reading Grade 2 Grade 4 Grade 6 Adults
7.7 (0.4) 10.1 (0.6) 11.9 (0.3) 24.0 (9.0)
66.6% 85.4% 85.6% 100%
43.0 (10.7) 78.2 (26.4) 90.1 (21.5) 112.1 (28.3)
53 90 127 261
Silent reading Grade 2 Grade 4 Grade 6 Adults
7.7 (0.4) 10.0 (0.6) 12.0 (0.4) 24.2 (8.5)
57.3% 88.1% 91.5% 98.1%
92.4 (35.8) 78.7 (22.7) 88.8 (22.5) 174.3 (34.3)
115 158 185 250–280
Note. Reading time is average words per minute, and comprehension is reported as percent correct on average for the groups. The column Reading Rate (Sample) presents the reading rates observed in this study, the column Reading Rate (Benchmarks) presents the benchmark reading rates derived from Hasbrouck and Tindal (2006) and Carver (1989, 1990).
Downloaded by [210.193.45.163] at 22:26 02 July 2014
COMPLEXITY METRICS FOR SILENT READING FLUENCY
245
FIGURE 2 Average fractal scaling exponents from DFA by cohort and reading mode. Fractal scaling is reported as a Hurst exponent, where H = 0.5 corresponds to random “white noise” and H = 1.0 corresponds to “pink noise.”
than fourth and sixth graders, who in turn had lower comprehension scores than adults (SNK, ps < .05). Complexity Metrics Fractal structure of reading times. Figure 2 shows average scaling exponents (Hurst) obtained from the DFA, separated by cohort and mode. A Reading Mode × Cohort ANOVA revealed a reliable effect of reading mode, F(1, 66) = 23.39, p < .001, η2 = .262, with lower average scaling exponents for oral reading compared with silent reading. These results were corroborated with two other fractal analysis techniques (SA and SDA). The main effect of grade and the interaction of Mode × Cohort were not significant (Fs < 0.70).2 Recurrence Quantification Analysis of reading times. Rate of recurrence, determinism, and meanline of individual reading time-series were submitted to ANOVAs with reading mode and cohort as factors. Figure 3 presents the average recurrence rates for each cohort in each mode condition. The ANOVA for recurrence rate revealed a main effect of mode, F(1, 66) = 12.97, p < .001, η2 = .175, where silent reading yielded higher recurrence rates than oral reading overall. The main effect of cohort was also significant, F(3, 66) = 17.67, p < .001, η2 = .423, with less recurrence for all second graders compared to fourth and sixth graders, who had in turn less recurrence than adults (SNK, ps < .05). The Mode × Cohort interaction did not reach significance, F(3, 66) = 2.07, p = .11. 2 The interevent time series of word-reading times was also converted into a continuous time series of words-perminute (WPM), analogous to BPM calculated from RR intervals in heart rate. We used an "oversampled” WPM-series of maximal sensitivity of the analysis with a 200-ms window (Wallot, Fusaroli, Tylén, & Jegindø, 2013). DFA was performed on this data as before, and the effect of oral versus silent reading remained stable, F(1, 66) = 17.77, p < .001. There were no other significant effects.
Downloaded by [210.193.45.163] at 22:26 02 July 2014
246
O’BRIEN ET AL.
FIGURE 3 Average rate of recurrence from RQA by cohort and reading mode.
Figure 4 presents the average determinism for each cohort in each condition. Similar to recurrence rate, the ANOVA for determinism revealed a main effect of mode, F(1, 66) = 11.07, p < .001, η2 = .153, with higher determinism for silent reading in general. The main effect of cohort was also significant, F(3, 66) = 10.80, p < .001, η2 = .319, whereby determinism of reading times for second graders was less compared to fourth and sixth graders, who had in turn less deterministic reading times than adults (SNK, ps < .05). There was no significant interaction between the factors, F(3, 66) = 2.49, p = .068. In Figure 5, the average meanline is presented for each cohort in each condition. The ANOVA for meanline showed significant effects of cohort, F(3, 66) = 15.01, p < .001, η2 = .377, and
FIGURE 4 Average rate of determinism from RQA by cohort and reading mode.
Downloaded by [210.193.45.163] at 22:26 02 July 2014
COMPLEXITY METRICS FOR SILENT READING FLUENCY
247
FIGURE 5 Average meanline length from RQA by cohort and reading mode.
reading mode, F(1, 66) = 19.45, p < .001, η2 = .236. No interaction effect was apparent, F(3, 66) = 2.00, p = .12. In general, adults showed longer meanline than all other cohorts within both reading modes (SNK, ps < .05). Cross-Recurrence Quantification Analysis of reading times. Cross-recurrence is computed with two sets of reading time series data to determine their shared dynamic structure. For the set of participants within each reading mode condition for each cohort, we computed CRQ for every possible pair of participants. The metrics of shared recurrence, average determinism, and shared meanline length were submitted to a bootstrap-procedure (Efron, 1979), drawing 1,000 subsamples from each set of data. Then confidence intervals were constructed (“nonstudentized” intervals; Carpenter & Bithell, 2000) for each cell in the design per cross-recurrence measure. Table 2 reports the average cross-recurrence measures together with the associated 99% confidence intervals. As can be seen in the table, cross-recurrence, cross-determinism, and crossmean line are lower for sixth graders and adults compared to second graders and fourth graders during oral reading, but there were no such differences between the groups during silent reading.
DISCUSSION The current study was an exploration of the potential usefulness of nonlinear complexity metrics as a viable alternative to traditional rate-based measures for evaluating reading fluency and in particular silent reading fluency. Although a componential view of reading has led to fruitful research in teaching and remediation of reading subskills, the concept of fluency as a coordinative process for integrating these subskills has left the field wanting for ways to measure such a coordinative, whole-greater-than-sum-of-parts process. In light of this, the observed set of complexity measures made several distinctions that would not have been evident from traditional reading rate measures. Reading rate in words per minute, for example, showed no difference
248
O’BRIEN ET AL.
TABLE 2 Cross-Recurrence Variables Between Readers Within Each Group 2nd Grade
4th Grade
6th Grade
Adults
Cross-recurrence rate Oral 0.138a (0.089−0.254) Silent 0.145a (0.102−0.233)
0.09a (0.068−0.119) 0.116a (0.095−0.142)
0.03b (0.021−0.042) 0.108a (0.088−0.135)
0.026b (0.019−0.037) 0.109a (0.086−0.135)
Cross-determinism rate Oral 0.843a (0.810−0.879) Silent 0.846a (0.810−0.879)
0.817a (0.787−0.845) 0.863a (0.842−0.883)
0.689b (0.637−0.731) 0.864a (0.844−0.884)
0.693b (0.659−0.724) 0.859a (0.826−0.888)
3.71a (3.475−4.071) 4.13a (3.843−4.498)
2.99b (2.817−3.248) 4.11a (3.831−4.515)
2.90b (2.793−3.023) 4.29a (3.966−4.664)
Downloaded by [210.193.45.163] at 22:26 02 July 2014
Cross-mean line Oral Silent
4.70a (3.803−7.548) 4.60a (4.019−5.724)
Note. The table presents the average cross-recurrence rates, average cross-determinism rate, and cross-mean line together with the 99% confidence intervals for each reader group. Values that significantly differ from each other (i.e., whose confidence intervals do not overlap) are marked with different subscript letters.
between oral and silent reading modes for Grade 4 and 6 readers, suggesting equivalent reading modes for readers of that age. Complexity metrics applied to the time series data of story reading did, on the other hand, distinguish between oral and silent reading modes across all age levels. The rate measures also showed change in oral but not silent reading across primary school Grades 2 to 6, whereas some of the complexity metrics differed across these grades for both modes. The overall pattern of these results suggests complexity metrics may be a viable way to evaluate fluent reading. However, some of the complexity measures supported our predictions, whereas others did not. Based on our predictions, more fluent reading should generally show increasing structure and stability of reading times that is not over- or underconstrained. Fractal analysis, which was used to evaluate a flexibly-stable coordinated state, did not show any change over the cohort groups. This was unexpected, because we predicted that with increasing fluency readers would show longer range dependencies in their reading times, such that they treat words as groups of clauses or sentences rather than individually, which should result in fractal scaling (closer to pink noise). The RQA measures did support the prediction that with increasing fluency the rate of recurrence, determinism, and meanline would increase, indicating that more fluent readers show a higher degree of order in the temporal structure of their response variability. This was shown as adult readers had higher recurrence, determinism, and meanline compared to children, and Grade 4 and 6 readers had higher recurrence and determinism than those in Grade 2. CRQ as well supported the prediction that the more fluent readers would be less like their peers in the temporal patterns of their response times. That is, we expected more fluent readers to be less constrained by the wordby-word processing of the text and to show their own idiosyncracies as they engaged with the text at multiple levels, including linguistic and cognitive processing of the narrative unfolding over time. The readers beyond Grade 4 did show lower shared recurrence, determinism, and meanline, but this difference only held for oral reading. With regard to gauging differences in fluency, then, fractal analysis appeared to be less sensitive than recurrence analysis here. This may be due to the intermittent occurrence of longer reading times, which leads to a decrease in the reliability of the scaling estimates (i.e., Ihlen
Downloaded by [210.193.45.163] at 22:26 02 July 2014
COMPLEXITY METRICS FOR SILENT READING FLUENCY
249
& Vereijken, 2010), against which recurrence analysis is much more robust (i.e., Webber & Zbilut, 2005). However, although recurrence analysis appeared to be more sensitive to changes in fluency across the cohorts, these measures did not necessarily vary linearly with age. Instead some measures differentiated the adults from all children, with the exceptions of recurrence rate and determinism, which differentiated Grade 2 from Grades 4 and 6 versus adults, and shared recurrence, determinism and meanline, which differentiated at the point between Grades 4 and 6. Concerning reading mode, the predictions for oral reading having more random, less deterministic structure, and less flexible stability than silent reading were borne out. Reading aloud yielded lower fractal scaling exponents on average, exponents that were closer to white noise, whereas reading silently yielded scaling closer to pink noise indicative of a flexibly, dynamic stability. From RQA, silent reading’s greater stability of performance was indicated by greater percent recurrence and determinism, and by meanline, which showed the greatest difference from oral reading in adult readers. For CRQ analysis, the effect of increased idiosyncrasies with reading skill was apparent in oral reading. Shared recurrence, determinism, and meanline differentiated Grade 6 and adults from Grade 2 and 4 oral readers, but level of shared determinism was equal across cohorts who read silently, indicating that all were similarly constrained by the structure of the text. So although all three measures did not follow expectations for silent reading, CRQ did provide additional information compared to traditional reading rate measures. From traditional reading times, it appears that Grade 2 readers showed the same silent reading advantage as adults, reading faster silently than aloud. Yet, looking at the CRQ measures, second graders showed no difference across modes in shared recurrence, determinism, or meanline, whereas adult readers did. Further, despite equivalent oral reading rates between Grade 4 and 6 readers, Grade 6 oral reading appeared more adultlike in terms of individual idiosyncrasies, with less shared determinism compared with Grade 4 oral reading. Other researchers have reported differences between oral and silent reading (Denton et al., 2011; Hasbrouck & Tinsdal, 2006; Jenkins & Jewell, 1993; Kim et al., 2011; Kim, Wagner & Lopez, 2012; Rasinksi et al., 2011; Silberglitt et al., 2006), and the current results provide further insight into the structural properties of the reading system assembled to perform these two tasks. Oral reading across all grade levels showed lower fractal scaling exponents than silent reading, indicating more random structure closer to white noise. Conceptualized in terms of voluntary control (cf. Diniz et al., 2011), a whitened signal suggests that oral reading moves the balance on the part of the reader toward an emphasis on the faster time scale processes of identifying phonological properties of the text for articulation. In this sense, oral reading may be considered as a kind of dual-task, where factors other than comprehension and core properties of reading play a role: The cognitive and motor skills related directly to speech are employed in addition to, and simultaneous with, word recognition and comprehension processing. Silent reading, on the other hand, gives the appearance of less vulnerable or effortful performance with regard to stimulusto-stimulus processing on shorter time-scales and a greater emphasis on the slower time scale processes aligned with comprehension (Donald, 2007) and intentions to meet task instructions. This fits with previous findings of increased scaling exponents for familiar text in adults, from which Wallot et al. (2012) concluded that one aspect of more fluent text reading on the part of the reader in responding to a word is to rid himself of the surface properties of that word. In support of this conclusion, Wallot, Hollis, and Van Rooij (2013) have shown that lexical variables such as word length or word frequency play no substantial role in fluent reading of connected text. The present findings suggest that complexity metrics may provide new information about fluent text reading and, therefore, could serve as useful research tools into fluency acquisition and
Downloaded by [210.193.45.163] at 22:26 02 July 2014
250
O’BRIEN ET AL.
development. They could provide a more sensitive metric for outcome measures of fluency training, for example, by assessing children who show structured stability characteristic of fluent reading even though their reading rate may remain slow and deliberate. But there are several caveats, and additional work is required to better establish the extent of their utility. The current task involved a key-press response to advance the text for reading, which may limit the external validity of the results, and perhaps limited differences in fractal scaling between the groups here. Similar patterns of results are found between the self-paced reading task as used here and eye tracking during hands-free reading (Wallot, 2011), although in that study fractal analysis of eye-tracking data was more sensitive to fluency differences than it was for key-press data. Thus, future replication with eye-tracking methods during more continuous reading is warranted. Also, the present results require replication with longitudinal data, with stories of different difficulty levels, and with consideration of individual differences in reading ability (the present sample was rated as average readers by their teacher). In conclusion, the consensus view from cognitive science is that fluent reading emerges from multiple cognitive components, including orthographic, phonological, and semantic processes for word reading, in addition to grammatical, syntactic, and semantic linguistic processes for word integration of connected text (e.g., Benjamin & Gaab, 2012; Klauda & Guthrie, 2008; Perfetti, 1992; Plaut, 1997). This contrasts with the narrow view of fluency as fast, accurate oral reading sustained by an efficient word recognition system (National Reading Panel, 2000), and has led to a gap in how we conceptualize fluent reading versus how we measure it. Critically, multiple cognitive components need to become well integrated to support proficient reading (Feng, 2008). Loosely speaking, the disparate neural substrate of these subsystems must be assembled and integrated through experience (Wolf, 2007), not unlike the soft-assembled coordinative structures that emerge for motor enaction (Kloos & Van Orden, 2009; Turvey, 1990). According to this view, coordinative structures yield an emergent interdependence where components act together across multiple scales of time. For reading, interactions with the narrative and linguistic properties of a text are layered in time: A story’s plot, its character, or setting may change slowly, slower than the change in paragraphs or sentences, and much slower than changes in letters, words, and syntax. The thoughtful interaction between reader and text must negotiate this complex temporal landscape (cf. Berninger et al., 2010; Cartwright, Hodgekiss, & Isaac, 2008; Levy & Collins, 2008; Meyer & Felton, 1999; Raskinski, 2004, 2008; Van Orden, Pennington, & Stone, 1990). It is this kind of complexity that recommends the methods we presented here for evaluating reading fluency. As suggested by Paulson (2005), a reading system can be modeled as a chaotic system, where “nonlinear, dynamic, and iterative reading processes may contribute to the ability of readers to respond to new information, clarify ambiguous information, and correct misunderstandings during reading” (p. 355). In this aspect, complexity measures are well suited for assessing the type of interaction dominance theorized as the cognitive underpinning of fluent reading (Hudson, Pullen, Lane, & Torgesen, 2009; Katzir et al., 2006; Wijnants et al., 2012).
ACKNOWLEDGMENTS We thank the students who participated in the research and the school principals and teachers who assisted in this work; Brenda Miller, Jacquelyn Rowedder, Kevin, Hardy, Melanie Hogue, Rachel
COMPLEXITY METRICS FOR SILENT READING FLUENCY
251
Pappenfus, Herman Daniels, and anonomous reviewers for their input. Deep gratitude is also felt for the vision provided by our late colleague, Guy Van Orden, who remains an inspiration.
FUNDING Preparation of this article was supported by NSF Grants to Guy Van Orden (BCS #0642716, BCS#0843113 and DHB #0728743).
Downloaded by [210.193.45.163] at 22:26 02 July 2014
REFERENCES Accelerated Reader. (2011). Book Finder US. Retrieved from http://www.arbookfind.com/bookdetail. aspx?q=59508&l=EN&slid=194455065 Bashir, A. S., & Hook, P. E. (2009). Fluency: A key link between word identification and comprehension. Language, Speech, and Hearing Services in Schools, 40, 196–200. Benjamin, C. F. A., & Gaab, N. (2012). What’s the story? The tale of reading fluency told at speed. Human Brain Mapping, 33, 2572–2585. Berninger, V. W., Abbott, R. D., Trivedi, P., Olson, E., Gould, L., Hiramatsu, S. . . ., Westhaggen, S. Y. (2010). Applying the multiple dimensions of reading fluency to assessment and instruction. Journal of Psychoeducational Assessment, 28, 3–18. Brainard, D. H. (1997). The psychophysics toolbox. Spatial Vision, 10, 433–436. Carpenter, J., & Bithell, J. (2000). Bootstrap confidence intervals: When, which, what? A practical guide for medical statisticians. Statistics in Medicine, 19, 1141–1164. Cartwright, K., Hodgekiss, M. D., & Isaac, M. C. (2008). Graphophonological-semantic flexibility: Contributions to skilled reading across the lifespan. In K. B. Cartwright (Ed.), Literacy processes: Cognitive flexibility in learning and teaching (pp. 142–164). New York, NY: Guilford. Carver, R. P. (1989). Silent reading rates in grade equivalents. Journal of Literacy Research, 21, 155–166. Carver, R. P. (1990). Reading rate: A review of research and theory. San Diego, CA: Academic Press. Cassidy, J., Ortlieb, E., & Shettel, J. (2011). What’s hot for 2011. Reading Today, 28, 6–8. Dale, R., & Spivey, M. J. (2006). Unraveling the dyad: Using recurrence analysis to explore patterns of syntactic coordination between children and caregivers in conversation. Language Learning, 56, 391–430. Denton, C. A. Barth, A. E., Fletcher, J. M., Wexler, J., Vaughn, S., Cirino, P. T.. . ., Francis, D. J. (2011). The relations among oral and silent reading fluency and comprehension in middle school: Implications for identification and instruction of students with reading difficulties. Scientific Studies of Reading, 15, 109–135. Diniz, A., Wijnants, M. L., Torre, K., Barreiros, J., Crato, N., Bosman, A. M. T.. . ., & Delignieres, D. (2011). Contemporary theories of 1/f noise in motor control. Human Movement Science, 30, 889–905. Donald, M. (2007). The slow process: A hypothetical cognitive adaption for distributed cognitive networks. Journal of Physiology–Paris, 101, 214–222. Dowhower, S. L. (1991). Speaking of prosody: Fluency’s unattended bedfellow. Theory Into Practice, 30, 165–175. Efron, B. (1979). Bootstrap methods: Another look at the jackknife. The Annals of Statistics, 7, 1–26. Feng, G. (2008). Orthography and eye movements: The paraorthraphic hypothesis. Retrieved from http://www.academia. edu/228484/Feng_G._2008_._Orthography_and_Eye_Movements_The_Paraorthographic_Linkage_Hypothesis Fuchs, L. S., Fuchs, D., Hosp, M. K., & Jenkins, J. R. (2001). Text fluency as an indicator of reading competence: A theoretical, empirical, and historical analysis. Scientific Studies of Reading, 5, 239–256. Gilden, D. L. (2001). Cognitive emissions of 1/f noise. Psychological Review, 108, 33–56. Good, R. H., Kaminski, R. A., & Dill, S. (2002). DIBELS Oral Reading Fluency. In R. H. Good & R. A. Kaminski (Eds.), Dynamic indicators of basic early literacy skills (6th ed., pp. 30–38). Eugene, OR: Institute for the Development of Educational Achievement. Hamilton, C., & Shinn, M. R. (2003). Characteristics of word callers: An investigation of the accuracy of teachers’ judgements of reading comprehension and oral reading skills. School Psychology Review, 32(2), 228–240.
Downloaded by [210.193.45.163] at 22:26 02 July 2014
252
O’BRIEN ET AL.
Hasbrouck, J., & Tindal, G. A. (2006). Oral reading fluency norms: A valuable assessment tool for reading teachers. The Reading Teacher, 59, 636–644. Hiebert, E. F., Samuels, S. J. & Rasinski, T. (2012). Comprehension-based silent reading rates: What do we know? What do we need to know? Literacy Research and Instruction, 51, 110–124. Holden, J. G. (2002). Fractal characteristics of response time variability. Ecological Psychology, 14, 53–86. doi:10.1080/10407413.2003.9652752 Holden, J. G. (2005). Gauging the fractal dimension of response times from cognitive tasks. In M. A. Riley & G. C. Van Orden (Eds.), Contemporary nonlinear methods for behavioral scientists: A webbook tutorial (pp. 267–318). Retrieved from http://www.nsf.gov/sbe/bcs/pac/nmbs/nmbs.jep Holden, J. G., Van Orden, G., & Turvey, M. T. (2009). Dispersion of response times reveals cognitive dynamics. Psychological Review, 116, 318–342. Hosp, M. K., & Fuchs, L. S. (2005). CBM as an indicator of decoding, word reading, and comprehension: Do relations change with grade? School Psychology Review, 34, 9–26. Hudson, R. F., Pullen, P. C., Lane, H. B., & Torgesen, J. K. (2009). The complex nature of reading fluency: A multidimensional view. Reading & Writing Quarterly, 25, 4–32. Ihlen E. A. F., & Vereijken, B. (2010). Interaction-dominant dynamics in human cognition: Beyond 1/fα fluctuation. Journal of Experimental Psychology: General, 139, 426–463. Jenkins, J. R., Fuchs, L. S., van den Broek, P., Espin, C., & Deno, S. L. (2003). Sources of individual differences in reading comprehension and reading fluency. Journal of Educational Psychology, 95, 719–729. Jenkins, J. R., & Jewell, M. (1993). Examining the validity of two measures for formative teaching: Reading aloud and maze. Exceptional Children, 59, 421–432. Johnston, T. (2003). Alien and possum: Hanging out. New York, NY: Aladdin. Katzir, T., Kim, Y., Wolf, M., O’Brien, B.A., Kennedy, B., Morris, R., & Lovett, M. W. (2006). Reading fluency: The whole is more than the parts. Annals of Dyslexia, 56, 51–82. Kelso, J. A. S. (1995). Dynamic patterns: The self-organization of brain and behavior. Cambridge, MA: MIT Press. Kim, Y., Wagner, R. K., & Foster, E. (2011). Relations among oral reading fluency, silent reading fluency, and reading comprehension: A latent variable study of first-grade readers. Scientific Studies of Reading, 15, 338–362. Kim, Y., Wagner, R.K. & Lopez, D. (2012). Developmental relations between reading fluency and reading comprehension: A longitudinal study from Grade 1 to Grade 2. Journal of Experimental Child Psychology, 113, 93–111. Kintsch, W. (1998). Comprehension: A paradigm for cognition. New York, NY: Cambridge University Press. Klauda, J. T., & Guthrie, S. L. (2008). Relationships of three components of reading fluency to reading comprehension. Journal of Educational Psychology, 100, 310–321. Kloos, H., & Van Orden, G. C. (2009). Soft-assembled mechanisms for the unified theory. In J. P. Spencer, M. Thomas, & J. McClelland (Eds.), Toward a new grand theory of development? Connectionism and dynamics systems theory reconsidered (pp. 253–267). Oxford, UK: Oxford University Press. Kuhn, M. R. & Stahl, S. A. (2003). Fluency: A review of developmental and remedial practices. Journal of Educational Psychology, 95, 3–21. Levy, B. A., & Collins, W. M. (2008). Fluent reading and the representation of texts. In K. B. Cartwright (Ed.), Literacy processes: Cognitive flexibility in learning and teaching (pp. 234–253). New York, NY: Guilford Press. Marwan, N. (2011). Commandline recurrence plots. Retrieved from http://www.agnld.uni-potsdam.de/marwan/6. download/rp.php Meisinger, E. B., Bradley, B. A., Schwanenflugel, P. J., Kuhn, M. R. & Morris, R. D. (2009). Myth and reality of the word caller: The relation between teacher nominations and prevalence among elementary school children. School Psychology Quarterly, 24(3), 147–150. Meyer, M. S., & Felton, R. H. (1999). Repeated reading to enhance fluency: Old approaches and new directions. Annals of Dyslexia, 49, 283–306. Miller, S. D., & Smith, D. E. (1985). Differences in literal and inferential comprehension after reading orally and silently. Journal of Educational Psychology, 77, 341–348. National Reading Panel. (2000). Fluency. Teaching children to read: Reports of the subgroups (NIH Publication No. 00–4754). Washington, DC: Government Printing Office. Paige, D. D., Rasinski, T., & Magpuri-Lavell, T. (2012). Is fluent, expressive reading important for high school readers? Journal of Adolescent and Adult Literacy, 56, 67–78. Paulson, E. J. (2005). Viewing eye movements during reading through the lens of chaos theory: How reading is like the weather. Reading Research Quarterly, 40, 338–358.
Downloaded by [210.193.45.163] at 22:26 02 July 2014
COMPLEXITY METRICS FOR SILENT READING FLUENCY
253
Pelli, D. G., & Tillman, K. A. (2007). Parts, wholes, and context in reading: A triple dissociation. PLoS ONE, 2, e680. doi:10.1371/ journal.pone.0000680. Peng, C. K., Havlin, S., Stanley, H. E., & Goldberger, A. L. (1995). Quantification of scaling exponents and crossover phenomena in nonstationary heartbeat time-series. Chaos, 5, 82–87. Perfetti, C. A. (1992). The representation problem in reading acquisition. In P. B. Gough, L. C. Ehri, & R. Treiman (Eds.), Reading acquisition (pp. 145–174). Hillsdale, NJ: Erlbaum. Pikulski, J. J., & Chard, D. J. (2005). Fluency: Bridge between decoding and reading comprehension. The Reading Teacher, 58, 510–519. Pinnell, G. S., Pikulski, J. J., Wixson, K. K., Campbell, J. R., Gough, P. B., & Beatty, A. S. (1995). Listening to children read aloud. Washington, DC: U.S. Department of Education, National Center for Education Statistics. Plaut, D. C. (1997). Structure and function in the lexical system: Insights from distributed models of word reading and lexical decision. Language and Cognitive Processes, 12, 765–805. Rasinski, T. V. (2004). What research says about reading: Creating fluent readers. Educational Leadership, 61(6), 46–51. Rasinski, T. V. (2008). A brief history of reading fluency. In S. Samuels & A. Farstrup (Eds.), What research has to say about fluency instruction (pp. 4–23). Newark, DE: International Reading Association. Rasinski, T. V. (2012). Why reading fluency should be hot. The Reading Teacher, 65, 516–522. Rasinski, T., Samuels, S. J., Hiebert, E., Petscher, Y., & Feller, K. (2011). The relationship between a silent reading fluency instructional protocol on students’ reading comprehension and achievement in an urban school setting. Reading Psychology, 32, 75–97. Riley, M. A., & Turvey, M. T. (2002). Variability and determinism in motor behavior. Journal of Motor Behavior, 34, 99–125. Riley, M. A., & Van Orden, G. (2005). Tutorials in contemporary nonlinear methods for the behavioral sciences. Arlington, VA: National Science Foundation. Retrieved from http://www.nsf.gov/sbe/bcs/pac/nmbs/nmbs.jsp Samuels, S. J. (2006). Toward a model of reading fluency. In S. Samuels & A. Farstrup (Eds.), What research has to say about fluency instruction (pp. 24–46). Newark, DE: International Reading Association. Schroeder, S. (2011). What readers have and do: Effects of students’ verbal ability and reading time components on comprehension with and without text availability. Journal of Educational Psychology, 103, 877–896. Schwanenflugel, P. J., Hamilton, A. M., Wisenbaker, J. M., Kuhn, M. R., & Stahl, S. A. (2004). Becoming a fluent reader: Reading skill and prosodic features in the oral reading of young readers. Journal of Educational Psychology, 96, 119–129. Shockley, K., Richardson, D. C. & Dale, R. (2009). Conversation and coordinative structures. Topics in Cognitive Science, 1, 305–319. Shockley, K. (2005). Cross recurrence quantification of interpersonal postural activity. In M. A. Riley & G. C. Van Orden (Eds.), Tutorials in contemporary nonlinear methods for the behavioral sciences (pp. 26–96). Arlington, VA: National Science Foundation. Retrieved from http://www.nsf.gov/sbe/bcs/pac/nmbs/nmbs.jsp Silberglitt, B., Burns, M. K., Madyun, N. H., & Lail, K. E. (2006). Relationship of reading fluency assessment data with state accountability test scores: A longitudinal comparison of grade levels. Psychology in the Schools, 43, 527–535. Therrien, W. J. (2004). Fluency and comprehension gains as a result of repeated reading: A meta-analysis. Remedial and Special Education, 25(4), 252–261. Torgesen, J. K., Rashotte, C. A., & Alexander, A. W. (2001). Principles of fluency instruction in reading: Relationships with established empirical outcomes. In M. Wolf (Ed.), Dyslexia, fluency and the brain (pp. 333–355). Timonium, MD: York Press. Turvey, M. T. (1990). Coordination. American Psychologist, 45, 938–953. van der Schoot, M., Reijntjes, A. & van Lieshout, E. C. D. M. (2012). How do children deal with inconsistencies in text? An eye fixation and self-paced reading study in good and poor reading comprehenders. Reading & Writing, 25, 1665–1690. Van Orden, G. (2010). Voluntary performance. Medicina, 46, 681–594. Van Orden, G., Holden, J. G., & Turvey, M. T. (2003). Self-organization of cognitive performance. Journal of Experimental Psychology: General, 132, 331–350. Van Orden, G., Kloos, H., & Wallot, S. (2011). Living in the pink: Intentionality, wellbeing, and complexity. In C. A. Hooker (Ed.), Philosophy of complex systems. Handbook of the Philosophy of Science (Vol. 10, pp. 639–684). Amsterdam, the Netherlands: Elsevier. Van Orden, G. C., Pennington, B. F., & Stone, G. O. (1990). Word identification in reading and the promise of subsymbolic psycholinguistics. Psychological Review, 97, 488–522.
Downloaded by [210.193.45.163] at 22:26 02 July 2014
254
O’BRIEN ET AL.
Wallot, S. (2011). The role of reading fluency, text difficulty and prior knowledge in complex reading tasks. University of Cincinnati. ProQuest Dissertations and Theses, 130. Retrieved from http://search.proquest.com/ docview/919689845?accountid=28158. (919689845). Wallot, S., Fusaroli, R., Tylén, K., & Jegindø, E.-M. (2013). Using complexity metrics with RR intervals and BPM heart rate measures. Frontiers in Physiology. doi:10.3389/fphys.2013.00211 Wallot, S., Hollis, G., & van Rooij, M. (2013). Connected text reading and differences in text reading fluency in adult readers. PLOS One, 8, e71914. Wallot, S., O’Brien, B. A., & Van Orden, G. (2012). Fractal and recurrence analysis of psycholinguistic data. In C. Westbury, G. Jarema, & G. Libben (Eds.), Methodological and analytic frontiers in lexical research (pp. 395–430). Amsterdam, the Netherlands: John Benjamins. Wallot, S., & Van Orden, G. (2011). Nonlinear analyses of self-paced reading. The Mental Lexicon, 6, 245–274. Webber, C. L., Jr., & Zbilut, J. P. (2005). Recurrence quantification analysis of nonlinear dynamical systems. In M. A. Riley & G. C. Van Orden (Eds.), Tutorials in contemporary nonlinear methods for the behavioral sciences (pp. 26–96). Arlington, VA: National Science Foundation. Retrieved from http://www.nsf.gov/sbe/bcs/pac/nmbs/nmbs.jep Whithear, J. (2011). A review of fluency research and practices for struggling readers in secondary school. Literacy Learning: The Middle Years, 19, 18–28. Wijnants, M. L., Bosman, A. M. T., Hasselman, F., Cox, R. F. A., & Van Orden, G. (2009). 1/f scaling in movement time changes with practice in precision aiming. Nonlinear Dynamics, Psychology, and Life Sciences, 13, 79–98. Wijnants, M. L., Hasselman, F., Cox, R. F. A., Bosman, A. M. T., & Van Orden, G. (2012). An interaction-dominant perspective on reading fluency and dyslexia. Annals of Dyslexia, 62, 100–119. Wolf, M. (2007). Proust and the squid: The story and science of the reading brain. New York, NY: Harper Collins.