Integrating System Dynamics and Enterprise Modeling to Address Dynamic and Structural Complexities of Choice Situations Arash Golnam1, Ann Van Ackere2, Alain Wegmann1
1
Ecole Polytechnique Fédérale de Lausanne School of Computer and Communication Sciences (I&C) Systemic Modeling Laboratory (LAMS) Station 14, CH-1015 Lausanne, Switzerland Tel: {+41 21 693 67 94, +41 21 693 4381} Email {arash.golnam, alain.wegmann}@epfl.ch 2
Université de Lausanne Faculté des Hautes Etudes Commerciales (HEC) Department of Operations (DO) Quartier UNIL-Dorigny, Bâtiment Internef, 1015 Lausanne Tel: +41 21 692 34 54
[email protected]
Abstract The ability of enterprise managers to come up with the decisions leading to the best outcome for the enterprise is hampered by their cognitive limits in understanding and addressing the dynamic and structural complexities residing in choice situations. Dynamic complexities deal with the behavior of the enterprise and its environment over time. Structural complexities, on the other hand, arise from the number of the departments within the enterprise, their interactions and the interactions between the enterprise and the entities across its boundary. The policy aiding methods developed to assist managers in the analysis of choice scenarios address these two types of complexities in separation. In this paper adopting a holistic approach, we integrate System Dynamics (SD) - a method for understanding the behavior of systems over time - and Systemic Enterprise Architecture Methodology (SEAM) - a modeling method that provides insights into how an enterprise and its interactions with other entities are structured. Integrating SD and SEAM, we present an approach to modeling, analysis and simulation of choice scenarios aiming at reducing the dynamic and structural complexities involved in the decision making process. We illustrate the applicability of our approach by applying it to an example of a choice situation in a manufacturing company. Keywords: Dynamic and structural complexity, System dynamics, Enterprise modeling 1
1. Introduction In many cases, managers in enterprises are faced with choice situations where a decision should be made under high levels of uncertainty. In such cases, managers’ ability to come up with the decisions leading to the best outcome for the enterprise is hampered by their cognitive limits in understanding and addressing the structural and dynamic complexities of the enterprise. To understand the dynamics and structural complexities we should adopt a systemic view of the enterprise. An enterprise as a system is composed of sub-systems and is embedded in a hierarchy of larger systems such as segments, markets, industry and etc. Structural complexities arise from the number of the subsystems of an enterprise as well as, the interactions within the internal systems and between the internal and external systems across the boundary of an enterprise. The dynamic complexity, on the other hand, deals with the behavior of the enterprise over time. In some cases a change in the state of an enterprise system element leads to a chain of reactions by other system elements and may take years to fully play out its effect due to the existence of causal ambiguities and delays (Sterman 2000) . There is a significant need for approaches that help managers gain a better understanding of and address such inherent complexities the and thereby come up with decisions that can help the enterprise achieve its strategic objectives. In this paper we propose an approach to address the challenges arising from decision making in uncertainty. Our approach consists of a process that integrates an enterprise modeling technique and system dynamics methodology (Forrester and Wright 1961). Figure 1 illustrates an overall view of our proposed approach. The process consists of six steps. In the first step, we conceptualize the as-is architecture and develop the enterprise models. Then, the stock and flow diagram is built. We show how an enterprise model of the as-is architecture can help us in building and understanding the stock and flow diagram. Next, we develop scenarios that can capture the topic of interest pertinent to the choice situation. Scenarios are then simulated using system dynamics simulation of the stock and flow diagram. In the second next step, we check whether the simulation of the scenarios has led us to the identification of the problem residing in the as-is architecture. If a problem is identified we proceed to the third step, otherwise we are facing one of the following situations: 1) the current model (i.e. as-is architecture, the stock and flow and the scenarios) does not capture the existing problem. In this case the model needs to be re-conceptualized we call this a re-scoping. Perhaps we need to go to a higher or lower level of abstraction. 2) no problem exists and the model reflects the right abstraction of reality. In this case, the process is terminated. The third step comprises of two activities; 1) solution scanning that involves generating all the alternatives that can serve as a solution to the identified existing problem, and 2) selection of a solution that has the potential to address the identified problem. Similar to step 2, if a solution can not be found we probably need to re-scope the model. 2
Start
1.1 As-is Architecture Conceptualization 1.2 Stock and Flow Development 1.3 Scenario Development 1.4 Simulation
No
2. Any problem to address
No (model does not represent
Rescope
problem)
Yes 3.1 Alternatives of Potential Solution Generation 3.2 Potential Solution Selection Yes 4. Potential Solution Identified?
No
Yes
5.1 To-be Architecture Design 5.2 Stock and Flow Modification 5.3 Simulation
6. Potential Solution Validated ?
No
Yes
End
Figure 1: The six-step process In the fifth step, we design a to-be architecture based on the potential solution identified, modify the stock and flow diagram and re-run the simulation. Finally, we check whether or not the to-be architecture is validated (i.e. the problems in the as-is architecture are tackled). If so, the process is terminated, otherwise we need to re-scope the model.
3
The rest of the paper is structured as follows. In Section 2, we present a comparative analysis of enterprise modeling and system dynamics drawing implications on how the two methods can complement one another. In order to illustrate the applicability of our proposed approach, in Section 3, we apply it to an example of a choice situation in a manufacturing company. In this example the manufacturing company needs to make a tradeoff between price and delivery lead time in responding to a request for quotation (RFQ). Finally, in Section 4 we present our future work and the conclusion. 2. System Dynamics and Enterprise Modeling, the Perfect Integration? In this section we compare system dynamics and enterprise modeling to draw inferences on how the two approaches can complement one another. We also point out a number of implications on the integration of the two methods. Next, we briefly introduce Systemic Enterprise Architecture Methodology (SEAM). SEAM is the enterprise modeling method applied in our proposed approach in this paper. 2.1 System Dynamics versus Enterprise Modeling System Dynamics (SD) is a methodology for understanding the behavior of complex systems over time. It provides fundamental contributions to framing, understanding, and discussing complex issues and problems. System dynamics originally developed by Jay Forrester’s work at MIT in the 1950s, is centered around modeling and simulating complex systems through systemic representation of the system in terms of stocks, flows, and feedback loops. SD methods provide “essential insight into situations of dynamic complexity,” especially when experimenting the real systems is impossible or not feasible (Sterman 2000). SD provide significant insights into the behavior of the system over time but does not provide any implication on how the system elements should be reconfigured to yield a desired behavior. SD, in other words, captures the “what” of the dynamic behavior and does not address “how” the behavior of the system can be modified. System dynamics
Enterprise modeling
Allows interpretation and prediction of the Provides a static image of the system elements behavior of a system over time (i.e. and the details of their interactions at a point of prescriptive in nature). time. (i.e. descriptive in nature). Focuses on modeling an issue or a problem. Focuses on building models of the enterprise “the system dynamics process starts from a for the purpose of documenting, communicating and sharing an understanding problem to be solved” (Forrester and Wright of an enterprise (Vernadat 1996). 1961). Provides a limited set of graphical notations Provides a set of constructs and graphical 4
(i.e. stocks, flows and information objects)
notations to capture systems, information and material flows, processes, and etc.
A model of reality can be built in different Reference models and model building blocks ways by different modelers. as well as the graphical notations lead to a shared understanding of the enterprise model developed. Suitable for scenario and policy analysis.
Suitable for system design, process reengineering and enterprise integration.
Aims at developing models to assist the understanding of a behavior of system at an aggregate level and thereby helps reduce and address the dynamic complexity.
Aims at developing models to assist the understanding of the system elements and their interactions at different levels of abstraction and thereby helps reduce and address the structural complexity
Table 1: Comparison of system dynamics and enterprise modeling Enterprise modeling, on the other hand, aims at providing enterprise models that lead to a better understanding of how an enterprise functions. Enterprise modeling techniques provide a static image of a state of the system. Enterprise models capture a detailed representation of system in terms of the system elements and their interactions to provide a means of understanding or communicating of the enterprise. The modeler can decompose the enterprise to a consistent set of modules and hence gain a better understanding of and manage the system complexity. (Vernadat 2002) In Table 1, we compare system dynamics and enterprise modeling. 2.2 Implications on the Integration System dynamics and enterprise modeling complement and supplement one another from a variety of perspectives. A major problem of the managers in enterprises concerns their bounded cognitive ability to assess the impact of their various decisions over time due to the existence of the dynamic complexities. Scenario analysis and development methods are therefore needed to evaluate different scenarios arising from the choices available to the managers. System dynamics provides a rigorous basis for modeling the problems in which reside the choice situations as well as developing and comparing various choice scenarios to one another. However, an enterprise may have to reconfigure itself or eliminate the redundant activities in order to be able to achieve the outcomes associated with a desired scenario. By modeling various aspects of an enterprise such as information flows, functions, processes and etc. at different abstraction levels, enterprise modeling provides a blue print for an enterprise to migrate from an as-is to a to-be situation yielding the desired outcomes. 5
Moreover, an enterprise model can serve as a good starting point for building a stock and flow diagram. Enterprise models provide a rigorous and consistent abstraction of reality based on which a stock and flow diagram can be developed. An enterprise model accompanying a SD stock and flow diagram can help communicate the context and the focus of the problem and make the model more understandable. 2.3 Systemic Enterprise Architecture Methodology (SEAM) In this paper we apply Systemic Enterprise Architecture Methodology (SEAM) (Wegmann 2003). The foundations of SEAM are in General Systems Thinking (GST) (Weinberg 2001) and in RM-ODP (ISO Standard 1995). GST is the study of principles that are applicable to any kind of system (e.g. business system or IT system). RM-ODP is a software engineering ISO standard that provides solid definitions for the SEAM concepts (e.g. process, state, property). SEAM is rigorously defined based on these systemic and software engineering concepts. SEAM federates multiple modeling techniques (such as discrete behavior, goals or quantitative models). SEAM has been applied for teaching (Wegmann et al. 2007) and consulting since 2001. SEAM augments the enterprise modeling methods by modeling the environment in which the enterprise is embedded and hence creates the possibility and supports modeling of the business strategies. In SEAM, an enterprise is viewed as a nested hierarchy of systems. At a micro level we model the enterprise, the various departments inside the enterprise and the processes within each department. At a macro level we model and analyze how companies working as a value network can cooperate to achieve commercial objectives. SEAM provides a consistent set of modeling principles and constructs to model an enterprise at different abstraction levels. In SEAM the systems (i.e. value segments, value networks, enterprises and the departments) can be represented as wholes (black boxes) abstracting the components or composites (white boxes) showing the system components. Whole and composite representation helps the modeler simplify the conceptualization of the structural complexities inherent in the business environments. 3. Applying the Proposed Approach to the Example of BE Co. To illustrate the applicability of our proposed approach and provide insights into how enterprise modeling can be integrated with system dynamics we apply the 6-step approach as presented in Section1 to the example of a choice situation in a manufacturing company called BE Co. This example is a fictitious case inspired by a real company. BE Co. (Best Engine Company) is specialized in designing, manufacturing and servicing diesel engines for light aircraft. NewPlane SA which is one of the most promising plane manufacturer companies in the aeronautic business has decided to buy 240 units of aircraft diesel engines over a two year period of time. NewPlane SA has sent a request for quotation (RFQ) to BE Co. and its all time competitor QEng Co. (Quality Engine Company). BE Co. has had a number of 6
experiences taking part in the tenders organized by NewPlane SA and it also has a good knowledge of the market in particular its competitor QEng Co. On this basis, BE Co. holds the following assumptions: NewPlane SA always chooses to source its demand from at least two suppliers. Diesel engines for light aircrafts are also supplied by QEng Co. Hence, the demand for 240 units of engines is going to be split between the two companies. As there is not considerable quality difference between the engines it manufactures and the ones manufactured by QEng Co., NewPlane SA makes its choice on the basis of delivery lead-time and price. QEng Co.’s price can range from 120 to 140 K USD for each unit of engine and the delivery lead-time is between 3 to 5 months. BE Co. has to procure the engine parts from the suppliers. For the sake of simplicity we assume that only two types of parts are required for engine manufacturing; a kit and a mount. It has to figure out the right tradeoff between the lead time and price to get the maximum number of orders at a competitive price and lead time while ensuring profitability. 3.1 Step 1 3.1.1 As-is Architecture Conceptualization In this step we apply SEAM to conceptualize the as-is architecture of BE Co. Before explaining the as-is architecture, we briefly present a number of modeling principles used to develop the conceptualization of the as-is architecture. In SEAM block arrows represent systems. When modeling a business context we represent a company and its value network as systems. A value network is a group of companies that collaborate and pursue a common commercial objective. Systems can be represented as a whole (black box view of a system) or as a composite (white box view of a system). Modeling a system as a whole, the system components and their interactions are abstracted. Instead, the system’s emergent actions and properties that conceptualize the overall behavior of the system are observed. On the other hand, when a system is modeled as a composite, its structure, component systems and their interactions are viewed. Figure 2 is a conceptualization of the as-is architecture of BE Co. value network as composite. Modeling a value network as a composite, we capture the interactions between the companies inside the value network to gain a better understanding of how the companies cooperate to deliver a product or service to the customer. In Figure 2, inside the value network we have modeled BE Co., Mount Supplier X and Kit Supplier Y as wholes, thereby showing their emergent processes and abstracting the details of the processes and the departments inside each company. In SEAM, a process is represented by an ellipse. As shown in Figure 2, BE Co. has the core process of “Engine design, manufacturing and sales” which triggers the “Order setting” process that recurs for kits and mounts. Since, BE Co. is within the scope of our analysis we 7
have modeled the processes of the other entities within BE Co. to the extent that fits our purpose of analysis. Modeling a system as a whole we can also represent its emergent properties. Emergent properties can be material and/or information that are output and/input of processes. Inspired by the work of (Dori 2002), material or information properties are respectively denoted by double line and single line rectangles. In Figure 2, an “Engine Order” is an information property that is inputted to the “Engine design, manufacturing and sales” process within Be Co. This process, in turn, outputs the “Product BOM” as an information property which triggers the “Order Setting” process for mounts and kits. Similarly the orders placed by BE Co. (i.e. information property) serve as the inputs that trigger the “Manufacturing” process within Supplier X and Supplier Y company which output “Kit” and “Mount” as material properties.
LEGEND System
Information Flow
Process
Material Flow
Property
Material Property
[w] [c]
Multi-Party Relationship
System as a whole System as a Composite
Information Property
Figure 2: BE Co. Value Network as a composite (as-is architecture)
8
Other sections of the model can be interpreted the same way. The inflow and outflow of material and information properties are captured by dashed and dotted lines respectively. The dotted line from “Engine order” information property and “Kit” and “Mount” material properties to the “Order setting” processes imply that the “Order setting process” operates on the basis of the information inputs from these entities. Processes also have emergent properties. In the case of the companies within BE Co. VN such emergent properties are the delivery lead time and price. We use a diamond to represent the multi-party relationship (MPR) capturing the overall performance of the companies within the value network. MPRs can also represent the company level performance. As it can be seen in the model, with the current lineup of suppliers, BE Co. can deliver the engine at the price of 140 in a 4 month period. When modeling a value networks we also represent the customer and the competitor companies. In Figure 2, we can see the flow of orders and engines between NewPlanes SA and BE Co. We can also see the overall performance of the QEng. Co. (based on the assumptions presented at the beginning of this section) value network as the competitor company. 3.1.2 Stock and Flow Development At this step we develop the stock and flow diagram. Figure 3 exhibits the stock and flow diagram of BE Co. supply chain. As mentioned earlier, the enterprise model can provide useful insights into developing the SD model. More precisely, the processes in the enterprise models correspond to the rates in the stock. In addition, the information and material properties can be mapped onto the stocks. Further, the flow structure is almost similar in both stock and flow diagram and the enterprise model. As an instance to clarify this similarity, “Kit order rate” in the stock and flow diagram corresponds to the “order setting for kits” process in the enterprise model and the “Kits ordered by BE Co.” stock can be mapped onto the “Kit Order” information property in the enterprise model. The mapping between “Kit manufacturing and delivery” rate in the stock and flow diagram and “Kit manufacturing and sales” process in the enterprise model can be interpreted the same way. As it can be seen in Figure 3, we have structured the stock and flow diagram in such way that the commonalities can be easily identified.
9
Figure 3: BE Co. Value Network as a composite - stock and flow diagram capturing the production aspects
We use the stock and flow diagram in Figure 4 to model the cash inflow and outflow in BE Co. In this model, OpEx is the operating expenses. The operating expenses for the production of each engine is 50 K USD. We have also assumed that the engine manufacturer pays the suppliers when its engines are sold to NewPlanes SA.
10
Kit order rate
Mount order rate
Total Inventory of mounts
Time to adjust kit inventory
Time to adjust mount inventory
Kits ordered by BE Co.
of kits
Mounts consumption per engine (Product BOM)
Minimum kits inventory coverage BE Co. Value Network Price BE Co. Value Network Leadtime
Maximum kits usage rate
BE Co. Lead Time (3 Months)
Engine manufacturing and delivery rate
Kits consumption per engine (Product BOM)
BE Co. Kits Inventory
Minimum mounts inventory coverage Maximum mounts usage rate
Engines ordered by NewPlane SA
Production starts
BE Co. Mounts Inventory
BE Co. kit consumtion rate
Kit manufacturing and delivery rate
Supplier Y Leadtime (2 Months)
Inventory coverage for kits Total inventory
Desired inventory of kits
BE Co. mount consumtion rate
Production starts rate
Desired inventory of mounts
Inventory coverage for mounts
Mount manufacturing and delivery rate
Supplier X Leadtime (1 Month)
Mounts Ordered by BE Co.
Engines Inventory
QEng. Co. Price
Engine order rate
Order split ratio
QEng. Co. Leadtime
Price per mount (5 K$)
Cost of mounts
Cash
Cash out flow rate
Cost of kits
Cash inflow rate
Income from engines
Total OpEx OpEx per Engine Price per kit (60 K$)
Figure 4: BE Co Value Network as a composite - stock and flow diagram capturing the financial aspects 3.1.3 Scenario Development As mentioned earlier, BE Co. knows that the orders it can win from NewPlanes SA is a function of its lead time and price relative to the lead time and the price of QEng Co. Hence, to develop the scenarios inspired by the work of (Kim 1998), a nonlinear demand split function that can estimate order quantities for BE Co. and QEng Co. is used. By being nonlinear, the impact of the price and lead time factors of a company on the orders won becomes disproportionate. Thereby, a slightly better lead time or price can lead to a considerable increase proportion of the demand. The non-linear function we applied in our model is a power function. We have formulated the order split ratio for BE Co. as follows: BE Co. ’s Order Ratio
BE Co. Lead
QEng. Co. Leadtime QEng. Co. Price QEng. Co. Leadtime QEng. Co. Price time BE Co. Price
As mentioned earlier QEng Co.’s price ranges between 120- 140 K USD with the delivery lead time of 3 to 5 months for each unit of engine. On this basis we have developed two scenarios for BE Co. with the as-is price of 140 K USD and the delivery lead time of 5 months. Table 2 summarizes these scenarios.
11
QEng Co. Lead time Price Scenario (Months) USD) Best case scenario 5 120 Worst case scenario 3 140 Table 2: The two scenarios
(K
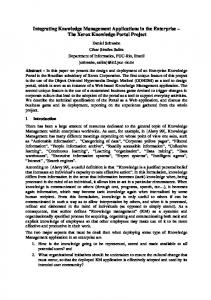
In Table 2, best case scenario means that if QEng Co.’s lead-time and price is 5 months and 120K USD respectively, the best case has occurred for BE Co. In that case, BE Co. can get a higher demand split ratio. It should be noted that since there is a tradeoff between price and leadtime it is not possible to decrease the lead time and price simultaneously. 3.1.4 Simulation We have simulated the cash level at BE Co. over a 2 years (24 month) period of time for the two scenarios. The results of the simulation are illustrated in Figure 5.
BE Co. Cash As-Is Situation 2,000
Actual Cash Level BCS: 1800 K$ Actual Cash Level WCS: 1200 K$
K$
1,500 1,000 500 0 0
2
4
6
8
10 12 14 Time (Month)
16
18
20
22
24
Cash : Best case scenario Cash : Worst case scenario
Expected cash level (3000 K$) is not reached → problem Figure 5: BE Co.’s cash level over a two year period of time for the as-is situation 3.2 Step 2 Any Problem to Address ? With the as-is architecture, and in the best case scenario (BCS) BE Co. can only get around 80 orders ( around 42 % of the total orders ) and reach 1,800 K USD level of cash which is far below expected cash level of 3000 K$. The expected cash level if calculated considering the rest of the expenditures BE Co. has such as CapEx (Capital Expenditures) and etc. Hence, it is apparent that a problem has been identified.
12
3.3 Step 3 3.3.1 Alternatives of Potential Solution Generation In Step 2 BE Co. realized that with its current lead time and price it can not win enough engine orders to reach its expected cash level. Hence, it has to reduce its lead time or price in order to be able to capture a larger proportion of NewPlanes SA orders and thereby raise its level of cash. For BE Co. it is evident that reducing the price is out of question as the price it is planning to quite is very competitive. Hence, based on the model so, BE Co. can pursue two different strategies that can serve as solution alternatives. Solution Alternatives 1 2
Reduce the supply lead-time for kits (currently 2 months) – no need to change part leadtime as not in critical path Reduce its manufacturing cycle time (currently 3 months) Table 3: Solution alternatives for BE Co.
Since BE Co. has been engaged in a long time partnership with its suppliers and has in fact invested in training programs in its supplier companies to enhance the quality of the parts supplied, changing suppliers will not be feasible at all. Hence, it has to reengineer its internal process to improve its as-is situation. 3.4 Re-scope As the current model scope the (i.e. the as-is architecture, the stock and flow and the scenarios) does not capture the details of the internal processes at BE Co., we need to re-scope the model in order to be able to select a solution based on which the to-be architecture can be designed. Hence we move back to Step 1. To gain an insight into the internal processes within BE Co. and to find out whether or not any improvement can be made we conceptualize BE Co. as a composite. Fig. 6 presents a SEAM model of BE Co. as a composite. The composite view of BE Co. provides useful insights into the component processes of “Engine design, manufacturing and sales” process which is the emergent process in the BE. Co as whole. As we can see the core emergent process of “Engine design, manufacturing and sales” is now decomposed to six sub-processes (i.e. Order Processing, Engineering, Procurement, Manufacturing, Testing and Accreditation and Shipment) carried out in four departments (Sales and Shipment, Engineering and Manufacturing, Procurement and Inventories, Homologation and Type Approval). As this change in the as-is architecture does not precipitate any change in the structure of the stock and flow diagram, the previous stock and flow diagram can remain intact and no 13
modification is required. In Step 2, we have the identified problem of long lead-time and high price. In step 3, we generate the solution alternatives based on the re-scoped model.
BE Co. [c]
Procurement and Inventories [w] Kit
Sales and Shipment [w] Order Processing
Procurement
1/8 Month
Order
1/4 Month Mount
Tech. Spec. Eng. Parts
Engines
Shipment 1/8 Month Company Performance
Engineering and Manufacturing [w]
3 Months
75 K$
Homologation and TA [w]
Manufacturing 4/5 Month
Engineering BOM
Engines
Engines
1/5 Month
Testing and Accreditation 3/2 Months
Figure 6: BE Co. as a composite (to-be architecture)
Table 4 summarizes the solution alternatives (2.1 to 2.4) that have the potential of addressing the problem no. 2 identified in step 2. 2.1 2.2 2.3 2.4
Solution Alternatives Reducing the 1 Month manufacturing lead time Reducing the 1/4 month Sales and Shipment lead time Reducing the 1/4 month Procurement lead time Reducing the 3/2 months Testing and Homologation lead time Table 4: Solution alternatives for BE Co. – Model re-scoped
After scanning all possible solutions to the problem, we now evaluate the solution alternatives in order to come up with the solution that can meet an initial feasibility criteria. Solution 2.1: Reducing the 1 Month Engineering and Manufacturing lead time: BE Co. has recently invested in manufacturing equipment such as automated guided vehicles (AGV) that led to a major reduction in its manufacturing cycle time. An effort to further decrease the manufacturing cycle time required an additional capital expenditure of 1,300 K USD to 14
increase the automation level of the production line by employing a flexible manufacturing system (FMS). This will also require training courses for the engineering and manufacturing personnel. Altogether, BE Co.’s management is not willing to move towards this solution due to the high level of investment and the time required to move up the learning curve. Solution 2.2: Reducing the 1/4 month Sales and Shipment lead time: Order processing involves a careful elicitation of the customer requirements and sending the technical specification requirements to the engineering department. The shipment process, on the other hand, involves the packaging and preparation of the required paper work for the product to be shipped to the customer. The one week deadline has been achieved after years of experience in BE Co. and can not be squeezed any further. Solution 2.3: Reducing the 1/4 month Procurement lead time: The procurement process which is composed of sending RFQs to the suppliers, receiving feedbacks and placing orders takes almost a week in BE Co. It normally takes the suppliers a couple of working days to respond to the RFQs sent by BE Co. their quotations should then be analyzed by BE Co. and orders are then placed accordingly. Since a part of this one week lead time is geared to the response time by the suppliers it is not possible for BE Co. to decrease it. Solution2.4: Reducing the 3/2 months Testing and Homologation lead time Regulation plays an important role in the aeronautics business. Aircraft engine manufactures need to conduct a wide variety of tests on their engines to ensure that their engines conform to the safety standards and emission level requirements. The test results need to be accredited by a third party so that the engines can be homologated and type approved. Currently BE Co. carries out all the tests and sends the test results to an accreditor. BE Co. can reduce the testing time by one month if it outsources the testing as well as the homologation activities to a third party tester and accreditor. 3.5 Step 4 Potential Solution Identified? As outsourcing the testing and homologation was selected as a potential we move on to the next step. 3.6 Step 5 3.6.1 To-be Architecture Design As outsourcing the testing and accreditation was selected by BE Co. as a solution that can contribute to shortening the lead-time, the to-be architecture is designed accordingly. Figure 7 depicts the to-be architecture of BE Co.’s value network. As it can be seen Tester and Accreditor 15
Co. is the new entity that is introduced in this model. BE Co. sends the manufactured engines to Tester and Accreditor Co. and the required homologation documentation is sent back to Be Co. in about two weeks. As it can be seen in the MPR, This re-configuration leads to a month of reduction in lead time and an increase of 15 K$ in the price. 3.6.2 Stock and Flow Modification Be Co.’s price and lead time in the to-be situation will respectively be 155 K USD and 4 Months. We modify the stock and flow accordingly. 3.6.3 Simulation We run the simulation of the stock and flow diagram that captures the to-be architecture to see whether the results lead to any improvement in terms of bridging the gap between the actual and the expected cash level.
Figure 7: BE Co- Value Network (to-be architecture) 3.7 Potential Solution Validated? Figure 8 compares the scenarios in Table 2 for the to-be architecture. As it can be noticed, the tobe scenario yields satisfactory results in terms of the cash level. Comparing the best case 16
scenarios of the as-is and the to-be architectures , BE Co. can almost capture 50% of the orders placed by NewPlanes SA and double its stock of cash.
BE Co. Cash To-Be 4,000
Actual Cash Level BCS: 3800 K$
K$
3,000
Actual Cash WCS: 2500 K$
2,000
Level
1,000 0 0
2
4
6
8
10 12 14 Time (Month)
16
18
20
22
24
Cash : Best case scenario to-be Cash : Worst case scenario to-be
Expected Cash Level (3000 K$) achieved. Figure 8: BE Co.’s cash level over a two year period of time for the to-be architecture
4) Conclusion and Future Work In this paper we presented an approach for dealing with structural and dynamic complexities in choice situations. Our approach consists of six-step process in which we migrate from an as-is to a to-be architecture that incorporates a selected solution to an existing problem in the as-is architecture. Adopting the view of an enterprise as a system composed of subsystems (such as departments) which is in turn nested in a hierarchy of a larger systems such as value networks, a multi-scope analysis should be conducted in order to address the various structural complexities that can arise from the interactions between the entities within the enterprise as well as the interactions of the enterprise with the entities outside its boundary. Hence, identifying the problem in the as-is architecture and designing a to-be architecture that can address the problem an iterative re-scoping of the conceptualization should be done. Systemic Enterprise Architecture Methodology (SEAM) as an enterprise modeling method equips us with the ability of conceptualizing and designing the architectures at different levels of abstractions. SD on the other hand created the possibility of problem identification and solution validation through simulation of scenarios. 17
Our future work focuses on applying our approach to a prospective business case to check its applicability in real business settings. We will also examine how a better mapping between our enterprise modeling approach and SD can be made and how the two techniques can complement one another. Exploring the relationship between the modeling approaches can lead to significant insights into how the two methods can be integrated.
5) References Dori, D. 2002. Object-process methodology: a holistic systems paradigm. Springer Verlag. Forrester, J. W, and J. Wright. 1961. Industrial dynamics. MIT press Cambridge, MA. ISO Standard. 1995. ISO/IEC 10746-1, 2, 3, 4| ITU-T Recommendation X. 901, X. 902, X. 903, X. 904.“. ITU. Google Scholar. Kim, B. 1998. A System Dynamics Approach to Decision Making on Outsourcing from Suppliers with Different Innovation Capabilities. In Conference Proceedings. Sanchez, Ron, and Aimie Heene. 2003. The New Strategic Management: Organization, Competition, and Competence. Wiley, July 21. Sterman, John D. 2000. Business Dynamics: Systems Thinking and Modeling for a Complex World. McGraw Hill Higher Education, December 1. Vernadat, F. 1996. Enterprise Modeling and Integration: Principles and Applications. 1st ed. Springer, January 15. Vernadat, F. B. 2002. Enterprise modeling and integration (EMI): current status and research perspectives. Annual Reviews in Control 26, no. 1: 15–25. Wegmann, A. 2003. Systemic Enterprise Architecture Methodology (SEAM). In Published at the International Conference on Enterprise Information Systems 2003 , 483-490. Wegmann, A., G. Regev, J. D. De la Cruz, L. S. Lê, and I. Rychkova. 2007. Teaching Enterprise and Service-Oriented Architecture in Practice. In Proceedings of the Workshop on Trends in Enterprise Architecture Research (TEAR 2007). Weinberg, G. M. 2001. An introduction to general systems thinking (silver anniversary ed.). Dorset House Publishing Co., Inc. New York, NY, USA.
18