Hindawi Publishing Corporation Mathematical Problems in Engineering Volume 2015, Article ID 462528, 11 pages http://dx.doi.org/10.1155/2015/462528
Research Article Integrating the Symmetry Image and Improved Sparse Representation for Railway Fastener Classification and Defect Recognition Jiajia Liu, Bailin Li, Ying Xiong, Biao He, and Li Li School of Mechanical Engineering, Southwest Jiaotong University, Chengdu, Sichuan 610031, China Correspondence should be addressed to Jiajia Liu;
[email protected] Received 12 March 2015; Revised 11 September 2015; Accepted 18 October 2015 Academic Editor: Marek Lefik Copyright © 2015 Jiajia Liu et al. This is an open access article distributed under the Creative Commons Attribution License, which permits unrestricted use, distribution, and reproduction in any medium, provided the original work is properly cited. The detection of fastener defects is an important task for ensuring the safety of railway traffic. The earlier automatic inspection systems based on computer vision can detect effectively the completely missing fasteners, but they have weaker ability to recognize the partially worn ones. In this paper, we propose a method for detecting both partly worn and completely missing fasteners, the proposed algorithm exploits the first and second symmetry sample of original testing fastener image and integrates them for improved representation-based fastener recognition. This scheme is simple and computationally efficient. The underlying rationales of the scheme are as follows: First, the new virtual symmetrical images really reflect some possible appearance of the fastener; then the integration of two judgments of the symmetrical sample for fastener recognition can somewhat overcome the misclassification problem. Second, the improved sparse representation method discarding the training samples that are “far” from the test sample and uses a small number of samples that are “near” to the test sample to represent the test sample, so as to perform classification and it is able to reduce the side-effect of the error identification problem of the original fastener image. The experimental results show that the proposed method outperforms state-of-the-art fastener recognition methods.
1. Introduction Railroads conduct regular inspection of the track is a very critical task for maintaining safe and efficient operation. Traditionally, this task is executed by trained works to periodically walk along railway lines to search for any damage of railway facilities. However, the manual inspection is slow, costly, and even dangerous. With the extension of highspeed railway network, the inspection faces more challenges than ever before. Recently, the researchers all over the world are interested in developing automatic inspection devices, which are installed on track checking train and are able to detect railway defects very efficiently. An automatic railway inspection system is composed of a series of functions such as gauge measurement [1], track profile measurement [2, 3], track-surface defects detection [4], and fastener defects detection [5, 6]. In this paper, our research aims to develop fastener defects detection algorithm and automatically find defective fasteners based on computer vision technologies.
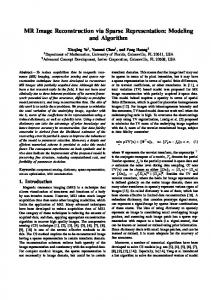
The fasteners are used to hold the track on sleepers, as shown in Figure 1, while the causes of two common quality problems are partly worn and missing fasteners also shown in Figure 1, which would cause the train derailment and even threaten the safety of train operation; therefore, the detection accuracy is the most important target in fastener classification and defect recognition. In the past decade, some researchers have devoted themselves to exploiting fastener inspection methods. For hook-shaped fasteners, Yang et al. [7] took advantage of direction field as the template of fastener. Similarly, Stella et al. [8] employed wavelet transformation and principal component analysis to preprocess railway images and searched for the missing fasteners using the neural classifier. To achieve real-time performance, De Ruvo et al. [9] applied the error back propagation algorithm to model the fasteners and also introduced a FPGA-based architecture for automatic hexagonal bolts detection using the same algorithm [10]. However, the main work of the researches above aims at searching for missing fasteners, and it is difficult
2
Mathematical Problems in Engineering
(a)
(b)
(c)
Figure 1: Fasteners with various existences form on the real railway line. (a) The fastener in left image is intact fastener. (b) The fastener in middle image is partially worn. (c) The fastener in right image is completely missing.
to detect the partly worn fastener. Recently, Mazzeo et al. [5] and Rubinsztejn [11] have successfully applied the Adaboost algorithm to the fastener detection. Specifically, Xia et al. [6] divided the hook-shaped fastener into four parts and each part was independently trained by Adaboost. Similarly, Li et al. [12] used image processing methods to detect the components of fastener. Other technologies that have been used for modeling and detecting fasteners include support vector machine (SVM) [13], Gabor filters [14], and edge detection [15]. The methods mentioned above simply use the part of fastener as an independent object, and they can solve the detection problem of the partly worn fastener to some extent; however, some important factors such as the symmetrical structure of fastener and the relationship between the image feature and classifier are neglected; thus they have weaker ability to identify the partially worn fasteners. In summary, the majority of earlier methods effectively utilize image feature and take advantage of discriminative classifiers to classify the testing fastener samples, in order to achieve the purpose of defect identification. However, up to now, fastener recognition is still confronted with a number of challenges such as varying illumination, image noise, and fastener poses. Affected by these factors, the interclass distance among the different classes of samples, especially the distance between partially worn fastener and intact fastener, is difficult to distinguish; on the other hand, there is no uniform representation of the defective cases, it seems that more training samples are able to reveal more possible variation of samples in illumination or pose and are consequently beneficial for correct classification of target; however, there are only a limited number of instances to train classifiers, and the training sample is not enough. In order to address these challenges and obtain better recognition result, people have made many efforts to synthesize new samples from the original images. For example, in the face recognition, literature [16–18] used simple geometric transformation or virtual views to generate virtual samples, and Sharma et al. [19] synthesized multiple virtual views of a person under different pose and illumination from a single face image; these methods exploited extended training samples to classify the face. Though previous literatures have made many efforts in making virtual or synthesized object images,
the special nature of the detection object is neglected, such as the symmetry of the structure of fastener in fastener recognition. This motivates us to exploit the symmetrical structure of the fastener to generate two new “virtual samples” of every test fastener and devise a representation-based method to perform fastener recognition, and our method is designed for finding both the partially worn and the completely missing instances. This paper has the following main contributions: first, the idea of symmetry is introduced into fastener recognition for the first time, and we use every original testing sample to generate two “symmetrical fastener” samples. Let 𝑡𝑖 , 𝑦𝑖 , and 𝑧𝑖 , respectively, stand for the original fastener image and the first and second “symmetrical fastener” image. Then the left half columns of 𝑦𝑖 are set to the same parts as that of 𝑡𝑖 and the right half columns of 𝑦𝑖 are the mirror image of the left half columns of 𝑦𝑖 ; however, the right half columns of 𝑧𝑖 are set to the same parts as that of 𝑡𝑖 and the left half columns of 𝑧𝑖 are the mirror image of the right half columns of 𝑧𝑖 . Our proposed scheme is to use a simple way to obtain more training and test samples by the symmetrical operation. Second, an improved representation-based classification algorithm was proposed for fastener detection; this method simultaneously uses the first and second “symmetrical fastener” testing samples to perform a two-step classification. This method also takes advantage of decision fusion, which has proven to be very competent and is usually better than the decision level and feature level fusion. Third, it provides a very large number of experiments and the experimental results show that the proposed method is very competitive. The remainder of this paper is organized as follows. In Section 2, we describe the proposed method in detail. Section 3 provides the analysis and the computational complexity of our methods. In Section 4, our methods are verified by extensive experiments using fastener databases. Section 5 offers our conclusions.
2. The Proposed Method In this section, we present the main steps of the proposed method in detail. Prior to commencing the method, there are several premise conditions we need to explain.
Mathematical Problems in Engineering
(a) Original fastener
3
(b) The first symmetrical fastener
(c) The second symmetrical fastener
Figure 2: The four regions of interest in fastener image; (b) and (c), respectively, the first and second symmetrical fasteners generated from the original sample as shown in (a); we can see that the appearance of two new samples has a great change relative to original image; and the main difference lies in the fact that the intact fasteners and defective fasteners are the end region of the fastener.
First, the fastener dataset still consists of three states such as missing fasteners, worn fasteners, and intact fasteners after the symmetry operations (as shown in Figure 1). Therefore, there are three classes and each class has 𝑛 training samples in the new training set based on the state of new “symmetrical sample”; let 𝑥1 , 𝑥2 , . . . , 𝑥𝑁 represent all the 𝑁 training samples and column vector 𝑥(𝑖−1)𝑛+𝑘 (𝑘 = 1, 2, . . . , 𝑛) stands for the 𝑘th training sample of the 𝑖th subject; On the other hand, there are two “virtual symmetry samples” obtained from the original test fastener 𝑡𝑖 and forming two new sets of testing subsets 𝑌 = [𝑦1 , 𝑦2 , . . . , 𝑦𝑀] and 𝑍 = [𝑧1 , 𝑧2 , . . . , 𝑧𝑀] based on the original testing set 𝑇 = [𝑡1 , 𝑡2 , . . . , 𝑡𝑀]. Second, all the samples would be converted into onedimensional column vectors via feature extraction algorithm before the classification algorithm is employed. As shown in Figure 2, the appearance of the first and second symmetry sample has a great change relative to original image; and the main difference lies in the fact that the intact fasteners and defective fasteners are the end region of the fastener (regions in four red rectangles); thus the region within four red rectangles is the region of interest (ROI); therefore, Pyramid Histogram of Oriented Gradients (PHOG) [20] of ROI in image is extracted, and we use 𝑥̃𝑖 , 𝑦̃𝑖 , and 𝑧̃𝑖 to denote the one-dimensional column vectors of the fasteners 𝑥𝑖 , 𝑦𝑖 , and 𝑧𝑖 , respectively. 2.1. Main Processes of the Proposed Method. The proposed method includes the following two modules. The first module generates “symmetrical fastener” of original samples in the testing datasets. The second module uses the two types of “symmetrical image” in test sets to perform two-step fastener recognition, respectively. The algorithm of two-step fastener recognition will be described in Section 2.2. The proposed algorithm in detail is as follows. Step 1. Use every original testing sample to generate two “symmetrical fastener” samples. Let 𝑡𝑖 be the 𝑖th testing sample in the form of image matrix. Let 𝑦𝑖 and 𝑧𝑖 , respectively, stand for the first and second “symmetrical fastener” testing samples generated from 𝑡𝑖 . The left half columns of 𝑦𝑖 are set to the same parts as that of 𝑡𝑖 and the right half columns of 𝑦𝑖 are the mirror image of the left half columns of 𝑦𝑖 . However, the right half columns of 𝑧𝑖 are set to the same parts as that of
𝑡𝑖 and the left half columns of 𝑧𝑖 are the mirror image of the right half columns of 𝑧𝑖 . The mirror image 𝑆 of an arbitrary image 𝑅 is defined as 𝑆(𝑖, 𝑗) = 𝑅(𝑖, 𝑉 − 𝑗 + 1), 𝑖 = 1, . . . , 𝑈; 𝑗 = 1, . . . , 𝑉. 𝑈 and 𝑉 are the numbers of rows and columns of 𝑅, respectively. 𝑆(𝑖, 𝑗) denotes the pixel located in the 𝑖th row and 𝑗th column of 𝑆 [21]. Step 2. Use the first “symmetrical fastener” to perform the improved sparse representation algorithm for fastener recognition. The method proposes representing the symmetrical fastener 𝑦𝑖 as a sparse linear combination of all the samples in train sets and identifies which training sample the test sample 𝑦𝑖 is most similar to. Let the class label 𝑆𝑖1 of this training sample denote the ultimate class label of the test sample 𝑦𝑖 . For the details of algorithm, please see Section 2.2. Step 3. Use the second “symmetrical fastener” to perform the improved sparse representation algorithm for fastener recognition. Let 𝑆𝑖2 denote the result of test sample 𝑧𝑖 with respect to the 𝑖th class. This step shares the same algorithm as Step 2. Step 4. Integrate the results obtained using Steps 2 and 3 to conduct fusion decision. In other words, the judgment result of the original test sample 𝑡𝑖 is achieved according to the results of the first symmetrical image 𝑦𝑖 and second symmetrical image 𝑧𝑖 . The details of the fusion rule are as shown in Table 1. 2.2. The Improved Sparse Representation Algorithm for Symmetrical Image Recognition. Sparse representation is one core issue of the modern theory of compressed sensing, and it is intended to represent a sample using a minimal number of nonzero coefficient terms. A number of works have shown that sparse representation and classification (SRC) algorithm can obtain a very high accuracy for image classification such as object recognition and image resolution [22–25]. However, the conventional SRC algorithm such as the one proposed in [22] has a relatively high computational cost, the improved sparse representation algorithm for fastener recognition is presented in this subsection, and our algorithm is mathematically tractable and computationally efficient. The first step in our algorithm aims at identifying and discarding the training
4
Mathematical Problems in Engineering
Table 1: The decision rule for the ultimate form of original testing fastener. The form of the first The form of the The ultimate form of symmetrical fastener second symmetrical original testing 𝑦𝑖 fastener 𝑧𝑖 fastener 𝑡𝑖 Intact
Intact Partially worn Missing
Intact Partially worn Partially worn
Partially worn
Intact Partially worn Missing
Partially worn Partially worn Partially worn
Missing
Intact Partially worn Missing
Partially worn Partially worn Missing
samples that are “far” from the test sample and the second step then exploits the remaining training samples 𝑥1 , . . . , 𝑥𝐾 as candidates for the class label of the test sample, and the second step represents the test sample as a linear combination of the “nearest 𝐾 neighbors” and uses the representation result to perform classification. For simplicity of presentation, we describe the algorithm only on the first “symmetrical fastener”; the algorithm on the second “symmetrical fastener” is the same except that the first “symmetrical fastener” images are replaced with the second “symmetrical fastener” images. 2.2.1. Decision of the 𝐾 Nearest Sample to the Test Image. The choice algorithm of 𝐾 nearest feature subspace exploits the representation ability of each training sample to determine the “𝐾 nearest neighbors” for the test sample. This method uses all of the training samples to represent each test sample [21] and exploits the representation result to identify the 𝐾 nearest neighbors of the test sample from the set of the training samples. It first assumes that the following equation is approximately satisfied: 𝑦̃ = 𝑓1 𝑥̃1 + 𝑓2 𝑥̃2 + ⋅ ⋅ ⋅ + 𝑓𝑁𝑥̃𝑁,
(1)
where 𝑦 is the test sample and 𝑓𝑖 is referred to as the coefficient. Let 𝑋 = [𝑥̃1 ⋅ ⋅ ⋅ 𝑥̃𝑖 ⋅ ⋅ ⋅ 𝑥̃𝑁] and 𝐹 = [𝑓1 ⋅ ⋅ ⋅ 𝑓2 ⋅ ⋅ ⋅ 𝑓𝑁]𝑇 . We rewrite (1) into the following equation: 𝑦̃ = 𝑋𝐹.
(2)
The contribution in representing the test sample can be also assessed by the residual of the test sample with respect to the 𝑖th training sample; that is, 𝑑𝑘 = ‖𝑦̃ − 𝑓̃𝑖 𝑥̃𝑖 ‖2 . 𝑑𝑘 can also be somewhat viewed as a measurement of the distance between the test sample and the 𝑖th training sample. We consider that a small 𝑑𝑘 means that the 𝑖th training sample has a great contribution in representing the test sample. We exploit 𝑑𝑘 to identify the 𝐾 training samples that have the 𝐾 greatest contributions; we would like to point out that the effect on representing the test sample of the 𝑘th training sample is somewhat similar to the distance between the test sample and the 𝑘th training sample. 2.2.2. The Precise Recognition for the Symmetrical Image. The second phase we identify the test sample using all the retained 𝐾 training samples, and represents the test sample as a linear combination of all the 𝐾 nearest neighbors and uses the representation result to perform the precise fastener classification. If 𝑑𝑟1 ≤ 𝑑𝑟2 ≤ ⋅ ⋅ ⋅ ≤ 𝑑𝑟𝑁 , then we say that the 𝑟1 th, 𝑟2 th ⋅ ⋅ ⋅ 𝑟𝑘 th training samples are the first 𝐾 candidate samples of the sample. In other words, we can consider that the ultimate class label of the test sample should be one element of 𝐷 = 𝑐𝑟1 , 𝑐𝑟2 , . . . , 𝑐𝑟𝑘 , and 𝑐𝑟1 , 𝑐𝑟2 , . . . , 𝑐𝑟𝑘 are the class labels of the first 𝐾 candidate samples, respectively. As the above steps roughly determine that the test sample is from a small number of classes, we refer to the selection of the first 𝐾 candidate training samples as coarse classification. The algorithm then uses a linear combination of the first 𝐾 candidate training samples to represent the test sample. In other words, if the first 𝐾 candidate training samples are denoted by 𝑥1 , 𝑥2 , . . . , 𝑥𝑘 , respectively, then the algorithm assumes that the following equation is approximately satisfied: 𝑦̃ = 𝑓1 𝑥̃1 + 𝑓2 𝑥̃2 + ⋅ ⋅ ⋅ + 𝑓𝑘 𝑥̃𝑘 ,
(4)
where 𝑓𝑘 is the coefficient. We rewrite (4) as 𝑦̃ = 𝑋 𝐹,
(5)
where 𝐹 = [𝑓1 ⋅ ⋅ ⋅ 𝑓𝑘 ]𝑇 and 𝑋 = [𝑥̃1 , . . . , 𝑥̃𝑘 ]. 𝐹 is calculated using −1
̃ 𝐹 = (𝑋𝑇 𝑋 + 𝛾𝐼) 𝑋𝑇𝑦, 𝑇 𝐹̃ = [𝑓̃1 𝑓̃2 , . . . , 𝑓̃𝑘 ] .
(6)
̃ And 𝐹 = 𝐹 is calculated using 𝐹 = (𝑋𝑇 𝑋 + 𝜇𝐼)−1 𝑋𝑇 𝑦. [𝑓1 , . . . , 𝑓𝑖 , . . . , 𝑓𝑁]𝑇 . 𝜇 is a small positive constant and 𝐼 is the identity matrix. Equation (1) implies that the effect on representing the test sample of the 𝑘th sample can be evaluated using
𝛾 is a small positive constant and 𝐼 also denotes the identity matrix. Suppose that 𝑥̃1 , . . . , 𝑥̃𝑘 stand for all the training samples and the coefficients are 𝑓1 , . . . , 𝑓𝑘 , respectively. The ultimate effect on representing the test sample of the 𝑘th training sample can be evaluated using
2 𝑁 ̃ 𝑑𝑘 = 𝑦̃ − ∑𝑓𝑖 𝑥̃𝑖 . 𝑖=1
2 𝐾 ̃ dev𝑠 = 𝑦̃ − ∑𝑓𝑖 𝑥̃𝑖 . 𝑖=1
(3)
Equation (1) shows that every training sample makes its own contribution to representing of the test sample 𝑦 and the contribution that the 𝑖th training sample makes is 𝑓𝑖 𝑥𝑖 .
(7)
If 𝑟 = arg min dev𝑠 , then test sample 𝑦̃ is ultimately assigned to the 𝑟th class, which is also referred to as the result of precise classification.
Mathematical Problems in Engineering
5
3. Rationale Analysis of the Proposed Method In this section we show the intuitive rationales and the justification of the proposed method. First, though the “symmetrical fastener” image is simply generated from the original fastener image, it also appears to be a natural image and properly reflects some possible appearance of the fastener image. Figure 3 shows some original samples from the fastener database and the “symmetrical fastener” samples generated from the original samples. We can see that the “symmetrical fastener” samples not only seem to be different from the original samples, but also indeed somewhat reflect the possible variation of the fastener in image pose and illumination, which are not shown by the original samples. On the other hand, symmetrical operation enriches the diversity of fastener samples, and that is very useful to overcome the trouble of nonsufficient training samples. Since the “symmetrical fastener” training samples are complementary for the original training samples, the fastener detection captures only a few original training samples and still obtains enough information of the fastener. Second, the symmetrical image is also sufficiently different from the original fastener image in terms of the distance metric; it can somewhat overcome the error identification problem of the fastener in fastener recognition. Identify the probable causes of impacts: the recognition effect on representing the test sample is somewhat similar to the distance between the test sample and the train sample of 𝑘th class; in other words, a test sample is most likely from the classes which are close to it. The Latent Dirichlet Allocation reported in literature [26] achieved a very good test results in fastener classification and recognition; it outperforms the other methods mentioned above and can detect both partially worn and completely missing fasteners, and many other methods listed in the bibliography cannot detect the partially worn fasteners well. However, we found that it also has limited capacity in the detection of partially worn fasteners. For example, Figures 4(a), 4(b), and 4(c) respectively show the original testing sample, its first and second symmetrical sample, among them the original testing sample is erroneously and correctly classified by Latent Dirichlet Allocation and our method, respectively. Therefore, we calculate the mean Chi-square distance of Figures 4(a), 4(b), and 4(c) to the three classes such as missing fasteners, worn fasteners, and intact fasteners in training set and use the these distances as the indicator to determine which class they belong to. For two 𝐿-dimensional normalized histograms 𝑀 and 𝑁, the Chi-square distance [27] could be described by the following equation: 2
1 𝐿 (𝑛 − 𝑚𝑖 ) , 𝜒2 (𝑁, 𝑀) = ∑ 𝑖 2 𝑖=1 𝑛𝑖 + 𝑚𝑖
(8)
where 𝑛𝑖 , 𝑚𝑖 denote the 𝑖th element value of feature histograms 𝑁 and 𝑀. The test results in Table 2 show that the original testing sample and its first symmetrical sample have a smaller distance from the intact fasteners, and the second symmetrical sample has a smaller distance from the partly worn fasteners; Figures 4(d), 4(e), and 4(f), respectively, show the original training samples in training sets which
are the nearest to them. As the experimental analysis above, the Latent Dirichlet Allocation method exploits only the original training samples and our method uses both the first and second “symmetrical fastener” testing samples; as a consequence, the fastener recognition method using only the original fastener images will be very hard to obtain accurate identification result; however, it is very easy to determine which classes the first and second symmetrical fastener belong to and then combine the recognition results of the first and second fastener to conduct the final discrimination result of original testing sample; the judgment rules are as shown in Table 1. The fastener sample in Figure 4 is not a special case. we randomly select 60 samples in testing sets that the right branch of fasteners is partially broken and their first and second symmetrical sample are also obtained by image symmetry operation and then measure the PHOG feature distance between every 60 images of each class and intact fastener images in training sets; finally, we can achieve the mean distance of each class to intact training fasteners. As the test result shown in Figure 5, the original distance, the first symmetrical distance, and the second symmetrical distance are 3.59, 2.78, and 4.37, respectively; further, the original distance is much bigger than the first symmetrical distance and also much smaller than the second symmetrical distance; the two classes symmetrical images are two polarized developments relative to the original distance between original testing fasteners and intact training fasteners. Meanwhile, to better illustrate the advantages of the method of fastener image symmetry operation, we display the classification results of the three classes of fasteners by the improved sparse representation algorithm; as the test result shown in Figure 6, the recall rate of 60 original testing images is 78.4%, and the recall rate of the first and second symmetrical images is 96.7% and 100%, respectively. Then we can indirectly obtain that the final accuracy of original testing image is 96.7% according to the judgment results of the first and second symmetrical images. Thus, the correct recognition rate is higher than its previous value 78.4%. We can obtain that the following conclusion is that the change of the symmetrical distance (relative to original distance) is helpful for determining which class the first and second symmetrical fastener belong to, and the simultaneous use of the symmetrical sample of the original testing fastener is helpful for a “distance” based classifier to accurately classify the test sample and is able to reduce the side-effect of the error identification problem of the original fastener image. The third rationale of the proposed method is that the algorithm uses the two-step fastener recognition, which is able to enhance the robustness of fastener recognition. The conventional SRC methods usually use the entire set of training samples to produce a representation for the test sample. They compute the distance between the representation of the test sample and that of the training sample and then use the distance as a measurement to indicate how well each class can represent this sample or the probability that the test sample comes from that class. That is to say, the shorter the distance a class has, the greater the probability the test sample comes from this class. Relative to the conventional SRC methods, the algorithm in this paper specifically takes the relationship
6
Mathematical Problems in Engineering
(a)
(b)
(c)
Figure 3: Some original samples from the database and the corresponding “symmetrical fastener” samples. (a) Showing the original samples; (b) and (c), respectively, showing the first and second “symmetrical fastener” samples generated from the original sample.
Table 2: The original and symmetrical distances of the samples shown in Figure 4. Number of the subjects Original distance (×105 ) The first symmetrical distance (×105 ) The second symmetrical distance (×105 )
Missing fastener 4.72 4.93 2.89
Worn fastener 3.47 3.55 3.37
Intact fastener 3.24 2.76 4.58
(a)
(b)
(c)
(d)
(e)
(f)
Figure 4: A test sample that is erroneously and correctly classified by the Latent Dirichlet Allocation and our method, respectively. (a) The test sample. (b) The first symmetrical sample of the test sample. (c) The second symmetrical sample of test sample. (d) The training sample which is the nearest to the test sample. (e) The training sample which is the nearest to the first symmetrical sample. (f) The training sample which is the nearest to the second symmetrical sample.
Mathematical Problems in Engineering 𝜒2 distance
6 4 2 0
𝜒2 distance
𝜒2 distance
70
6 4 2 0
6 4 2 0
7
60 0
10
20 30 40 The original distance
50
60
50 40 30 20
0
10
20 30 40 The first symmetrical distance
50
60
10 0 Original testing image
0
10
20 30 40 50 The second symmetrical distance
60
Figure 5: Demonstration of the idea of the construction of symmetrical sample. The dotted lines indicate the mean distance between the three classes of fastener images and intact training fasteners. The original distance, the first symmetrical distance, and the second symmetrical distance, respectively, express the feature distance between original test fastener, the first symmetrical fastener, the second symmetrical fastener, and intact fastener.
between the test sample and its neighbors into account and only uses a linear combination of the 𝐾 nearest neighbors to represent and classify the test fastener. It has the following underlying rationale: the related literature has shown that the test sample is usually not from the classes which have bigger distance from it [28]; therefore, the fine recognition can increase the probability of the test sample being correctly classified by eliminating the training samples from these classes. In the first phase of our algorithm, we compute the distances and exploit the discriminative information from 𝐾 nearest principle to retrieve the first 𝐾 nearest subspaces for the test sample and assume that the residual training samples have no effects on the ultimate classification decision. Such a practice does not only eliminate the interference of the residual training samples, but also reduce the scale of the problem. It will be very helpful for the second phase to perform an accurate classification. The second phase of our algorithm performs SRC based on the training samples from the selected 𝑘 subspaces. Moreover, when determining the 𝐾 nearest subspaces, the first phase uses only the linear regression in which the hat matrix for each class can be calculated offline. Thus, it has a very low time cost, and the whole method is also computationally much more efficient than the original SRC. Moreover, this method has similarities with Local Projection methods in that they only use a subset of the training samples. For example, Sugiyama integrated the ideas of the LDA (Linear Discriminant Analysis) and locality preserving projection to generate a Local Projection method for a problem where the samples in a class are multimodal [29]. This method is first to exploit the local structure of patterns to produce a representation for test samples and then uses a classifier to classify the test samples; we refer to this method as Local Projection method. However, the proposed
The second The first symmetrical image symmetrical image
Total images of each class The number of correct identifications
Figure 6: The classification results of the three classes of fasteners by the improved sparse representation algorithm.
method in this paper has some distinctions with Local Projection method: it takes the relationship between the test sample and neighbors into account by setting different coefficients for different neighbors and uses only the 𝐾 nearest neighbors to represent and classify the test sample; the test sample and its nearest neighbors usually belong to the same class. In a word, the proposed method has the following rationales: in the module of the construction of symmetrical sample, the use of the symmetrical image does enable the fastener recognition method to exploit more available information of the fastener which is not shown by the original samples; since the “symmetrical fastener” training samples are complementary for the original training samples, it is very useful to overcome the trouble of nonsufficient training samples. Moreover, it is a simple way to obtain more training and test samples, and the detection system can capture only a few original training samples and still obtain enough information of the fastener. On the other hand, the symmetrical image is also sufficiently different from the original fastener image in terms of the distance metric, and the original distance is much bigger than the first symmetrical distance and also much smaller than the second symmetrical distance. Two types of symmetrical distance are two polarized developments relative to the original distance between original testing images and original training images; it is helpful for the improved sparse representation algorithm to accurately classify the test sample and overcome the error identification problem of the fastener image in fastener recognition. In the module of the fastener recognition, its first phase identifies a number of training samples that are the most similar to the test sample and takes the class labels of the identified training samples as candidates for the class label of the test sample. As the class labels of the identified training samples are usually a subset of those of all the training samples, ultimate classification becomes a problem of determining the class label from a smaller number of candidates. Under the conditions where the genuine class label of the test sample is really one of those of the identified training samples, this will be very helpful for the second phase to perform an accurate classification.
8
Mathematical Problems in Engineering Table 3: The recall rate (%) of different methods on the fastener database.
Number of the training samples of each subject SVM Improvement to SVM NNA Improvement to NNA SRC Improvement to SRC
50 84.3 88.8 86.3 87.5 87.3 89.8
Intact fastener 100 150 87.5 89.0 91.2 95.8 88.5 92.8 89.8 94.5 89.3 93.3 90.3 95.8
4. Experimental Results In this section, we evaluated the effectiveness of our methods by performing experiments on railway fasteners databases. This fastener dataset consists of 1500 images from 3 subjects each providing 500 images; we segment the fastener image from the rail image which is collected by the video collection system, and the image size is 110∗170 pixels. For each subject, part of 500 images was randomly selected to serve as training samples and the remaining ones were used for testing. All experiments were implemented using the Matlab 2010 on a PC with an Intel i5-2430 Processor. The performance of fastener classification is evaluated by recall rate [30], recall rate indicates the correctness of classification and recognition results, recall rate is widely used criteria for evaluating the performance of classification or detection algorithms, and it is defined as Recall rate =
𝑇𝑝 𝑁
,
(9)
where 𝑇𝑝 is the number of samples that are correctly classified in 𝑁 testing samples. In other words, recall rate requires detection method to find most of defects on rail images without missing. 4.1. Experiment of Image Symmetrical Operation in the Fastener Database. We first verify the effectiveness of image symmetrical operation method by performing experiments on railway fastener databases. In this section, 50, 100, 150, and 250 fastener images of each subject were randomly selected to serve as original training samples and the remaining ones were used for testing, respectively. It should be noted that the fasteners of the same type are counted separately. Hereafter, the integrations of our proposed scheme and support vector machine (SVM), Nearest Neighbor Analysis (NNA), and SRC are referred to as the improvements to SVM, NNA, and SRC, respectively. Table 3 shows the recall rate of different methods; we see that our proposed scheme can improve SVM, NNA, and SRC and obtain high recall rate for all types of fasteners, especially for partially worn fastener. For example, when each subject provided 150 training samples, the rates of recall rate of SVM, NNA, and SRC are 83.7%, 87.8%, and 89.8%, respectively; however, the recall rates of the improvements to SVM, NNA, and SRC are 95.7%, 96.8%, and 97.5%, respectively. The experiments show that the proposed scheme not only greatly improves the accuracy of the representation-based classification and recognition
250 93.5 96.3 94.5 96.5 95.5 96.3
Partially worn fastener 50 100 150 250 77.5 81.3 83.7 85.3 89.5 91.6 95.7 98.5 81.6 83.3 87.8 92.3 89.8 91.3 96.8 99.0 85.5 88.3 89.8 91.3 89.3 93.7 97.5 96.8
50 92.5 94.5 91.5 92.5 94.3 94.8
Missing fastener 100 150 94.8 95.3 96.8 97.3 94.3 95.8 95.8 96.3 94.8 96.3 95.5 97.2
250 98.0 98.5 97.3 97.8 97.5 98.3
methods but also is helpful for improving other fastener recognition methods. 4.2. Variation of the Performance of Our Method with Different Number of Candidate Samples. In this section, we mainly want to examine how 𝐾 affects computation time and recognition accuracy. In this section, 250 fastener images of each subject were randomly selected to serve as original training samples and the rest are used for testing. In addition, we set the parameter 𝐾 to be 10, 20, 60, 100, 150, and 200 in the fastener databases. In order to comprehensively show the performance of our method, we use Table 4 to briefly indicate the variation of the rate of recall rate of our method with different number of candidate samples. We see that when the number of candidate samples is smaller, our method almost always obtains a higher recall rate. This clearly shows that the problem of fastener detection turns into a 𝑘-class classification problem from a 𝑐-class classification problem by discarding the samples that are “far” from the test sample in the first phase of the improved sparse representation algorithm (of course, 𝐾 is smaller than 𝑐), and it is really beneficial for the improvement of the accuracy of our method. However, this classifier exploits the neighbors of the test sample too coarsely and usually produces a bad classification result when 𝐾 has a large value. Moreover, compared to the original SRC, though the proposed algorithm adds a procedure to find the 𝐾 candidate training samples, it can significantly reduce the scale of the precise fastener recognition in the secondphase problem solved in performing SRC, and its own computational complexity is quite low. Therefore, the total computational cost of the improved sparse representation algorithm decreases, which is confirmed in the experimental results. The results of CPU time are also shown in Table 4. When using 𝐾 = 20 our method can obtain around 5 times speedup compared to classical SRC. 4.3. Performance Comparison with Relative Fastener Detection Methods. In this section, we compare the proposed method with some relative fastener detection methods. We first reimplemented the feature extraction and classification algorithm in [6, 7, 26, 31] and let them operate on original images. Moreover, we also let the methods operate on the symmetrical images, so as to evaluate the effectiveness of the proposed method. When we set the parameter 𝐾 = 20, in other words, the first 20 fastener images of each subject were used as the original training samples and the remaining fastener images were taken as the test samples, the proposed
Mathematical Problems in Engineering
9
Table 4: Comparison of recall rate and mean CPU time with different number of candidate samples. Method
SRC
CPU time (s) Recall rate (%)
1.606 87.3
𝑘 = 10 0.314 97.8
𝑘 = 20 0.336 98.8
𝑘 = 60 0.387 95.3
SRC-KNS 𝑘 = 100 0.462 91.8
𝑘 = 150 0.605 88.3
𝑘 = 200 0.839 87.8
Table 5: The recall rate (%) of different methods on fastener database. Methods Xia’s method on original image [6] Xia’s method on symmetrical image [6] Yang’s method on original image [7] Yang’s method on symmetrical image [7] Feng’s method on original image [26] Feng’s method on symmetrical image [26] Zhang’s method on original image [31] Zhang’s method on symmetrical image [31] The proposed method in this paper
Intact fastener 94.3 94.0 93.5 93.8 95.5 95.8 95.3 95.3 97.5
method outperforms the other methods in fastener databases, especially in the subsets of partially worn fastener. As the results shown in Table 5, when the experiment operates on symmetrical images, the recall rates of the methods in literatures [6, 7, 26, 31] and our method are 94.5%, 85.3%, 94.3%, 96.8%, and 98.5%, respectively; however, the recall rates of methods in literatures [6, 7, 26, 31], operating on original images are 86.3%, 84.5%, 87.8%, 96.3%, and 98.5%, respectively. This indicates the virtual symmetrical images and the sparsity are helpful in improving the classification accuracy for fastener recognition. Moreover, the CRC [31] and our algorithm achieve higher classification accuracies than the other methods. The CRC is similar to the first phase of the proposed method. It classifies the test sample into the class corresponding to the least error in our first phase. However, there is misclassification in CRC if the right training sample does not contribute most in the first phase. Our method can avoid such misclassifications by recalculating the coefficient vector using the retained 𝐾 training samples in the precise recognition phase for the symmetrical image of our method; thus this phase increases the contribution of the right training samples and suppresses those of the others, and this method enhances the sparsity of the 𝐾 nearest samples in representation. The experimental results show that the proposed method can classify the fastener with a high accuracy and outperforms the state-of-the-art fastener recognition methods.
5. Conclusion The detection of worn and missing fasteners is an important task in railway inspection. However, the traditional manual inspection is of poor efficiency and dangerous to workers. On the other hand, the earlier automatic inspection systems based on computer visions are of low reliability. In this paper, a novel railway inspection method is proposed, which is
The recall rate Partially worn fastener 86.3 94.5 84.5 85.3 87.8 94.3 96.3 96.8 98.5
Missing fastener 94.8 95.3 96.3 95.8 95.5 96.0 95.3 95.5 98.3
able to detect the damaged fasteners, especially the fasteners which partially worn. This method has the following three major advantages: (1) The proposed symmetrical image of the original fastener indeed simulates possible variation of the fastener image; thus we capture only a few original training samples and still obtain enough information of the fastener. The proposed scheme is very simple and also helpful for improving fastener recognition methods. (2) We turn the detection problem of the original testing image into the detection of two tests of symmetrical image. Due to the interclass feature distance between the two classes symmetrical images and intact training fasteners are two polarized developments (relative to the original distance between intact training fasteners and intact testing fasteners); it is very easy to judge which class the first and second symmetrical image belong to; then the proposed method can achieve a better recognition result by integrating two classes of symmetrical image for representation-based fastener recognition. (3) The first and second phases of the improved sparse representation algorithm in this paper respectively made a coarse and fine classification decision for the test samples. The first phase exploits the discriminative information of 𝐾 nearest samples to enhance their sparsity of the test sample and then represent the test sample as a linear combination of the determined 𝐾 nearest neighbors so as to perform fine classification. It can greatly eliminate the side-effect, on the classification of the test sample, of the classes that are “far” from it (the test sample is usually not from these classes) and greatly improve the accuracy of the representation-based classification methods. The analyses and experimental results sufficiently show the rationales of the proposed scheme.
Conflict of Interests The authors declare that there is no conflict of interests regarding the publication of this paper.
10
Acknowledgments This work is supported by the National Natural Science Foundation of China (Grant no. 51305368), Science and Technology Support Project of Sichuan Province (Grant no. 2012GZ0102 and no. 2014GZ0005), and Doctoral Innovation Foundation of Southwest Jiaotong University (Grant no. 2014).
References [1] Q. Yang and J. Lin, “Track gauge dynamic measurement based on 2D laser displacement sensor,” in Proceedings of the 2nd International Conference on Mechanic Automation and Control Engineering (MACE ’11), pp. 5473–5476, IEEE, Hohhot, China, July 2011. [2] C. Alippi, E. Casagrande, F. Scotti, and V. Piuri, “Composite real-time image processing for railways track profile measurement,” IEEE Transactions on Instrumentation and Measurement, vol. 49, no. 3, pp. 559–564, 2000. [3] C. Alippi, E. Casagrande, M. Fumagalli, F. Scotti, V. Piuri, and L. Valsecchi, “An embedded system methodology for real-time analysis of railways track profile,” in Proceedings of the 19th IEEE Instrumentation and Measurement Technology Conference, pp. 747–751, May 2002. [4] R. S. Edwards, S. Dixon, and X. Jian, “Characterisation of defects in the railhead using ultrasonic surface waves,” NDT & E International, vol. 39, no. 6, pp. 468–475, 2006. [5] P. L. Mazzeo, M. Nitti, E. Stella, and A. Distante, “Visual recognition of fastening bolts for railroad maintenance,” Pattern Recognition Letters, vol. 25, no. 6, pp. 669–677, 2004. [6] Y. Xia, F. Xie, and Z. Jiang, “Broken railway fastener detection based on adaboost algorithm,” in Proceedings of the International Conference on Optoelectronics and Image Processing (ICOIP ’10), pp. 313–316, Haiko, China, November 2010. [7] J. Yang, W. Tao, M. Liu, Y. Zhang, H. Zhang, and H. Zhao, “An efficient direction field-based method for the detection of fasteners on high-speed railways,” Sensors, vol. 11, no. 8, pp. 7364– 7381, 2011. [8] E. Stella, P. Mazzeo, M. Nitti, G. Cicirelli, A. Distante, and T. D’Orazio, “Visual recognition of missing fastening elements for railroad maintenance,” in Proceedings of the 5th International Conference on Intelligent Transportation Systems, pp. 94–99, Singapore, September 2002. [9] P. De Ruvo, A. Distante, E. Stella, and F. Marino, “A GPU-based vision system for real time detection of fastening elements in railway inspection,” in Proceedings of the 16th IEEE International Conference on Image Processing (ICIP ’09), pp. 2333–2336, Cairo, Egypt, November 2009. [10] G. De Ruvo, P. De Ruvo, F. Marino, G. Mastronardi, P. L. Mazzeo, and E. Stella, “A FPGA-based architecture for automatic hexagonal bolts detection in railway maintenance,” in Proceedings of the 7th International Workshop on Computer Architecture for Machine Perception (CAMP ’05), pp. 219–224, IEEE, Palermo, Italy, July 2005. [11] Y. Rubinsztejn, Automatic detection of objects of interest from rail track images [M.S. thesis], School of Computer Science, University of Manchester, Manchester, UK, 2011. [12] Y. Li, C. Otto, N. Haas, Y. Fujiki, and S. Pankanti, “Componentbased track inspection using machine-vision technology,” in Proceedings of the 1st ACM International Conference on Multimedia Retrieval (ICMR ’11), Article 60, Trento, Italy, April 2011.
Mathematical Problems in Engineering [13] P. L. Mazzeo, N. Ancona, E. Stella, and A. Distante, “Visual recognition of hexagonal headed bolts by comparing ICA to wavelets,” in Proceedings of the IEEE International Symposium on Intelligent Control, pp. 636–641, IEEE, Houston, Tex, USA, October 2003. [14] C. Mandriota, M. Nitti, N. Ancona, E. Stella, and A. Distante, “Filter-based feature selection for rail defect detection,” Machine Vision and Applications, vol. 15, no. 4, pp. 179–185, 2004. [15] M. Singh, S. Singh, J. Jaiswal, and J. Hempshall, “Autonomous rail track inspection using vision based system,” in Proceedings of the IEEE International Conference on Computational Intelligence for Homeland Security and Personal Safety (CIHSPS ’06), pp. 56–59, Alexandria, VA, USA, October 2006. [16] N. P. H. Thian, S. Marcel, and S. Bengio, “Improving face authentication using virtual samples,” in Proceedings of the IEEE International Conference on Acoustics, Speech, and Signal Processing (ICASSP ’03), pp. 233–236, IEEE, April 2003. [17] L. Qiao, S. Chen, and X. Tan, “Sparsity preserving discriminant analysis for single training image face recognition,” Pattern Recognition Letters, vol. 31, no. 5, pp. 422–429, 2010. [18] A. Sharma, A. Dubey, P. Tripathi, and V. Kumar, “Pose invariant virtual classifiers from single training image using novel Hybrid-eigenfaces,” Neurocomputing, vol. 73, no. 10-12, pp. 1868–1880, 2010. [19] A. Sharma, A. Dubey, P. Tripathi, and V. Kumar, “Pose invariant virtual classifiers from single training image using novel hybrideigenfaces,” Neurocomputing, vol. 73, no. 10–12, pp. 1868–1880, 2010. [20] A. Bosch, A. Zisserman, and X. Munoz, “Representing shape with a spatial pyramid kernel,” in Proceedings of the 6th ACM International Conference on Image and Video Retrieval (CIVR ’07), pp. 401–408, ACM, July 2007. [21] Y. Xu, X. Li, J. Yang, and D. Zhang, “Integrate the original face image and its mirror image for face recognition,” Neurocomputing, vol. 131, pp. 191–199, 2014. [22] Z. Jian, H. Luxi, J. Jian, and X. Yu, “A fast iterative pursuit algorithm in robust face recognition based on sparse representation,” Mathematical Problems in Engineering, vol. 2014, Article ID 683494, 11 pages, 2014. [23] Y. Xu, W. Zuo, and Z. Fan, “Supervised sparse representation method with a heuristic strategy and face recognition experiments,” Neurocomputing, vol. 79, no. 1, pp. 125–136, 2012. [24] J. Yang, J. Wright, T. S. Huang, and Y. Ma, “Image super-resolution via sparse representation,” IEEE Transactions on Image Processing, vol. 19, no. 11, pp. 2861–2873, 2010. [25] J. Ye, H. Wang, and W. Yang, “Image reconstruction for electrical capacitance tomography based on sparse representation,” IEEE Transactions on Instrumentation and Measurement, vol. 64, no. 1, pp. 89–102, 2014. [26] H. Feng, Z. Jiang, F. Xie, P. Yang, J. Shi, and L. Chen, “Automatic fastener classification and defect detection in vision-based railway inspection systems,” IEEE Transactions on Instrumentation and Measurement, vol. 63, no. 4, pp. 877–888, 2014. [27] C. H. Chan, M. A. Tahir, J. Kittler, and M. Pietik¨ainen, “Multiscale local phase quantization for robust component-based face recognition using kernel fusion of multiple descriptors,” IEEE Transactions on Pattern Analysis and Machine Intelligence, vol. 35, no. 5, pp. 1164–1177, 2013. [28] Y. Xu, D. Zhang, J. Yang, and J.-Y. Yang, “A two-phase test sample sparse representation method for use with face recognition,” IEEE Transactions on Circuits and Systems for Video Technology, vol. 21, no. 9, pp. 1255–1262, 2011.
Mathematical Problems in Engineering [29] Z. Wang, Q. Ruan, and G. An, “Face recognition using double sparse local fisher discriminant analysis,” Mathematical Problems in Engineering, vol. 2015, Article ID 636928, 9 pages, 2015. [30] M.-M. Cheng, N. J. Mitra, X. Huang, P. H. S. Torr, and S.M. Hu, “Global contrast based salient region detection,” IEEE Transactions on Pattern Analysis and Machine Intelligence, vol. 37, no. 3, pp. 569–582, 2015. [31] L. Zhang, M. Yang, and X. Feng, “Sparse representation or collaborative representation: which helps face recognition?” in Proceedings of the IEEE International Conference on Computer Vision (ICCV ’11), pp. 471–478, Barcelona, Spain, November 2011.
11
Advances in
Operations Research Hindawi Publishing Corporation http://www.hindawi.com
Volume 2014
Advances in
Decision Sciences Hindawi Publishing Corporation http://www.hindawi.com
Volume 2014
Journal of
Applied Mathematics
Algebra
Hindawi Publishing Corporation http://www.hindawi.com
Hindawi Publishing Corporation http://www.hindawi.com
Volume 2014
Journal of
Probability and Statistics Volume 2014
The Scientific World Journal Hindawi Publishing Corporation http://www.hindawi.com
Hindawi Publishing Corporation http://www.hindawi.com
Volume 2014
International Journal of
Differential Equations Hindawi Publishing Corporation http://www.hindawi.com
Volume 2014
Volume 2014
Submit your manuscripts at http://www.hindawi.com International Journal of
Advances in
Combinatorics Hindawi Publishing Corporation http://www.hindawi.com
Mathematical Physics Hindawi Publishing Corporation http://www.hindawi.com
Volume 2014
Journal of
Complex Analysis Hindawi Publishing Corporation http://www.hindawi.com
Volume 2014
International Journal of Mathematics and Mathematical Sciences
Mathematical Problems in Engineering
Journal of
Mathematics Hindawi Publishing Corporation http://www.hindawi.com
Volume 2014
Hindawi Publishing Corporation http://www.hindawi.com
Volume 2014
Volume 2014
Hindawi Publishing Corporation http://www.hindawi.com
Volume 2014
Discrete Mathematics
Journal of
Volume 2014
Hindawi Publishing Corporation http://www.hindawi.com
Discrete Dynamics in Nature and Society
Journal of
Function Spaces Hindawi Publishing Corporation http://www.hindawi.com
Abstract and Applied Analysis
Volume 2014
Hindawi Publishing Corporation http://www.hindawi.com
Volume 2014
Hindawi Publishing Corporation http://www.hindawi.com
Volume 2014
International Journal of
Journal of
Stochastic Analysis
Optimization
Hindawi Publishing Corporation http://www.hindawi.com
Hindawi Publishing Corporation http://www.hindawi.com
Volume 2014
Volume 2014