An ASABE Meeting Presentation Paper Number: 072042
Chapel Branch Creek TMDL Development: Integrating TMDL Development with Implementation. T. M. Williams, Clemson University, Baruch Institute of Coastal Ecology and Forest Science, PO Box 596, Georgetown SC, 29442,
[email protected]
D. M. Amatya, U.S. Forest Service, Center for Forested Wetlands, 2730 Savannah Highway, Charleston, SC 29414,
[email protected]
D. R. Hitchcock Clemson University, Baruch Institute of Coastal Ecology and Forest Science, PO Box 596, Georgetown SC, 29442,
[email protected]
N. Levine College of Charleston, Department of Geology and Environmental Geosciences, 66 George Street, Charleston, SC, 29424,
[email protected]
E. N. Mihalik College of Charleston, Masters of Environmental Studies, 66 George Street, Charleston, SC, 29424,
[email protected]
Written for presentation at the 2007 ASABE Annual International Meeting Sponsored by ASABE Minneapolis Convention Center Minneapolis, Minnesota 17 - 20 June 2007 Paper presentation with updated materials from the one first presented in poster session at the March 2007, ASABE TMDL Conference, San Antonio, TX
The authors are solely responsible for the content of this technical presentation. The technical presentation does not necessarily reflect the official position of the American Society of Agricultural and Biological Engineers (ASABE), and its printing and distribution does not constitute an endorsement of views which may be expressed. Technical presentations are not subject to the formal peer review process by ASABE editorial committees; therefore, they are not to be presented as refereed publications. Citation of this work should state that it is from an ASABE meeting paper. EXAMPLE: Author's Last Name, Initials. 2007. Title of Presentation. ASABE Paper No. 07xxxx. St. Joseph, Mich.: ASABE. For information about securing permission to reprint or reproduce a technical presentation, please contact ASABE at
[email protected] or 269-429-0300 (2950 Niles Road, St. Joseph, MI 49085-9659 USA).
Abstract. Chapel Branch Creek is a small creek draining into Lake Marion near Santee, SC. Lake Marion is an important recreational area for coastal South Carolina, and the adjacent Town of Santee receives much of its economic activity from related tourism. The creek is on the South Carolina Department of Health and Environmental Control’s (SCDHEC) list of impaired waters (2004 - 303d list) for excess nitrogen (N), phosphorus (P), chlorophyll-a, and pH. Despite being only 1600 ha, the watershed has an unusually large number of land uses with varying potential nonpoint sources of N and P: sewage effluent spraying, golf course management, highway runoff, urban and residential stormwater runoff, agriculture and some forests. Contamination of Chapel Branch Creek directly impacts the economic health of the local community. Our initial meetings with stakeholders revealed that vigorous debate has occurred for the past decade over the sources of contamination and responsibility for clean-up. SCDHEC has recently awarded an EPA Section 319 grant to USDA Forest Service, Center for Forested Wetlands Research (CFWR) Unit with collaborators from Clemson University and College of Charleston for a project entitled Watershed Characterization and TMDL Implementation for Chapel Branch Creek (Project Type II) (Amatya et al., 2005). The major challenge to TMDL (Total Maximum Daily Load) implementation is to develop stakeholder “buy in”. All stakeholders agree on the need for load reductions and are willing to implement needed management practices. However, each group (farmland owners, local residents, business owners) is wary of bearing an unfair share of load reduction costs. Successful TMDL implementation requires both scientifically valid determination of source loadings and clear demonstration of results to the various stakeholder groups. The watershed is being mapped and examined in GIS so that a widely used nonpoint source hydrology/water quality model SWAT (Arnold et al., 1998) can be applied with the on-site measured hydrology and nutrients data to calculate the numerical data on load allocations/reductions needed to develop a TMDL and best management practices. A year-long study to collect rainfall, flow data and water samples from sub-watersheds containing potential sources will be used to educate and convince the stakeholders of SWAT model validity. Early involvement of stakeholders in study design has developed a strong cooperation toward the goal of achieving successful TMDL implementation and effective pollutant load reductions using various best management practices (BMPs). Keywords. Nitrogen, phosphorus, hydrology, SWAT, BMPs, South Carolina
The authors are solely responsible for the content of this technical presentation. The technical presentation does not necessarily reflect the official position of the American Society of Agricultural and Biological Engineers (ASABE), and its printing and distribution does not constitute an endorsement of views which may be expressed. Technical presentations are not subject to the formal peer review process by ASABE editorial committees; therefore, they are not to be presented as refereed publications. Citation of this work should state that it is from an ASABE meeting paper. EXAMPLE: Author's Last Name, Initials. 2007. Title of Presentation. ASABE Paper No. 07xxxx. St. Joseph, Mich.: ASABE. For information about securing permission to reprint or reproduce a technical presentation, please contact ASABE at
[email protected] or 269-429-0300 (2950 Niles Road, St. Joseph, MI 49085-9659 USA).
Introduction South Carolina assured the USEPA “The State intends to achieve waste load and load allocation reductions in 303(d) listed waters in order to achieve the water quality goals of the Clean Water Act. This includes waters impaired solely or primarily by NPS sources. For each such water, a TMDL will be established that includes specific recommendations for reducing nonpoint Source (NPS) loads. In making these recommendations various pollution control best management practices (BMPs) will be cited for specific applications. The BMPs recommended will be selected from the total inventory available as described in EPA’s “Guidance Specifying Best Management Practices for NPS Control in Coastal Waters” as well as those that have been applied successfully in South Carolina and nationwide. BMPs selected will have been proven effective and in most cases will have data available for pollutant removal efficiencies. Innovative and novel solutions will be considered.”(SCDHEC 1998). Following identification of impaired waters, the South Carolina Department of Health and Environmental Control (SCDHEC) would develop TMDLs and direct EPA’s Section 319 funding to implement BMPs for correction of water quality problems. The approach also depends heavily on the care and concern of the general public. Best management practices are generally placed on private lands with some sort of cost sharing arrangement (Boman and Thomas 2007). “The Department recognizes that for most 303(d) waters in which impairment results primarily from NPS loads, it will need to seek and obtain the support and voluntary involvement of key stakeholders in the watershed. The Department has ongoing programs aimed at educating and enlisting the support of the citizenry towards the goal of reducing each person’s NPS contribution. Using the watershed approach, such programs have built and will continue to build partnerships between the Department and private and public stakeholders” (SCDHEC 1998). Chapel Branch Creek (CBC) illustrates many of the difficulties that agencies face when dealing with (NPS) impaired watersheds. CBC watershed, a tributary of Santee River at Lake Marion located in Orangeburg County, South Carolina (SC) was included on the South Carolina 2004 303(d) list of water bodies for impairment of aquatic life due to elevated chlorophyll-a, Total N (TN), Total P (TP), and pH. In 2006, the US Forest Service (CFWR), in cooperation with Clemson University and the College of Charleston, began a Section 319 project to develop and implement a TMDL for Chapel Branch Creek for N and P. Chapel Branch Creek is an example of a watershed with measurable impairments affecting larger valuable water resource, Lake Marion. Lake Marion and connected Lake Moultrie are the only lakes within the South Carolina coastal plain that provide a much needed center of recreational activity for the state (Fig. 1: Study Area Location Map). Economic development of this region of the state is dependent on continued recreational use of Lake Marion. Improving Chapel Branch water quality is of great social and economic importance to all the people in the region. Although CBC watershed is relatively small (~ 1600 ha), there are multiple land uses within the drainage area that are potential pollution sources: agriculture, stormwater runoff, golf course management, treated wastewater irrigation, and some forestry. Each potential source is represented by a unique set of stakeholders, each willing to implement BMPs in order to improve the water quality of Chapel Branch Creek. Water quality has been a problem on Chapel Branch for over two decades. Over that time, controversy has developed as to which potential source is ultimately responsible for increased N and P in Chapel Branch Creek. Resolving contributions made by various sources will be a key aspect of stakeholder “buy-in” on the final TMDL development.
2
Since each potential source involves a unique audience, resolution of sources will be important to the overall acceptance by each audience of the TMDL and their willingness to implement BMPs to achieve the needed load reduction. Therefore, the process proposed in the study involves a strong partnership of stakeholders integrated into both TMDL development and implementation. Stakeholder “buy in” for the TMDL becomes a function of ownership, from data collection for TMDL development, through data analysis and modeling, to implementation of best management practices (BMPs).
Lake Marion
South Carolina
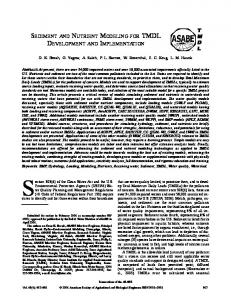
Figure 1. Outline of Chapel Branch Creek Watershed with local landmarks and nine sampling locations placed on 1999 aerial photograph of Santee, South Carolina.
3
Project Description The Chapel Branch Creek (CBC) watershed is located within the upper coastal plain region of Orangeburg County, South Carolina (33° 31’ N 80° 25’W) (Fig. 1) The watershed drains an area of approximately 1600 ha (4000 acres), contained within Hydrologic Unit 03050111010 on Santee River Basin (SC DHEC, 2000). Topography of the watershed is characterized by flat lands at about 36 m elevation in the upstream areas with somewhat steeper topography (2630m) on the downstream section near Lake Marion (Fig. 1). Interstate 95 (I-95) and SC Highway 15 (SC 15) run north-south through the Town of Santee located within the watershed. Similarly, SC Highway 301 and 6 run east-west in the southern boundary and through the Town of Santee within the watershed, respectively (Fig. 1). The watershed incorporates complex land use patterns with residential, commercial, and industrial areas interspersed among agricultural and forested lands. Most of the forested lands are located within Santee State Park on the northwestern bank of Chapel Branch Creek. There are also three golf courses, as well as a wastewater treatment plant maintained by the Town of Santee located along the eastern boundary of the drainage area. The soils in the watershed are dominated by moderately to somewhat poorly drained Goldsboro-Lynchburg series sandy clay loam on most of the agricultural areas in the west and southwest and moderately well drained Neeses series sandy clay and clay loam to the south and east (SCS, 1988). Figure 2 shows representative GIS land use, topography and soils layers. Our initial planning meetings with stakeholders and other state and federal agencies at Santee State Park on March 16 and June 16, 2004 revealed that problems at Chapel Branch Creek are not new. In the past two decades there have been a number of efforts to resolve them, including installing new sanitary systems and construction of a new sewage treatment plant. Additionally, the SC Department of Transportation (DOT) in cooperation with US Army Corps of Engineers’ Aquatic Ecosystem Study team had planned to build a sedimentation pond to control a significant amount of sediment discharged by the interstate and highways on one of the right bank tributaries of the Chapel Branch. Sediments are often reported to carry particulate P. Treatments such as herbicides and grass carp stocking are being used to decrease the algae plant populations (Miller, 2004). During that period there has been considerable controversy over the sources of N and P in Chapel Branch Creek. At the meeting all the stakeholders were assembled and all agreed on the importance of water quality to the vitality of the town and surrounding region. All were also interested in participating in clean up efforts that were targeted to the sources of N and P overloads. However, there was also a desire that sources be clearly identified and that clean up efforts be carefully targeted to those sources. These sentiments were keenly felt by several stakeholders involved with previous controversies. Chapel Branch Creek is a prime example of a system in which Reckhow (2007) advises that a standard TMDL implementation should not be used. The small basin is not gauged, the only concentration data comes from monthly grab samples on one tributary that represents less than 70% of the watershed. No data are available on the sections of the watershed draining the sewage treatment plant and the golf course with spray effluent on the northeast corner (Fig. 1). Development of a TMDL for this watershed by techniques used in the past (a simple calculation of predicted runoff from nearby gauged stations combined with literature loading values) would certainly contain large uncertainty in both hydrology and inherent water quality. Our plan to create a TMDL for Chapel Branch Creek avoids much of that uncertainty and will support “buy in’ by the various stakeholders that will be critical to successful implementation of BMPs on the watershed. This plan is based on a combined strategy of sampling, hydrological monitoring, modeling and calibration of the models to the sample data to provide a robust
4
understanding of the potential sources of N and P and the possible solutions to achieving the planned TMDL through the BMPs and education components for the system.
A
B A Chapel Branch Creek watershed is characterized by gently rolling topography moving into a well constrained incised stream Empting into Lake Marion B Chapel Branch Creek watershed is composed of thirty-three soils at the series level. C Soils range from well drained sandy soils to Poorly drained hydric soils. D The 1:6000 scale land use allows for the separation of management practices with in the agricultural regions. True estimates of impermeable ground can be developed to better understand run off relationships.
C
D Figure 2 A – D; Representative GIS Layers of Topography , Watersheds, Land use, and Soils.
Sampling Strategy In order to reduce the uncertainty of the TMDL calculation and to encourage the stakeholders, a program to collect hydrology and water quality data is being implemented in 2007. The program
5
will consist of hydrologic data collection on rainfall and runoff of two major tributaries to Chapel Branch and stormwater quality sampling on a series of sub-watersheds.
Stormwater Sampling. An event-based sampling strategy will be conducted for nutrients from various source areas for at least one year-period (2007-08) during both the dry and wet seasons. The goal of the sampling will be to refine the estimates of TN and TP loading from each land use in the watershed: agriculture, forestry, golf courses, residential and commercial developments, roads and highways, and wastewater treatment. In addition, we will sample a forested site where only groundwater inputs from the karst-dominated limestone will influence pH. The watershed for Chapel Branch Creek is well defined, and developed site surveys and USGS topographic maps are available. Over 80% of the watershed is covered with 5’ contour USGS quadrangle maps, allowing mapping of natural boundaries. Also cooperators have provided us with surveys to indicate boundaries in flat areas where ditches define watershed areas. Accordingly, we have delineated the Chapel Branch Creek watershed and located a series of sub-watersheds that represent the various potential sources of N and P in the watershed. We have identified the following nine sampling sites that represent sub-watersheds with each of the potential N and P sources such as agriculture-forestry, golf course, golf course with wastewater irrigation, stormwater runoff from streets, stormwater from highway ditch as well as an undisturbed forested sub-watershed from limestone area within the Santee State Park (Fig. 1). SL #1. Stream draining the area with sewage treatment plant and irrigated golf course. SL# 2. End of road ditch along SC-15 Hwy with storm drainage from Town of Santee. SL #3. Combined outflow of sample locations 2 and 4 that includes entire southern portion of Chapel Branch Creek watershed. SL #4. Lower end of ditch along I-95 that includes all of I-95 runoff and associated agricultural fields. SL #5. Headwater of CBC (primarily agriculture and forestry). SL #6. Upstream of golf course that includes water from location 5 and small low income residential development. SL #7. On CBC downstream of golf course. SL #8. Outlet of small watershed that drains only Santee State Park land without any development. SL # 9. At the headwaters of ditch of sample location 4 (primarily vegetable agriculture). We will grab sample water in each of these locations for one year using sampling protocols documented in our Quality Assurance Project Plan (QAPP) or QA/QC document, recently approved by SCDHEC (Amatya and Hitchcock, 2007). Sample collection timing will correspond to storm flow events in each of the four seasons. A storm flow event will be defined by incoming rainfall rate and amount of rain: a rate 4”/hour or greater for more than 20 minutes, a rate of 2”/hour or greater for more than 45 minutes, 1”/hour or greater for 90 minutes, 0.5”/hour for more than 4 hours or if cumulative rainfall in a 12 hour period is over 2”. In any event, samples will not be collected if there is not flow at six of the nine sampling points. Seasons are defined as follows: Summer = June 1 – August 31; Fall = September 1 –November 31; Winter = December 1- February 28, and Spring = March 1 - May31. At each sampling location, five samples based on hydrograph stage will be taken for each event. Two samples will be taken during the rising limb of the hydrograph prior to peak stage, the third during the falling limb of the hydrograph immediately following peak stage, the fourth on the falling limb of the hydrograph at a stage approximately halfway between peak and low flow, and the fifth near the low flow. Comparisons between sampling points are of most interest for the study. However, each sampling location must have at least three samples collected for an event to be considered valid for such a comparison. All samples collected during the event will be stored in ice coolers and transported back on same day to our project cooperator Santee Cooper’s Analytical and Biological Services laboratory in Moncks Corner, SC. One duplicate
6
from one of the five samples will be made to make six samples altogether for laboratory analysis and quality control.
Hydrology and base flow sampling A Teledyne ISCO 4150 Flow Logger, equipped with a Low Profile Area Velocity Sensor, will be installed in conjunction with a Teledyne ISCO 3700 automatic Water Quality Sampler at the outlet of the 36-inch diameter concrete culvert at sampling location SL #7 (Fig. 1). We are also planning to install an additional flowmeter at SL # 3. The watershed for SL#7 includes the entire northern and western section of Chapel Branch Creek watershed and has primarily agriculture, low income housing and a golf course as land uses. The watershed of SL#3 includes the southeastern section, southeast of State Highway 15, and includes stormwater runoff of the town of Santee and Interstate 95. Combined these watersheds cover over 70% of the entire Chapel Branch Creek watershed. The Low Profile AV Sensor uses Doppler technology to measure average velocity across the liquid depth in a channel/ stream or conduit directly, and an integral pressure transducer measures liquid depth to determine the flow area. This sensor allows measurement of shallow flows, typically down to 1 inch. The ISCO 4150 Flow Logger calculates flow rate by multiplying the cross-sectional area of the flow in the channel, stream, or a conduit by its average velocity. The ISCO 3700 Water Quality Sampler (equipped with 24 1liter bottles for discrete sampling) will be triggered by the 4150 Flow Logger on a flowproportional basis during storm events based on flow rate. Rainfall will be measured by paired combinations of tipping bucket and manual gauges installed at three sites for the CBC project: at the Town of Santee offices, near the water treatment plant, and at Santee State Park (Fig. 1). The manual gauges are clear acrylic and made to U.S. Weather Bureau standards. They have an 11” capacity marked off in 0.01” increments. We will be using two types of tipping bucket gauge: the first is the Sierra-Misco Environment Ltd. Model 2501 unit (2 of these); the second is the Onset Model RG2M unit (1 of these). A Hobo H7 Event datalogger is connected to each tipping bucket mechanism to record the incidence of tips.
Water Quality Analysis Following collection, samples will be transferred to the Analytical and Biological Services Laboratory at Santee Cooper in Moncks Corner, SC. The analytical and preparation methods described in detail are EPA 300.0 using Ion Chromatography for Inorganic Ions, EPA 350.1 using Colorimetric, Semi-Automated Digester, AAII for Ammonia-Nitrogen EPA 351.2 using Colorimetric, Semi-Automated Digester, AAII for Total Kjeldahl-Nitrogen and EPA 365.4 Colorimetric, Semi-Automated Digester, AAII for Total Phosphorus .The cooperation of the SC Public Service Authority-Santee Cooper, is a major advantage to the study. The laboratory is SCDHEC-certified and also uses the same laboratory and analytical techniques in this study as used for the statewide water quality assessment in the Lake Marion region. This laboratory is recognized as an authority by both the regulatory agency and all the local stakeholders.
GIS Data Development and Modeling Rainfall/Runoff Modeling using CN and Rational Approach The Soil and Water Assessment Tool (SWAT) model will be used for assessing the watershed and designing BMPs to meet the TMDLs set by SCDHEC. The SWAT Model that will be used in this study is fully integrated with ArcGIS 9.0 and can be compared and calibrated using both the field data and other independent hydrologic models that will estimate components used in the SWAT model. As part of this project, the Chapel Branch Creek has been mapped at an
7
unprecedented scale. The base level of the DEM created for this project is in 1:24000 scale; it has been augmented in the flatter areas with 1:10,000 and 1:6,000 data. The land use layers have been mapped using high resolution aerial photography from 2005 and were generated at 1:6000 scale. The mapping has created a map of the true pervious/ impervious nature of the land capturing rooftops, driveways, roads and even individual sand traps within the golf courses. Table 1 shows the nature of the land use classes selected in the study and the relative amount of impervious areas. The watershed area of 2313 ha shown in Table 1 is larger than our previous estimate of 1,600 ha which did not include the lands that are being brought under the Interstate I-95 in the eastern side of the watershed (Fig. 1). The actual drainage area will be verified as we finish the culvert and drainage study of the area. Normally, streams with less than 10% impervious surface areas are considered to have less urban impairment. Chapel Branch creek falls into this category. All streams have been verified from the aerial photography, field walking with a GPS unit, and through automated flow analysis of the digital elevation model. The streams have an aggregate accuracy of 1:10,000 scale. A thorough search of the literature has provided a list of SCS-CN values for all of the land uses defined in the analysis. SCS curve number analysis can be used in the watershed as an independent verification for runoff generation using the SWAT model. Additionally C-factors for the Rational equations were also collected. Preliminary analysis of the Rational and SCS-CN runoff values have shown that the models are comparable over the size of the subwatersheds defined in the system and that the values selected in both methods are comparable. The data will be compared to the measured storm flows based on the gauged precipitation and stream flow events at SL #7 (Fig.1). The final runoff maps will be used as inputs to a HEC-RAS model, which will be used to examine the hydraulics and resulting stream flooding extents across the system. The results from these preliminary model simulations will be used to create a refined SWAT model of the watershed.
Table 1: General land use analysis of Chapel Branch Creek watershed Land Use
ACRES
HECTARES
Agriculture
1126.8
384.3
Bare Ground
60.4
25.3
Building
65.0
26.3
Forest
2113.5
751.6
Golf Course
271.3
103.0
Grass / Lawns
1052.5
388.5
Impervious Surface Roads 417.0
138.9
Open Water
1085.7
58.4
Sand Traps
4.8
1.9
Swimming Pools
0.5
0.2
Impervious Surface
482
195
Other
5716
2313
TOTALS
8
SWAT Modeling for BMP Design and TMDL analysis We will use the Soil and Water Assessment Tool (SWAT) model developed by Arnold et al., (1998) for load analysis (estimation and allocation) for current conditions in the Chapel Branch Creek watershed. Also, after source areas are identified, we will use SWAT model again for load analysis given the conditions with recommended BMPs at various locations in order to develop the TMDL. The SWAT model was developed to predict the impact of land management practices on water, sediment, and agricultural chemicals in complex watersheds with varying soils, land uses and management conditions (Santhi et al., 2002a). SWAT has recently also been used in TMDL development (DiLuzio et al., 2002; Santhi et al., 2001; Santhi et al., 2002b). Most recently the model was used for developing phosphorus (TP) TMDL for Robeson Creek (on Cape Fear River) in North Carolina (NC DENR 2003). We will provide explanations whenever any assumption for any model parameter has to be made because of no site-specific measurement and for limitations of data and any input parameter. We will follow the calibration and validation procedures suggested by Santhi et al. (2001) and by Van Liew and Garbrecht (2003) for the SWAT model. Similar statistics were also used by Amatya et al. (2003) in their study of lumped parameter models for nitrogen transport. The statistics used for the model performance evaluation are: Bias or deviation (D %) between the measured and simulated values for a given period, Coefficient of Determination (R2) and Nash-Sutcliffe coefficient (or Model efficiency, E), and Root Mean Square Error (RMSE). Positive values of bias (deviation) indicate under- and negative values indicate over-prediction. The R2 value is an indicator of strength of relationship between the observed and simulated values. The E-value indicates how well the plot of observed versus simulated value fits the 1:1 line. The RMSE value, a measure of the deviation of the predicted variable from the observed one, is also often used for evaluating a model performance. Means and standard deviations will also be computed for both the measured and predicted values. We will use measured flow data at sampling location (SL #7) to conduct model calibration and validation. Both the event hydrographs during the sampling as well as continuous daily outflows will be used for model calibration and validation. Graphical plots will also be used for evaluating the model performance in predicting hydrographs and pollutographs.
Best Management Practice Selection, Location, and Implementation As previously mentioned, there are a variety of possible sources causing Total N and Total P enrichment of the Chapel Branch Creek. The potential nonpoint pollution sources in the Chapel Branch watershed include, but are not limited to, agriculture and forestry, a golf course, a golf course with wastewater irrigation, stormwater runoff from streets, septic tanks, stormwater from a highway ditch and an undisturbed forested subwatershed. Depending on the source, a variety of BMPs can be employed to reduce nutrient loading from nonpoint sources. Each sample location corresponds with a given land use in the watershed. Once potentially impacting sources are determined, these sources will be prioritized and BMP types and locations will be established based on most potentially impacting sources. Table 2 provides some examples of BMPs that may be incorporated based on land use type and pollutant with reference to sample location on the Chapel Branch watershed.
9
Table 2. Potential Best Management Practices for Varying Land Uses by Pollutant
Land Use Type Sewage treatment / irrigation
Urban / residential / construction
Road / highway / construction
Sample Location(s)
Nitrogen BMP Options
1
Irrigation scheduling; Nutrient management plans; Vegetated buffers/wetlands
Irrigation scheduling; Nutrient management plans; Vegetated buffers/wetlands
2, 3, and 6
Vegetated buffers/wetlands; Rain gardens; Bioretention; Fertilizer education
Erosion control blankets; Hydro-seeding; Sediment traps; Grassed swales; Fertilizer education; Other EPSC practices and education
Vegetated buffers/wetlands;
Erosion control blankets; Hydro-seeding; Sediment traps; Grassed swales; Other EPSC practices and education
4
Bioretention
Agriculture
Forestry
Phosphorus BMP Options
5 and 9
5, 6, and 8
Golf courses / irrigation 1 and 7
Vegetated buffers/filter strips; Nutrient management plans
Vegetated buffers/filter strips; Sediment traps; Grassed swales; Other EPSC practices and education
Nutrient management plans; Assess silviculture activities; Vegetated buffers
Sediment traps; Grassed swales; Other EPSC practices and education
Vegetated buffers/wetlands; Nutrient management plans; Irrigation scheduling
Grassed swales; Nutrient management plans; Irrigation scheduling
For example, if nitrogen is determined to be the primary pollutant of concern from residential and urban development, then management strategies, such as the placement of vegetated buffers and constructed wetlands, or, on a smaller scale, rain gardens in the more urbanized area, may be implemented. Also, outreach workshops and mailings encouraging the proper use of fertilizers may be provided to the community. Similarly, if phosphorus is determined to be the primary pollutant of concern from construction, then sediment control measures may be implemented, as increased phosphorus concentrations can often be linked to sediment loading. Potential BMPs for phosphorus and sediment reduction include the installation of sediment traps, ponds, and/or grassed swales. Erosion protection and sediment control (EPSC) practices may be implemented as needed, and training workshops or education programs for the proper EPSC practices may be delivered, similar to Clemson’s successful Certified Erosion Prevention and Sediment Control Inspector (CEPSCI) program. Post-construction practices may include
10
the installation of porous pavers and bioretention areas to reduce stormwater inputs from impervious surfaces to Chapel Branch. Another Clemson Extension program, the Certified Stormwater Plan Reviewer (CSPR) course, is an educational opportunity that may be employed for training stormwater professionals and enhancing practice knowledge. Potential BMPs may not be limited to the examples provided above and in Table 2. Best management practice selection and installation will occur under the guidance of Clemson Extension with assistance from NRCS regarding guidelines and recommendations, as their workload permits. TMDL development for the watershed will assure that both nutrients will be reduced as necessary to the best of our project team and partners’ abilities to meet water quality standards as determined by SCDHEC. In short, the selection of the exact type of BMPs will depend on the identification of sources, the associated magnitude of nutrient loading, and, most importantly, the willingness of our partners to work with us to install or implement these strategies.
Conclusions Advantages and Disadvantages Chapel Branch Creek provides an example of the challenges of TMDL development and implementation. This small un-gauged watershed has very little data available for load estimation. A TMDL developed from literature loading values and an un-calibrated hydrologic model will gain little acceptance from a diverse group of stakeholders that have already seen considerable controversy over sources of and remedies for contamination. The proposed course of action may avoid that possibility and has a separate group of advantages and disadvantages.
Advantages The Chapel Branch Creek TMDL project has attracted a significant group of stakeholders who have been willing to cooperate in several scoping and project development meetings. Many of these stakeholders have provided in-kind support that has made the project possible. The analytical laboratory will analyze all samples with the same methods and equipment used for statewide assessment that has been used to identify the problem and will be used to measure success. BMPs will be applied through adaptive implementation, based on the results of measures taken on the watershed. The entire group of stakeholders has participated in the project design. Several will also be involved with sample collection and modeling. This active involvement should also extend to willingness for BMP installations.
Disadvantages On-site sampling and modeling increases the cost of TMDL development considerably. It proved difficult to fit a competent sampling design within budget constraints of the 319 program, which requires minimum percentages going to sampling, education, and BMP implementation. On-site sampling also required an EPA-approved Quality Assurance Project Plan (QAPP). This 95-page, highly detailed document required nearly a month of intensive work by all PI’s prior to any field water quality sampling. Such unanticipated delays can result in slowed progress and a loss of momentum for project team members and stakeholders who are collectively focused on and working together toward water quality improvement for Lake Marion and the Town of Santee, SC. In conclusion, it is through the combination of field sampling and modeling to provide source priority for BMP selection, the educational efforts for the community about watersheds and nonpoint source pollution, and most importantly the active participation of all stakeholders the proposed TMDL is targeted to be achieved. Various pollution management practices and
11
related strategies will be the mechanisms by which we plan to reach our goal of reducing nutrient loads and subsequent concentrations in the Chapel Branch Creek watershed draining ultimately to Lake Marion.
Acknowledgements Initiation of this work has been made possible by a USDA Forest Service Agreement # 06-CO11330135 with the SC Department of Health and Environmental Control (DHEC) for the SC DHEC project # 4O with a Grant Agreement # EQ-7-514 for the US EPA 319 Grant # C 999462906. The authors would like to acknowedge the SC DHEC NPS Coordinator, Meredith Barkley for providing both useful comments for this paper and support for this project, and Watershed Manager, Andy Miller, for his continued support in this project. Thanks are also due to the project cooperators Larry McCord, Chip Davis, and Brian Lynch at Santee Cooper Analytical and Biological Services Laboratory, staff of the Town of Santee, Santee State Park, and Santee Golf Course Management. Other cooperators include the SC Department of Transportation (DOT), NRCS Orangeburg County and Orangeburg County Soil and Water Conservation District. We would also like to acknowledge the contributions of Andy Harrison, Hydro-Tech at Forest Service Charleston Unit and David Joyner, graduate student at College of Charleston for hydrologic instrumentation at the site.
References Amatya, D.M. and D.R. Hitchcock. 2007. Project Specific Final Quality Assurance Project Plan (QAPP) for the Watershed Characterization and TMDL Implementation for Chapel Branch Creek (Project Type II). Submitted to and approved by the SC DHEC QA Office, Columbia, SC. Amatya, D.M., T.M. Williams, D. R. Hitchcock, and N.E. Levine. 2005. Watershed Characterization and TMDL Implementation for Chapel Branch Creek (Project Type II). A proposal funded by the SC Department of Health and Environmental Control Project # 40 with a Grant Agreement # EQ-7-514 for the US EPA 319 Grant # C 9994629-06. Amatya, D.M., G.M. Chescheir, G.P. Fernandez, R.W. Skaggs, F. Birgand, and J.W. Gilliam. 2003. Lumped Parameter Models for Predicting Nitrogen Transport in Lower Coastal Plain Watersheds. Rep. #347, Water Resou. Res. Inst. of the University of North Carolina, Raleigh, NC, 118 p. Arnold, J.G., R. Srinivasan, R.S. Muttiah, and J.R. Williams. 1998. Large Area Hydrologic Modeling and Assessment, Part I. Model Development. J. of the Amer. Water Resou. Assoc. 34(1):73-89. Boman. B.J., M.V. Thomas. 2007. 5 Years of BMP implementation outreach in Florida. In Proc. Watershed Management To Meet Water Quality Standards and TMDL- Fourth TMDL Conference, pp:350-357. American Society of Agricultural and Biological Engineers. St Joseph MI. DiLuzio, M., R. Srinivasan, and J.G. Arnold. 2002. Integration of watershed tools and SWAT model into BASINS. J of American Water Resources Association 38(4):1127-1141. Miller, A. 2004. Personal Communications, SC Department of Health and Environmental Control, Bureau of Water, Columbia, SC. NC DENR 2003. Total Maximum Daily Load (TMDL) for Total Phosphorus for Roberson (Robeson) Creek on Cape Fear River Basin, NC. Final Report approved January 2004, NC Department of Environment and Natural Resources, Division of Water Quality, Water Quality Section, 1617 Mail Service Center, Raleigh, NC 27699-1617
12
Reckhow, K. 2007. Adaptive Implementation – Executive summary. In Proc. Watershed Management To Meet Water Quality Standards and TMDL- Fourth TMDL Conference, pp:15-17. American Society of Agricultural and Biological Engineers. St Joseph MI. Santhi, C., J.G. Arnold, J.R. Williams, W.A. Dugas, and L.M. Hauck. 2002a. Application of a watershed model to evaluate management effects on point and nonpoint source pollution. Trans of the ASAE 44(6):1559-1570. Santhi, C. J.R. Williams, W.A. Dugas, J.G. Arnold, R. Srinivasan, and L.M. Hauck. 2002b. Water Quality Modeling of Bosque River Watershed to support TMDL Analysis. In Proc of the 1st TMDL Conference “ TMDL Environmental Regulations”, pp:33-43, March 11-13, 2002, Ft. Worth, TX, ASAE Pub. No. 701P0102, ed. A. Saleh. Santhi , C, J.G. Arnold, J.R. Williams, W.A. Dugas, R. Srinivasan, and L.M. Hauck. 2001. Validation of the SWAT model on a large river basin with point and nonpoint sources. J. American Water Resources Association 37(5):1169-1188. SC DOT. 2004. Personal Communications (Engineer Mr. Ray Vaughan), South Carolina Department of Transportation, Columbia, SC. SCS. 1988. Soil Survey Report of Orangeburg County, SC. State Conservationist Office, Columbia, SC. SC DHEC. 2000. Watershed Management Plan for Santee River Basin. South Carolina Department of Health and Environmental Control (SC DHEC), Environmental Quality Control, 2600 Bull St., Columbia, SC. SCDHEC. 1998. Implementation plan for achieving Total Maximum daily Load reductions from non-point sources for the State of South Carolina. Plan submitted to EPA in Sept. 1998. SC Department of Health and Environmental Control , Columbia SC Available Online at http://www.scdhec.net/environment/water/npsplan.htm accessed 4/5/2007. Van Liew, M.W. and J. Garbrecht. 2003. Hydrologic Simulation of the Little Washita River Experimental Watershed Using SWAT. J of American Water Resources Association 39(2):413-426.
13