water Article
Integrating Topography and Soil Properties for Spatial Soil Moisture Storage Modeling Xiaohua Xiang 1 , Xiaoling Wu 1 , Xi Chen 1,2, *, Qifeng Song 1,2 and Xianwu Xue 3,4 1 2 3 4
*
College of Hydrology and Water Resources, Hohai University, Nanjing 210098, China;
[email protected] (X.X.);
[email protected] (X.W.);
[email protected] (Q.S.) State Key Laboratory of Hydrology-Water Resources and Hydraulic Engineering, Hohai University, Nanjing 210098, China School of Civil Engineering and Environmental Sciences, University of Oklahoma, Norman, OK 73019, USA;
[email protected] Advanced Radar Research Center, National Weather Center, Norman, OK 73019, USA Correspondence:
[email protected]; Tel.: +86-25-8378-6981
Received: 14 July 2017; Accepted: 24 August 2017; Published: 30 August 2017
Abstract: The understanding of the temporal and spatial dynamics of soil moisture and hydraulic property of soil is crucial to the study of hydrological and ecological processes. The purpose of this study was to derive equations that describe spatial soil water storage deficit based on topography and soil properties. This storage deficit together with the topographical index can be used to conclude the spatial distribution curve of storage capacity in a (sub-) basin for developing hydrological model. The established model was able to match spatial and temporal variations of water balance components (i.e., soil moisture content (SMC), evapotranspiration, and runoff) over the Ziluoshan basin. Explicit expression of the soil moisture storage capacity (SMSC) in the model reduced parameters, which provides a method for hydrological simulation in ungauged basins. Keywords: soil moisture storage; van Genuchten model; distributed model; Xin’anjiang model; TOPMODEL
1. Introduction The understanding of the temporal and spatial dynamics of soil moisture and hydraulic property is crucial to the study of several hydrological and ecological processes. Soil moisture is a key variable in hydrological modeling. As McNamara et al. [1] pointed out that understanding soil storage and its role in regulating catchment functions should be a priority in future observation strategies and hydrological modelling. Soil moisture and hydrological routing is computed based on the saturated and unsaturated flow equations, which can be solved by finite element or difference techniques over a three dimensional grid. These models include System Hydrological European model (SHE) [2,3] and Institute of Hydrology Distributed Model (IHDM) [4,5]. While the advantages of pure, numerical simulation would seem clear, the tremendous amount of parameter evaluation required is problematic. In most cases the available data motivates the use of simple, conceptual model approaches rather than the use of a fully distributed, physically model with a large number of model parameters [6]. It is widely recognized that for saturation excess overland flow, soil storage is one of the key elements controlling runoff production in catchments in humid temperate areas. For traditionally lumped hydrological models, soil moisture is usually computed on the basis of basin average routing of unsaturated water balance, and its spatial variation is expressed in an empirical distribution curve of soil moisture storage capacity, e.g., a single parabolic curve in Xin’anjiang hydrological model [7]. The model usually lacks physical expressions and distribution functions of the hydrological processes or parameters, which solely calibrated based on observed flow discharge. Water 2017, 9, 647; doi:10.3390/w9090647
www.mdpi.com/journal/water
Water 2017, 9, 647
Water 2017, 9, 647
2 of 17
2 of 15
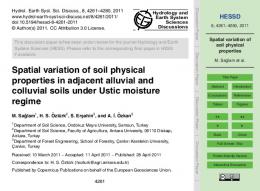
The model usually lacks physical expressions and distribution functions of the hydrological processes or parameters, which solely calibrated based on observed flow discharge. The semi-distributed models capable overcome shortage empirical models since The semi-distributed models areare capable to to overcome shortage of of thethe empirical models since they they explicitly express watershed distribution of soil moisture storage using site-specificinformation information of explicitly express watershed distribution of soil moisture storage using site-specific of land surface features, properties andtopography. topography. For For example, example, the index [8][8] land surface features, e.g.,e.g., soilsoil properties and thetopographic topographic index is widely used to analytically describe such distribution of soil moisture and runoff generation [9]. is widely used to analytically describe such distribution of soil moisture and runoff generationIt[9]. is also also used hydrological models withwith a distributed function. Such as the as It is used for forimproving improvingthe theempirical empirical hydrological models a distributed function. Such Xin’anjiang model, the statistical curve of spatial distribution of storage capacity was directly derived the Xin’anjiang model, the statistical curve of spatial distribution of storage capacity was directly from TOPMODEL’s topographic index [10–12] and from catchment slopes [13] or the empirical shape derived from TOPMODEL’s topographic index [10–12] and from catchment slopes [13] or the empirical parameter B of the water storage capacity of the soil non-linearly was estimated in terms of the shape parameter B of the water storage capacity of the soil non-linearly was estimated in terms of characteristic land surface slope [14]. Some signal from the topography and soil type was used to the characteristic land surface slope [14]. Some signal from the topography and soil type was used to explain the soil moisture variation [15]. These models are benefit from a combination of reasonable explain the soil moisture variation [15]. These models are benefit from a combination of reasonable computation time and physically realistic hillslope simulation. computation timedescription and physically realisticcapacity hillslopefor simulation. Explicitly of storage computation of hydrological fluxes remains Explicitly description of storage capacity for computation of rock hydrological fluxes remains challenge challenge as it relates to topography, soil, vegetation and base variations. In the mountainous as areas, it relates to topography, soil, vegetation and base rock variations. In the mountainous areas, topography controls depth to groundwater table and thus distribution of soil moisture deficit. topography controls depth to near groundwater table and thus will distribution soil moisture deficit.with In the In the hilly lowland areas, stream saturated zones be most of extensive in locations hilly lowland areas, near stream saturated zones will be most extensive in locations with concave concave hillslope profiles and wide flat valleys (Figure 1). The storage deficit in the unsaturated zone hillslope profiles flat valleys (Figure 1). Thebecause storage the deficit in the unsaturated zone becomes becomes small and and wide the runoff is easily generated unsaturated zone for holding soil moisture is reduced to generated the high groundwater occupation low active soil depth of the is small and the runoff isdue easily because the table unsaturated zoneorfor holding moisture unsaturated [12].groundwater table occupation or low active depth of the unsaturated zone [12]. reduced due tozone the high
Figure Sketchofofvertical vertical profile profile of soil (D) atataaspecific along Figure 1. 1.Sketch soil moisture moisturedeficit deficitWm Wm(D) specificsite site(a)(a)and and along hillslope (b). hillslope (b).
The available space for moisture storage in unsaturated zone depends on not only the active The available space for moisture storage in unsaturated zone depends on not only the active depth but also the rise of the capillary fringe (Figure 1). Surface tension and soil pore capillary force depth but also the rise of the capillary fringe (Figure 1). Surface tension and soil pore capillary force lead the groundwater rise up into the soil and form a capillary fringe with a certain thickness [16], lead the groundwater rise up into the soil and form a capillary fringe with a certain thickness [16], which significantly decreases soil moisture deficit. The capillary rise is associated with physical which significantly decreases soil moisture deficit. rise is associated properties of soil porosity and particle diameter. ForThe clay,capillary where capillary is strong, a with waterphysical table properties of soil porosity and particle diameter. For clay, where capillary is strong, a water depth depth of 10 m can still be “felt” in the root zone and near surface. For sand, the water table table has little of role 10 mascan still be “felt” in the root zone and near surface. For sand, the water table has little role as a a source if it is below the root zone [17]. It is found that low runoff potential for soils having source if itrise is below root zone [17]. It as is found that deep low runoff potential for soils the low the low of the the capillary fringe, such deep sand, loess, aggregated silts, andhaving high runoff rise of the capillary fringe, such as deep sand, deep loess, aggregated silts, and high runoff potential potential for soils having the high rise of the capillary fringe, such as heavy plastic clays, and certain forsaline soils soils having [18].the high rise of the capillary fringe, such as heavy plastic clays, and certain saline soils [18]. The main objective of this study is to derive equations for description of the spatial soil storage capacity that can make of usethis of topography soil equations property infor thedescription humid hillyofwatershed. Thesoil The main objective study is toand derive the spatial storage capacity that can make use of topography and soil property in the humid hilly watershed. The equations were derived by combining the van Genuchten model of water retention relationship [19]
Water 2017, 9, 647
3 of 15
Water 2017, 9, 647
3 of 17
and the TOPMODEL topographic index. They can be used to describe the site specific soil storage equations were derived by combining the van Genuchten model of water retention relationship [19] capacity and its statistical feature in a (sub-) basin, thus to simulate spatial distribution of hydrological and the TOPMODEL topographic index. They can be used to describe the site specific soil storage variables of runoff amount, evaporation and soil water storage. The model was tested on Ziluoshan capacity and its statistical feature in a (sub-) basin, thus to simulate spatial distribution of basinhydrological of Huai River watershed in the humid region in and China. variables of runoff amount, evaporation soil water storage. The model was tested on Ziluoshan basin of Huai River watershed in the humid region in China.
2. Materials and Methods
2. Materials and Methods
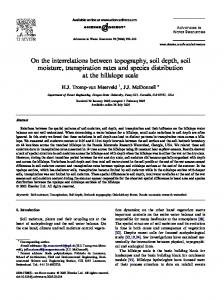
2.1. Description of Ziluoshan Basin 2.1. one Description Ziluoshan Basin in the upstream of Huai River, Shaying River originated in the As of theoffirst tributaries As one of the first the upstream of Huai River, 2). Shaying River originated the the western mountainous areatributaries of Henaninprovince of China (Figure The watershed area in above 2 , and western mountainousstation area ofonHenan province (Figure 2).the The watershed area above the for Ziluoshan hydrological Shaying Riverof is China 1800 km mountainous area accounts hydrologicaland station on Shaying River is 1800 km2, and the mountainous accounts for 75%. Ziluoshan These geographical climatic features result in extremely uneven of the area annual and seasonal 75%. These geographical and climatic features result in extremely uneven of the annual and seasonal distributions of rainfall. The annual precipitation during 1980–1996 is 900 mm, varying from the distributions of rainfall. The annual precipitation during 1980–1996 is 900 mm, varying from the largest in the southeast to the smallest in the north. Most of annual precipitation is concentrated in the largest in the southeast to the smallest in the north. Most of annual precipitation is concentrated in flood seasons (June–September). Nearly 60–70% of the total precipitation occurs in the months of June the flood seasons (June–September). Nearly 60–70% of the total precipitation occurs in the months of and August. June and August. DEMDEM datadata of 30ofm30grid resolution are used to describe the spatial variations of topography [20,21]. m grid resolution are used to describe the spatial variations of topography Based[20,21]. on theBased geographical map, the terrain of terrain the catchment tilts from southwest to northeast (Figure 2). on the geographical map, the of the catchment tilts from southwest to northeast (Figureelevation 2). The mean elevation of topography 820 m, varying from m above the mean levelin the The mean of topography is 820 m, is varying from 284 m284 above the mean seasea level in the downstream region to over 2122 m in the upstream mountainous areas. The topographic index downstream region to over 2122 m in the upstream mountainous areas. The topographic index in each each pixel was using calculated using the DTM9704 pixelin was calculated the DTM9704 programprogram [22,23].[22,23].
Figure Locationand and topography topography ininZiluoshan basin. Figure 2. 2.Location Ziluoshan basin.
Soil in the basin is primarily shallow eluvial-slope deposits consisting of sand, loam and clay
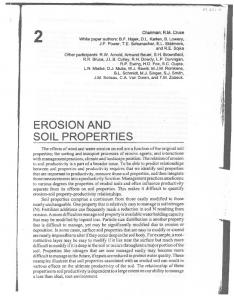
Soil in the basin is primarily shallow eluvial-slope deposits consisting of sand, loam and clay (Data Center for Resources and Environmental Sciences Chinese Academy of Sciences (RESDC)). (DataPercentage Center for Resources and Environmental Academy of Sciences (RESDC)). of sand and clay within the soil depth Sciences of 0–1.0 mChinese ranges 5.3–83.0% for sand, 1.7–31.6% for Percentage of sand andthe clay within the m ranges 5.3–83.0% clay (Figure 3), and remaining for soil loam.depth Valueofof0–1.0 the hydraulic parameters forfor thesand, three 1.7–31.6% soils for clay (Figure 3), [24] and(Table the remaining forvalues loam.ofValue of the hydraulic parameters forpixel the three refers to Tuller 1). The mean soil hydraulic parameters of VG in each were soils proportion-weighted arithmetic way, and the field capacityof θf was determined as were refersestimated to Tullerby [24] (Table 1). The mean valuesmean of soil hydraulic parameters VG in each pixel estimated by proportion-weighted arithmetic mean way, and the field capacity θ f was determined as a fraction of the saturated SMC (75% in this study [25]). The vegetation in the study region is primarily
Water 2017, 9, 647 Water 2017, 9, 647
4 of 15 4 of 17
a fractionbroadleaf of the saturated SMCmixed (75% inforest. this study Thevegetation vegetation coverage in the study region than is primarily deciduous forest and The [25]). average is larger 75% [26] broadleaf forest and mixed forest. The average vegetation larger anddeciduous average annual Normalized Difference Vegetation Index (NDVI)coverage is largeristhan 0.6than [27].75% [26] and average annual Normalized Difference Vegetation Index (NDVI) is larger than 0.6 [27]. Table 1. Van Genuchten parameters for three types of soil [24]. Table 1. Van Genuchten parameters for three types of soil [24]. Parameter Parameter θθs s θθr r (cm−1−1 ) ) αα(cm n n
Sand Sand 0.37 0.37 0.058 0.058 0.035 0.035 3.19 3.19
Loam Loam 0.46 0.46 0.083 0.083 0.025 0.025 1.31 1.31
Clay Clay 0.51 0.51 0.102 0.102 0.021 0.021 1.2 1.2
Figure Percentageof ofsand sand and and clay depth of of 0–1.0 m, (a) of sand and (b) Figure 3. 3. Percentage clay within withinthe thesoil soil depth 0–1.0 m, Percentage (a) Percentage of sand and Percentage of clay. (b) Percentage of clay.
The watershed was divided into a number of sub-basins (e.g., 50 sub-basins in this study) for The watershed was divided into a number of sub-basins (e.g., 50 sub-basins in this study) describing spatial variations of runoff generation and river flow routing (Figure. 4). Each sub-basin for describing spatial variations of runoff generation and river flow routing (Figure 4). Each sub-basin includes lots of pixels in 30 m grid resolution. includes lots of pixels in 30 m grid resolution. 2.2. Outline of the Model 2.2. Outline of the Model The soil moisture storage model was firstly introduced at site scale, and then extended to The soilsoil moisture storage model was(SMSC) firstly introduced at TOPMODEL site scale, andconcept. then extended hillslope hillslope moisture storage capacity according to Finally,to a spatial soilsoil moisture storage capacity accordingby to all TOPMODEL Finally, away spatial soil moisture moisture storage curve(SMSC) was concluded sites SMSCconcept. in a statistical to replace the storage curve was concluded by all sites SMSC in a statistical way to replace the traditional statistical traditional statistical curve in Xin’anjiang model. The detail procedure is given blow. curve in Xin’anjiang model. The detail procedure is given blow. 2.2.1. The role of Soil Moisture Storage on Hydrological Fluxes 2.2.1. The Role of Soil Moisture Storage on Hydrological Fluxes Hydrological balance on any element can be expressed as following: Hydrological balance on any element can be expressed as following: Wt Wt 1 Pt Et Rt (1) Wt − Wt−1 = Pt − Et − Rt (1) where Wt 1 and Wt is soil moisture storage at the time interval of t−1 and t, Pt, Et and Rt is
where Wt−1 andactual Wt isevapotranspiration soil moisture storage at the interval of of t− andt,t,respectively. Pt , Et and Rt is precipitation, and runoff at time the time interval t−11 and In Equation computation of both evapotranspiration E and R depends on soil precipitation, actual(1), evapotranspiration andactual runoff at the time interval of t runoff − 1 and t, respectively. storage W (SMC(1), in computation this model) and capacity (SMSC in this model), for saturation In Equation of its both actualWm evapotranspiration E ande.g., runoff R dependsexcess on soil storage W (SMC in this model) and its capacity Wm (SMSC in this model), e.g., for saturation excess
Water 2017, 9, 647
5 of 15
overland flow, runoff is generated as the soil storage reaches the capacity, which can be expressed as following: ( Wt−1 + Pet − Wm Wt−1 + Pet − Wm > 0 Rt = (2) 0 Wt−1 + Pet − Wm ≤ 0 where Pe is net rainfall. For distributed modeling or physical description of spatial variation function of watershed characteristics on hydrological fluxes, expression of soil spatial variation storage and its capacity in a watershed is vital. 2.2.2. Site Specific Soil Moisture Storage Capacity SMSC is usually defined as the difference between the water content at field capacity and at residual multiplied by a critical depth in unsaturated zone for moisture storage and runoff generation. In humid regions, the critical depth can be regarded as unsaturated zone thickness or the depth to free water table if there is a free water table in the soil profile. In this case, vertical water content in the critical depth can be influenced by the free water table under the capillary flux from the free water to soil moisture column (Figure 1a), which results in that soil moisture seldom reach the residual water content on the groundwater table nearby. Thus, the soil moisture profile above the water table can be determined from the balance between the pressure head gradient, which tends to draw moisture up, and gravity [28]. The soil-water pressure head distribution, ψ(z), may be modeled using Darcy’s law: q = K (ψ)( or z=
∂ψ − 1) ∂z
(3)
Z ψ K (ψ)dψ 0
(4)
K (ψ) + q
where q is the steady state evaporation rate, K (ψ) is the unsaturated hydraulic conductivity function, ψ is the pressure head (m). Soil moisture with depth can be described by the van Genuchten model (hereafter VG) of water retention relationship [19,29]: 1
1+ n 1 θ (ψ) = θr + (θs − θr )( n) 1 + (αψ)
ψ