RESEARCH ARTICLES
Spatial variability of soil properties and its application in predicting surface map of hydraulic parameters in an agricultural farm Priyabrata Santra*, U. K. Chopra and Debashis Chakraborty Division of Agricultural Physics, Indian Agricultural Research Institute, New Delhi 110 012, India
Knowledge of spatial variation of soil properties is important in precision farming and environmental modelling. Spatial distribution of water content at field capacity (FC) and permanent wilting point (PWP) at different zones of a farm governs the available water for plant growth. These two soil hydraulic parameters play key roles in crop selection for different blocks of a farm, and in scheduling irrigation of crops in a field. In this study, spatial variation of bulk density organic carbon, silt and clay contents for two soil depths (0–15 and 15–30 cm) in the agricultural farm of the Indian Agricultural Research Institute, New Delhi were quantified and the respective surface maps were prepared through ordinary kriging. Particle size distribution shows better spatial correlation structure than bulk density and organic carbon content. Gaussian model fits well with experimental semivariogram of bulk density, and silt and clay contents. Hole-effect model was found to be the best to fit the experimental semivariogram of organic carbon content. Spatial correlation structure for both surface (0–15 cm) and subsurface (15–30 cm) soil layer remains the same, but the magnitude of spatial correlation differs. Crossvalidation of the kriged map shows that spatial prediction of basic soil properties using semivariogram parameters is better than assuming mean of observed value for any unsampled location. Pedo-transfer functions were coupled with the surface map of basic soil properties to generate a map of water content at FC and PWP. Evaluation of spatial maps of θFC and θPWP showed reasonable accuracy of these two hydraulic parameters for farm-level or regional-scale application. Keywords: Basic soil properties, ordinary kriging, pedotransfer functions, semivariogram. SOILS are characterized by high degree of spatial variability due to the combined effect of physical, chemical or biological processes that operate with different intensities and at different scales1. Knowledge of the spatial variation of soil properties is important in several disciplines, including agricultural field trial research and precision
*For correspondence. (e-mail:
[email protected]) CURRENT SCIENCE, VOL. 95, NO. 7, 10 OCTOBER 2008
farming. Reports have shown that there is large variability in soil, crop, disease, weed and/or yield, not only in large-sized fields2–5, but also in small-sized fields6. In precision farming, the concept of ‘management zone’ was evolved in response to this large variability with the main purpose in efficient utilization of agricultural inputs with respect to spatial variation of soils and its properties7–9. Moreover, use of simulation models in designing and testing of different land-use management options in agricultural farms increased substantially in the last few decades10. Therefore, an appropriate understanding of spatial variation of soil properties is essential for modelling at landscape scale. The most important way to gather knowledge in this aspect is to prepare soil maps through spatial interpolation of point-based measurements of soil properties. Among different methods of spatial interpolation of soil properties, inverse distance weighing and ordinary kriging are most common11,12. From a theoretical standpoint, kriging is the optimal interpolation method13; however, its correct application requires an accurate determination of the spatial structure via semivariogram construction and model-fitting. At least 50 to 100 samples might be required to obtain a reliable semivariogram that correctly describes spatial structure14. Most of the studies showed the spatial variation of soil properties in plot or field scale (1.59 Mg m–3) at the surface, but lower at the subsurface than other parts of the farm (Figure 3 a). For the northwestern part of the farm, bulk density is 1.47–1.52 Mg m–3 at the surface and CURRENT SCIENCE, VOL. 95, NO. 7, 10 OCTOBER 2008
RESEARCH ARTICLES Table 4.
Evaluation performance of krigged map of soil physical properties through crossvalidation
Soil property
Depth (cm)
MAE
MSE
G
Bulk density (Mg m–3)
0–15 15–30
0.074 0.053
0.008 0.005
–7.16 18.90
Organic carbon content (%)
0–15 15–30
0.177 0.132
0.043 0.032
6.44 –18.09
ln (% silt content)
0–15 15–30
0.175 0.229
0.051 0.084
29.21 10.37
Clay content (%)
0–15 15–30
3.761 4.490
27.609 34.467
–1.51 18.96
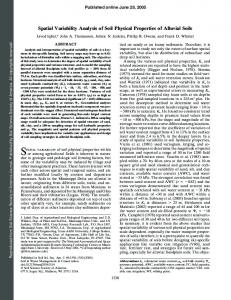
Figure 4. Krigged maps of soil properties for 15–30 cm soil depth. (a) Bulk density (Mg m–3), (b) Organic carbon content (%), (c) Silt content (%), and (d) Clay content (%).
>1.67 Mg m–3 at the subsurface. This shows the presence of compacted subsurface layer in the northwestern part of the farm, possible due to continuous rice cultivation in these areas. Increase in bulk density in the east-to-west direction was also observed. Except for the southern part of the farm, a general trend of increase in bulk density with depth was observed. Spatial map of organic carbon content (0–15 cm) shows that 80% of the farm has medium organic carbon content (0.5–0.75%) and some patches of organic carbon content were also observed from the map (Figure 3 b). For the subsurface layer (Figure 4 b), the same pattern was followed with organic carbon content in low category (