Hindawi Journal of Food Quality Volume 2018, Article ID 3487985, 11 pages https://doi.org/10.1155/2018/3487985
Research Article Integration of Artificial Neural Network Modeling and Hyperspectral Data Preprocessing for Discrimination of Colla Corii Asini Adulteration Huihui Wang ,1,2 Kunlun Wang,1,2 Biyao Wang,1,2 Yan Lv,1,2 Xueheng Tao ,1,2 Xu Zhang ,1,2 and Mingqian Tan 1,3 1
National Engineering Research Center of Seafood, Dalian, Liaoning 116034, China School of Mechanical Engineering and Automation, Dalian Polytechnic University, Qinggongyuan 1, Ganjingzi, Dalian, Liaoning 116034, China 3 School of Food Science and Technology, Dalian Polytechnic University, Qinggongyuan 1, Ganjingzi, Dalian, Liaoning 116034, China 2
Correspondence should be addressed to Huihui Wang;
[email protected] and Mingqian Tan;
[email protected] Received 2 February 2018; Accepted 21 March 2018; Published 8 May 2018 Academic Editor: Maria Lepore Copyright © 2018 Huihui Wang et al. This is an open access article distributed under the Creative Commons Attribution License, which permits unrestricted use, distribution, and reproduction in any medium, provided the original work is properly cited. The study of hyperspectral imaging in tandem with spectral preprocessing and neural network techniques was conducted to realize Colla Corii Asini (CCA, E’jiao) adulteration discrimination. CCA was adulterated with pig skin gelatin (PSG) in the range of 5–95% (w/w) at 5% increments. Three methods were used to pretreat the original spectra, which are multiplicative scatter correction (MSC), Savitzky-Golay (SG) smoothing, and the combination of MSC and SG (MSC-SG). SPA was employed to select the characteristic wavelengths (CWs) to reduce the high dimension. Colour and texture features of CWs were extracted as input of prediction model. Two kinds of artificial neural network (ANN) with three spectral preprocessing methods were applied to establish the prediction models. The prediction model of generalized regression neural network (GRNN) in tandem with the MSC-SG preprocessed method presented satisfactory performance with the correct classification rate value of 92.5%. The results illustrated that the integration of preprocessing methods, hyperspectral imaging features, and ANN modeling had a great potential and feasibility for CCA adulteration discrimination.
1. Introduction Colla Corii Asini (CCA, E’jiao), a gelatin-like preparation derived from stewing and concentrating material from donkey hide, is a health-care food and one of the well-known traditional Chinese medicines [1]. It was reported that several main components have been isolated from CCA, including amino acids, proteins/gelatins, polysaccharides, volatile substances, and organic substances [2]. Due to its stimulating effect in hematopoiesis, CCA has been widely used in dietetic life-nourishing and clinical antianemic therapy for over two thousand years [3]. CCA is made of dry skin derived from donkeys which is specified in the Chinese Pharmacopoeia and in the non-JP crude drug standards [4]. Because of the complex preparation and raw material shortage, pigskin gelatin has been illegally
added to CCA. As a kind of traditional food, authenticity of CCA is usually identified by its external properties; however, it needs rich personal experience and professional knowledge. Nowadays, some physical and chemical inspection methods were used to discriminate adulteration in food like meat [5, 6], oil [7, 8], honey [9, 10], milk [11, 12], and so on. As for CCA, polymerase chain reaction method has been reported [4]. In spite of their feasibility in the authentication of CCA, these methods are too complicated and timeconsuming. Therefore, establishment of a fast and objective identified method for CCA is required, followed by a quantitative prediction of gelatin adding, if necessary. Recently, some researchers have paid much attention to spectroscopy for authentication of food [13, 14], but these techniques cannot provide visual and spectral information of whole samples simultaneously. Hyperspectral technique
2
Journal of Food Quality Pre-treatment
Sample preparation
0.5
Texture
Reflectance (%)
0.4
MSC PSK
+
Image feature extracting
0.3 0.2
Color
0.1 0.0
CCA
0.6
300 400 500 600 700 800 900 1000 1100 Wavelength (nm)
Reflectance (%)
0.5
SG
Data acquisition
0.4 0.3 0.2 0.1 0.0
0.5
300 400 500 600 700 800 900 1000 1100 Wavelength (nm)
Prediction modeling
SG-MSC
Reflectance (%)
0.4 0.3 0.2 0.1 0.0
ROI
400
500
600 700 800 900 1000 Wavelength (nm)
Dimension reduction 0.4 0.14 0.5
0.3
0.12 0.4
GRNN/PNN, GRNN/PNN + MSC, GRNN/PNN + SG
0.1
Reflectance
0.10
0.2 RMSE
Reflectivity
0.5
0.08 0.06
0.3
0.2
0.04
0.0
0.1 0.02
400 500 600 700 800 900 1000 wavelength (nm)
0.0
0.00 0
1
2
3
4
5
6
7
8
9
10
300
400
500
600
700
First calibration object
First calibration object
Selected wavelength number
Selected variables
800
900
1000
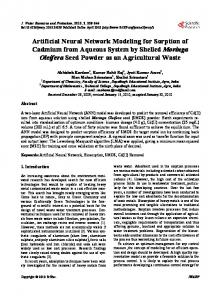
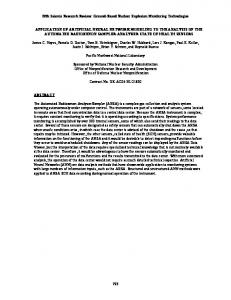
Figure 1: The key steps of measurement procedure.
combines two different pieces of information (spectroscopy and images), which can provide a detailed analysis as it contains spectra with spatial data. By obtaining the spectral data at every pixel in image, a hypercube including three-dimensional dataset (two-dimensional image and onedimensional spectral data) is created, which can be applied to estimate the changes of spectrum and reflect the physical and chemical characteristics of the samples [15]. Many researchers have investigated the potential of hyperspectral technique for the quality detection measurement of meat [16, 17], vegetables [18], fruit [19], and seafood [20]. As for food authenticity, it has been successfully applied in milk [21], muscle food [22], and oil [23]. In this study, with pig skin gelatin (PSG) adulterating as a specific example, a fast and noninvasion method based on hyperspectral technique was developed. This study was focused on (1) using different pretreatment of multiplicative scatter correction (MSC), Savitzky-Golay (SG) smoothing, and combination of MSC and SG (MSC-SG) to preprocess the spectral data of region of interest, (2) using the successive projections algorithm (SPA) to conduct data dimension reduction and acquire characteristic wavelengths (CWs) under different preprocessing methods, (3) extracting the image features of CWs to represent the physical and chemical characteristics of CCA, and (4) building prediction models of CCA adulteration and comparing the prediction ability of different models based on different spectral preprocessed methods.
2. Materials and Methods 2.1. Sample Preparation. The CCA was purchased from Tong Ren Tang Technologies Co. Ltd., whose production method is in terms of the company standard (Q/TX TRT0001). The PSG was obtained from Boyang Gelatin Co. Ltd. (Henan, China). Then, CCA samples were added with PSG in the range of 5–95% (w/w) at 5% increments. In order to obtain homogeneous mixing samples, certain amounts of CCA and PSG
were dissolved in deionized water and heated at 90∘ C in a water bath for 30 minutes. Then, the samples were frozen in refrigerator (−80∘ C) for 2 hours and then transferred to a vacuum freeze-dryer (FD-1-50, Boyikang, Beijing, China) for 5 days. Subsequently, the samples were milled by a food pulverizer (MDJ-A01Y1, Bear, Foshan, China) and obtained from sieves of 40-mesh sizes for further hyperspectral data acquiring. The key steps of measurement procedure were illustrated in Figure 1. 2.2. Hyperspectral Data Acquisition. Hyperspectral data of samples was acquired using a line-scanning hyperspectral imaging system based on reflectance mode. The system (Sichuan Dualix Spectral Image Technology Co. Ltd., GaiaField-V10E) consists of a spectrograph with spectral resolution of 2.8 nm, a cooled charge-coupled device (CCD) camera, four 200 W bromine-tungsten lamps, an electrical mobile platform driven by a stepper motor, and a computer installed with system controlled software. The system collects information on the spectral range of 388–1045 nm, which is able to cover the visible (VIS) and partial near infrared (NIR) band. Each acquired dataset was stored as a three-dimensional data cube (𝑥, 𝑦, 𝜆), the image dimensions (𝑥, 𝑦) included 1392 × 3023 pixels, and the spectral dimensions (𝜆) included 1040 bands. Through experimental optimization, the exposure time was set at 17 ms, the object distance was set at 185 mm, the spectral sampling point was set at 0.65 nm, and the movement speed of the object stage was set at 1.5 mm/s. Because of the influence of the samples differences, the dark current in the CCD camera, and the uneven intensity of the illumination in different bands, the hyperspectral dataset acquired from the system was first calibrated by using a white and dark reference image. The white reference image with nearly 100% reflectance was acquired using a uniform Teflon board (Sichuan Dualix Spectral Image Technology Co., Ltd.) under the same condition of the raw hyperspectral data. The dark reference image with nearly 0% reflectance was acquired by turning off all the lamps and covering the lens of the
Journal of Food Quality
3
camera with a black cap. The calibration was conducted using the following equation [24]: 𝐼 (𝜆) =
𝐼sample (𝜆) − 𝐼dark (𝜆) 𝐼white (𝜆) − 𝐼dark (𝜆)
,
(1)
where 𝐼(𝜆), 𝐼sample (𝜆), 𝐼white (𝜆), and 𝐼dark (𝜆) are the calibrated image, the acquired original image, the white reference image, and the dark reference image, respectively. The calibrated images 𝐼(𝜆) were employed for further image processing and analysis. The calibration was performed using the system controlled software in the computer. The region of interest (ROI) was obtained from the calibrated images using ENVI software (ENVI 5.0, Research System Inc., USA). An ROI holding approximately 400 × 400 pixels2 of the square area was manually selected in the center of each sample, and the mean spectra (388–1045 nm) of ROI for 200 samples were calculated by ENVI. 2.3. Spectral Preprocessing. In order to reduce or remove undesired physical effect such as light scattering and random noise caused by instruments or variable physical sample properties, the average reflectance spectrum (ARS) should be preprocessed. In this study, MSC, SG smoothing, and MSCSG were individually used. MSC method is effectively used in spectroscopic applications where light scattering variation and multiplicative noise were present [25, 26]. SG smoothing were widely used in removing noise of baseline excursion and smoothing spectra [27, 28]. For SG smoothing, a window width of 7 points was applied. The preprocessed spectra were used for CWs selecting, respectively. The performances of MSC, SG, and MSC-SG were compared by modeling results. All of these pretreatments were carried out using the Matlab 2009a (The Math Works Inc., USA). 2.4. Extraction of Image Features. The colour and texture features were extracted from hyperspectral images at CWs. In this study, the colour feature was determined as average gray level (AGL) of ROI, which was calculated using the following formula: AGL =
∑ gray (𝑥, 𝑦) , area
(2)
where 𝑥 is the column number of image; 𝑦 is the row number of image; gray (𝑥, 𝑦) denotes the gray level of the pixel of ROI; area denotes the number of total pixels of ROI. Gray level cooccurrence matrix (GLCM) is a commonly used method for texture analysis, in which the texture features are extracted through statistical calculation. In this study, texture extraction based on GLCM was carried out according to the methods described by hyperspectral image researches with slight modification [29, 30]. GLCM was constructed with four different angles (0∘ , 45∘ , 90∘ , and 135∘ ), in which the distance between pixel pairs was set as 1 pixel. Four texture features were calculated including contrast (CON), energy (ENE), correlation (COR), and inverse difference moment (IDM), where CON mainly describes strongly different spectral responses, ENE mainly describes textural uniformity, that is,
pixel pairs repetitions, COR mainly describes linear-dependencies relationship of gray level, IDM mainly describes image homogeneity, and the larger values imply smaller differences of gray level in pair elements [31]. The texture features were calculated according to the following formulas [31, 32]: 𝑀 𝑁
2
CON = ∑ ∑ (𝑖 − 𝑗) 𝑝 (𝑖, 𝑗) 𝑖=0 𝑗=0 𝑀 𝑁
ENE = ∑ ∑𝑝 (𝑖, 𝑗) 𝑖=0 𝑗=0 𝑀 𝑁
(𝑖 − 𝛼) (𝑗 − 𝛼) 𝑝 (𝑖, 𝑗) 𝛽2 𝑖=0 𝑗=0
COR = ∑ ∑ 𝑀 𝑁
𝑝 (𝑖, 𝑗)
𝑖=0 𝑗=0 1
+ (𝑖 − 𝑗)
IDM = ∑ ∑
(3)
2
𝑀 𝑁
𝛼 = ∑ ∑𝑖 ⋅ 𝑝 (𝑖, 𝑗) 𝑖=0 𝑗=0 𝑀 𝑁
𝛽2 = ∑ ∑ (𝑖 − 𝛼)2 𝑝 (𝑖, 𝑗) , 𝑖=0 𝑗=0
where 𝑝(𝑖, 𝑗) is the (𝑖, 𝑗)th entry in GLCM, 𝑀 is the column number of GLCM, and 𝑁 is the row number of GLCM. All of the extraction processing of image features was carried out using Matlab 2009a. 2.5. Model Development. Probabilistic neural network (PNN) and generalized regression neural network (GRNN) proposed by Specht are the two kinds of modified radial basis function (RBF) neural network [33, 34], which possess more advantages than RBF in some respects and are both widely used in hyperspectral data modeling for food [32, 35]. In this study, PNN and GRNN were employed to build prediction model for detecting of CCA adulteration, which were composed of the input layer, hidden layer, and output layer. The nodes number of input layer was determined by colour and textural features derived from hyperspectral images of the selected CWs. The hidden layer was determined by neural network self-adaptive process. The output layer was the adulterated ratio of PSG. The error of predicted adulteration rate (AR) less than 0.5% was considered accurate in this study. The deviation between prediction and calibration value at different AR for different models was determined by RMSE. To eliminate the different orders of magnitude and units, the input layer parameters were standardized using the 𝑍-scores transformation method [36]: 𝑥𝑖𝑗 − 𝜇𝑗 𝑥𝑖𝑗 = 𝜎𝑗 𝜇=
∑𝑛𝑖=1 𝑥𝑖𝑗
(4)
𝑛 2
𝜎𝑗 =
√ ∑𝑛𝑖=1 (𝑥𝑖𝑗 − 𝜇𝑗 ) 𝑛−1
,
4
Journal of Food Quality 0.5 0.6 0.4
0.4
Reflectance
Reflectance
0.5
0.3 0.2
0.3 0.2 0.1
0.1 0.0
0.0 400
500
600 700 800 Wavelength (nm)
900
1000
1100
400
500
(a)
0.5
0.5
0.4
Reflectance
0.4 Reflectance
900
1000
900
1000
(b)
0.6
0.3 0.2
0.3 0.2 0.1
0.1
0.0
0.0 400
600 700 800 Wavelength (nm)
500
600 700 800 Wavelength (nm)
900
1000
(c)
400
500
600 700 800 Wavelength (nm) (d)
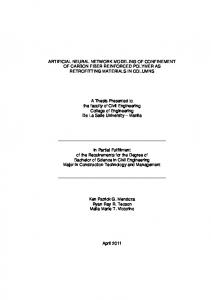
Figure 2: The original ARS (a) and pretreated ARS with MSC (b), SG (c), and MSC-SG (d).
where 𝑛 denotes the sample size; 𝑖 denotes the numbers of samples, 𝑖 = 1, 2, . . . ., 𝑛; 𝑗 denotes the numbers of input layer parameters; 𝑥𝑖𝑗 denotes the standardized input layer parameter; 𝑥𝑖𝑗 denotes the original value of input layer parameter; 𝜇𝑗 denotes the average of the 𝑗th input layer parameter; 𝜎𝑗 denotes the standard deviation of the 𝑗th input layer parameter.
3. Results and Discussion 3.1. ARS Analysis and Preprocessing. The properties of electromagnetic radiation could interact with different proportions of physicochemical materials existing in the adulterated CCA, resulting in some especial absorption characteristics at some specific wavelengths [25]. Each pixel of ROI acquired from hyperspectral image cube has plentiful spectral information [37]. The original and pretreated ARS of PSG adulteration from 5% to 95% were presented in Figure 2. As shown in Figure 2(a), the ARS of different PSG adulteration presented similar variation tendency, peak, and trough, which illustrated their similarity in physical and chemical properties [15]. Though different spectral curves presented similar
patterns, they displayed different absorbance intensity in the range of 388–1045 nm. It implied that the CCA with PSG adulteration has led to significant alterations to the physicochemical property, which can be measured by spectral information. Specifically, it was noticed that significant peaks and troughs were found at wavelengths of 600–700, 700–780, and 800–970 nm. The apparent absorption peaks at approximately 760 nm appeared on the ARS curves. The 700–780 nm region presented one obvious absorption peak particularly, which could be attributed to the O-H third overtones and CH forth overtones [38, 39]. Because too much noise existed in region of 388–400 nm and 1000–1045 nm in the original ARS and corrected images, the remaining region from 400 to 1000 nm was employed for further analysis. In order to correct spectral data, improve signal to noise ratio, and enhance the spectral resolution, the original ARS were preprocessed with the MSC, SG, and MSC-SG before CW selecting (Figures 2(b), 2(c), and 2(d)). It is apparent that the preprocessed ARS illustrated one more distinctive spectral shape than the spectra in Figure 2(a). Particularly, the ARS with MSC (Figure 2(b)) gathered in a narrow space compared to the original spectra (Figure 2(a)). However,
Journal of Food Quality
5
0.10
0.05 RMSE = 0.0420
RMSE = 0.0371
0.06 RMSE
RMSE
0.08
0.04
0.04
0.02 0.00
1 Number of wavelengths
0
0.03
2
0
Selected wavelength number
1
2
3
0.14
0.12
0.12
RMSE
RMSE
0.06
0.04
0.04
3
10
0.08
0.06
2
9
0.10
0.08
1
8
RMSE = 0.0426
RMSE = 0.0427
0
10
(b)
(a)
0.02
9
Selected wavelength number RMSE trend with increasing CW number
0.14
0.10
8
4 5 6 7 Number of wavelengths
4 5 6 7 Number of wavelengths
8
9
10
0.02
0
1
2
3
4 5 6 7 Number of wavelengths
Selected wavelength number RMSE trend with increasing CW number
Selected wavelength number RMSE trend with increasing CW number
(c)
(d)
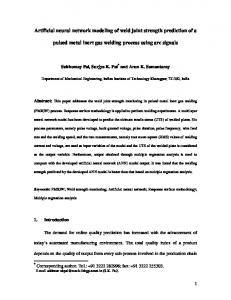
Figure 3: RMSE plot by SPA for no preprocessing (a), SG (b), MSC (c), and MSC-SG (d).
there is still much noise in the region of 400–490 nm and 790–1000 nm after MSC. It can be seen that the spectra after SG smoothing have better denoising effect than original ones and MSC. However, there was no apparent change on waveform. Based on the above results, the combined method using MSC and SG in turn was applied. The ARS with MSC-SG (Figure 2(d)) illustrated that the combined method can decrease the noises as well as correct scatter effects, respectively. The impact of preprocessing (MSC, SG, and MSC-SG) was compared by further modeling results analysis. 3.2. CWs Selection by SPA. SPA method was employed to select the CWs from the full spectra, which was performed according to the transition value of RMSE [40]. By SPA, RMSE trend with the increasing CW number was illustrated in Figure 3 using the solid black curve which corresponded to different preprocessing methods. According to the RMSE
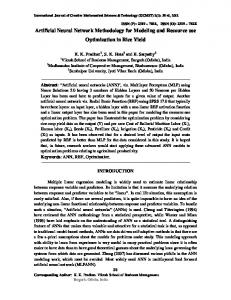
plot, the selected number of CWs was determined by the point corresponding to the values of RMSE tending to be stable. The ordinate of the red box in Figure 3 represents the CW number which is 1, 4, 5, and 5, respectively, for the four preprocessing methods (no preprocessing, SG, MSC, and MSC-SG). As shown in Figure 4, the CWs were calculated by SPA as the most informative wavelengths replacing the full wavelengths for adulterated prediction purpose. One wavelength of 695 nm was selected for original spectral without preprocessing. Four wavelengths of 694, 743, 774, and 958 nm were selected as CWs for spectra with SG smoothing. Five wavelengths of 934, 500, 784, 741, and 721 nm and 934, 501, 720, 787, and 741 nm were determined as CWs for spectra with MSC and MSC-SG, respectively. The CWs of each preprocessing method were ranked in order and the optimum one was ranked first. The CWs mainly concentrated at the region from 700 to 800 nm. It was consistent with absorption peak
Journal of Food Quality
0.5
0.5
0.4
0.4 Reflectance
Reflectance
6
0.3 0.2
0.2 0.1
0.1 0.0 300
0.3
400
500
600 700 800 Wavelength (nm)
900
0.0 300
1000
ARS Selected wavelengths
400
500
1000
900
1000
(b)
0.5
0.5
0.4
0.4 Reflectance
Reflectance
900
ARS Selected wavelengths
(a)
0.3 0.2
0.3 0.2 0.1
0.1 0.0 300
600 700 800 Wavelength (nm)
400
500
600 700 800 Wavelength (nm)
900
1000
ARS Selected wavelengths (c)
0.0 300
400
500
600 700 800 Wavelength (nm)
ARS Selected wavelengths (d)
Figure 4: Selected CWs by SPA for no preprocessing (a), SG (b), MSC (c), and MSC-SG (d).
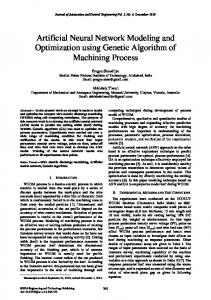
appearing in Figure 2, which was attributed to the third and fourth overtone of the O-H- and C-H- functional group, respectively [39]. The hyperspectral images of CWs were applied to extracted image features which were further used for prediction models. 3.3. Image Feature Selection. Hyperspectral imaging was one of the most commonly used applications of hyperspectral techniques [13]. The hyperspectral images of the first CWs (695, 694, 934, and 934 nm) under different preprocessing method (no preprocessing, SG, MSC, and SG-MSC) were shown in Figure 5. The AGL of the first CWs were shown in Figure 6. Because of obtaining the same first CWs of 934 nm after MSC and MSC-SG, they have the same hyperspectral image and AGL as shown in Figures 5(c), 5(d), 6(c), and 6(d). In Figure 5, there was an obvious tendency of colour change with PSG added ratio increasing. As for texture features, specific to the grooving depth and homogeneous degree, regular changes with different amounts of adulteration were shown. As shown in Figure 6, the AGL of images corresponding to
the first CWs after different pretreatments demonstrated the same variation trend; that is, the values of AGL increased with PSG content increasing. The tendency of colour change in Figure 5 consisted with the tendency of AGL illustrated in Figure 6. From the above, the colour (AGL) and texture (CON, ENE, COR, and IDM) features were applied to build prediction model. The above five features were standardized by 𝑍-scores processing before use as input layer for modeling. Taking texture features of the first CW (934 nm) under MSC-SG preprocessing as an example, four texture statistical measurements in four directions (0∘ , 45∘ , 90∘ , and 135∘ ) were illustrated in Figure 7. Larger variety was observed for measurements of CON than ENE, COR, and IDM along three directions (45∘ , 90∘ , and 135∘ ). It could be explained by intrinsic properties of heterogeneity of CCA adulterated with PSG [30]. The values of CON were higher than ENE, COR, and IDM at 45∘ , 90∘ , and 135∘ , which indicated that CON contains high local variations in those directions [30]. The figures of the rest of the CWs with different preprocessing methods have similar characters as Figure 7, which were no longer
Journal of Food Quality
7 (%)
0
5
10
15
20
25
30
35
40
45
50
55
60
65
70
75
80
85
90
95
50
55
60
65
70
75
80
85
90
95
50
55
60
65
70
75
80
85
90
95
50
55
60
65
70
75
80
85
90
95
(a)
(%) 0
5
10
15
20
25
30
35
40
45
(b)
(%) 0
5
10
15
20
25
30
35
40
45
(c)
(%) 0
5
10
15
20
25
30
35
40
45
(d)
Figure 5: Hyperspectral images of samples adulterated with PSG in the range of 0–95% corresponding to the first CW of 695 nm (a), 694 nm (b), 934 nm (c), and 934 nm (d) for different preprocessing (none, MSC, SG, and MSC-SG).
illustrated here. For the four different preprocessing methods (no preprocessing, MSC, SG, and MSC-SG), because of different numbers of CWs (1, 5, 4, and 5), four independent directions (0∘ , 45∘ , 90∘ , and 135∘ ) and four texture features (CON, ENE, COR, and IDM) of GLCM were applied, used for image feature selection. It means a total of 16, 80, 64, and 80 texture features were extracted from ROI, respectively. In our study, the four texture features (CON, ENE, COR, and IDM) as the mean of averaged over the four directions at CWs were used for further analysis [30], which means only 4, 20, 16, and 20 texture features were obtained as inputs to develop prediction models, respectively, for different preprocessing methods. 3.4. Establishment of Prediction Models. For the four different preprocessing methods (no preprocessing, MSC, SG, and MSC-SG), PNN and GRNN prediction model was established as follows: (1) the input layers had 5, 21, 17, and 21 nodes, respectively, representing the texture (CON, ENE, COR, and IDM) and colour (AGL) image features of CWs; (2) the nodes of hidden layer were determined by network adaptation; (3) the output layer represented the adulteration ratio; (4) the expansion constant was determined by experiments, where PNN was intended to be 0.3, 0.1, 0.2, and 0.1, and GRNN was intended to be 0.2, 0.1, 0.3, and 0.1. Table 1 indicated the composition of the sample sets and the value of correct classification rate (CCR). The performances of eight prediction models (PNN, PNN + SG, PNN + MSC, PNN + MSC-SG, GRNN, GRNN + SG, GRNN + MSC, and GRNN + MSC-SG) were evaluated by CCR as Cheng et al. used in meat classification [35]. When the data without preprocessing was used to establish the prediction model, PNN and
GRNN presented the lowest and similar CCR of 82.5%. All preprocessed spectra used in model building displayed higher CCR than those without preprocessing, which meant that the preprocessing methods were helpful and to some extent improved the prediction accuracy compared with the original data. After the application of MSC-SG, the CCR of PNN and GRNN both showed better performances. GRNN demonstrated better results than PNN. MSC-SG coupled with GRNN displayed the best performance for prediction with the highest CCR of 92.5%. According to Table 2, the normal samples, samples with pretreatment, and samples with higher adulteration rate (AR) have relatively lower RMSE. Samples with relatively lower AR possessed higher RMSE, specific to samples at AR of 5%, and RMSE reached 0.70 and 0.71 for PNN and GRNN, respectively. The value of RMSE decreased with increasing adulteration, which means the deviation between the prediction and calibration value decreased with increasing of AR.
4. Conclusions The hyperspectral imaging in the spectral range of 388– 1045 nm in tandem with spectral preprocessing and ANN (PNN and GRNN) technique was successfully developed for predicting of adulterated CCA. SPA was employed to select the CWs under the three preprocessed methods (MSC, SG, and MSC-SG) and reduce the high dimension of hyperspectral data. As a result, one wavelength of 695 nm was selected as CW for spectra without preprocessing. After MSC, five wavelengths of 943, 500, 784, 741, and 721 nm were selected by SPA. Four wavelengths of 694, 743, 774, and 958 nm were selected by SPA under SG smoothing. For the data with MSC-SG, five
8
Journal of Food Quality Table 1: Performance of PNN and GRNN with different preprocessing methods.
Modeling methods
Training set
Prediction set
CCR
PNN
120
80
82.5%
PNN + SG
120
80
85.0%
120
80
87.5%
120
80
90.0%
GRNN
120
80
82.5%
GRNN + SG
120
80
87.5%
GRNN + MSC
120
80
87.5%
GRNN + MSC-SG
120
80
92.5%
240
240
220
220
200
200 Gray level
Gray level
PNN + MSC PNN + MSC-SG
180
180
160
160
140
140
120
0
20
40 60 Adulteration ratio (%)
80
120
100
0
20
240
230
230
220
220
210
200
190
190
0
20
40 60 Adulteration ratio (%)
100
80
100
210
200
180
80
(b)
240
Gray level
Gray level
(a)
40 60 Adulteration ratio (%)
80
100
(c)
180
0
20
40 60 Adulteration ratio (%) (d)
Figure 6: AGL of samples adulterated with PSG in the range of 0–95% corresponding to the first CW of 695 nm (a), 694 nm (b), 934 nm (c), and 934 nm (d) for different preprocessing (no preprocessing, MSC, SG, and MSC-SG).
wavelengths of 934, 501, 720, 787, and 741 nm were selected. Besides, the colour (AGL) and texture (CON, ENE, COR, and IDM) features were extracted from the hyperspectral imaging of CWs and applied to build prediction models. Eight ANN (PNN, PNN + SG, PNN + MSC, PNN + MSC-SG, GRNN,
GRNN + SG, GRNN + MSC, and GRNN + MSC-SG) were used to establish the prediction models, of which GRNN in tandem with the MSC-SG (GRNN + MSC-SG) presented satisfactory performance with the CCR value of 92.5%. The overall results indicated that integration of ANN models
Journal of Food Quality
9 Table 2: RMSE of prediction set at different AR.
AR (%) 0 5 10 15 20 25 30 35 40 45 50 55 60 65 70 75 80 85 90 95
PNN 0.11 0.70 0.61 0.55 0.49 0.43 0.30 0.29 0.21 0.15 0.14 0.22 0.20 0.17 0.15 0.16 0.16 0.15 0.13 0.11
PNN + SG 0.11 0.59 0.52 0.44 0.41 0.35 0.31 0.31 0.31 0.13 0.13 0.19 0.15 0.15 0.19 0.17 0.16 0.12 0.11 0.10
PNN + MSC 0.10 0.58 0.42 0.42 0.40 0.35 0.31 0.31 0.28 0.17 0.17 0.16 0.15 0.15 0.14 0.14 0.13 0.11 0.10 0.10
PNN + MSC-SG 0.10 0.55 0.30 0.44 0.37 0.33 0.30 0.21 0.19 0.16 0.15 0.16 0.15 0.14 0.13 0.11 0.09 0.09 0.09 0.09
GRNN + SG 0.11 0.62 0.50 0.40 0.32 0.35 0.35 0.16 0.16 0.14 0.13 0.21 0.20 0.16 0.18 0.16 0.16 0.15 0.12 0.10
GRNN + MSC 0.11 0.51 0.50 0.38 0.35 0.35 0.32 0.35 0.11 0.28 0.15 0.20 0.20 0.15 0.16 0.14 0.14 0.16 0.12 0.09
GRNN + MSC-SG 0.09 0.50 0.40 0.33 0.31 0.31 0.26 0.21 0.12 0.22 0.15 0.11 0.14 0.14 0.13 0.12 0.10 0.09 0.10 0.09
Acknowledgments
2.0
This work was supported by the National Natural Science Foundation of China (31701696) and the Science and Technology Project of Liaoning Province (201602055).
1.5 Extracted value
GRNN 0.11 0.71 0.52 0.53 0.50 0.44 0.15 0.43 0.21 0.20 0.14 0.20 0.20 0.17 0.16 0.16 0.16 0.15 0.12 0.11
1.0
References
0.5
[1] Y. Li, H. He, L. Yang, X. Li, D. Li, and S. Luo, “Therapeutic effect of Colla corii asini on improving anemia and hemoglobin compositions in pregnant women with thalassemia,” International Journal of Hematology, vol. 104, no. 5, pp. 559–565, 2016.
0.0 −0.5 0
90
45
135
Direction (∘ ) CON COR
ENE IDM
Figure 7: Four texture characteristics from original spectrum at the first CW (695 nm) along different directions for 50% PSG adulteration.
analysis and spectra preprocessing based on hyperspectral imaging for CCA online detection was suitable and potential.
Conflicts of Interest The authors declare that there are no conflicts of interest regarding the publication of this paper.
[2] J.-S. Tian, X. Zhang, H. Liu et al., “The hematinic effect of Colla corii asini (Ejiao) using 1H-NMR metabolomics coupled with correlation analysis in APH-induced anemic rats,” RSC Advances, vol. 7, no. 15, pp. 8952–8962, 2017. [3] H. Wu, C. Ren, F. Yang, Y. Qin, Y. Zhang, and J. Liu, “Extraction and identification of collagen-derived peptides with hematopoietic activity from Colla Corii Asini,” Journal of Ethnopharmacology, vol. 182, pp. 129–136, 2016. [4] Y. Kumeta, T. Maruyama, H. Asama, Y. Yamamoto, T. Hakamatsuka, and Y. Goda, “Species identification of Asini Corii Collas (donkey glue) by PCR amplification of cytochrome b gene,” Journal of Natural Medicines, vol. 68, no. 1, pp. 181–185, 2014. [5] J. Ren, T. Deng, W. Huang, Y. Chen, and Y. Ge, “A digital PCR method for identifying and quantifying adulteration of meat species in raw and processed food,” PLoS ONE, vol. 12, no. 3, Article ID 0173567, 2017. [6] M. Montowska and E. Pospiech, “Authenticity determination of meat and meat products on the protein and DNA basis,” Food Reviews International, vol. 27, no. 1, pp. 84–100, 2011.
10 [7] M. Peris and L. Escuder-Gilabert, “Electronic noses and tongues to assess food authenticity and adulteration,” Trends in Food Science & Technology, vol. 58, pp. 40–54, 2016. [8] S. Azadmard-Damirchi, “Review of the use of phytosterols as a detection tool for adulteration of olive oil with hazelnut oil,” Food Additives and Contaminants - Part A Chemistry, Analysis, Control, Exposure and Risk Assessment, vol. 27, no. 1, pp. 1–10, 2010. [9] A. J. Siddiqui, S. G. Musharraf, M. I. Choudhary, and A.-U. Rahman, “Application of analytical methods in authentication and adulteration of honey,” Food Chemistry, vol. 217, pp. 687– 698, 2017. [10] L. Wu, B. Du, Y. Vander Heyden et al., “Recent advancements in detecting sugar-based adulterants in honey – A challenge,” TrAC - Trends in Analytical Chemistry, vol. 86, pp. 25–38, 2017. [11] S. R. Rebechi, M. A. V´elez, S. Vaira, and M. C. Perotti, “Adulteration of Argentinean milk fats with animal fats: Detection by fatty acids analysis and multivariate regression techniques,” Food Chemistry, vol. 192, pp. 1025–1032, 2016. [12] A. Poonia, A. Jha, R. Sharma, H. B. Singh, A. K. Rai, and N. Sharma, “Detection of adulteration in milk: A review,” International Journal of Dairy Technology, vol. 70, no. 1, pp. 23–42, 2017. [13] J. H. Qu, D. Liu, J. H. Cheng et al., “Applications of near-infrared spectroscopy in food safety evaluation and control: a review of recent research advances,” Critical Reviews in Food Science & Nutrition, vol. 55, no. 13, pp. 19–39, 2015. [14] D. Yang and Y. Ying, “Applications of raman spectroscopy in agricultural products and food analysis: A review,” Applied Spectroscopy Reviews, vol. 46, no. 7, pp. 539–560, 2011. [15] W.-H. Su and D.-W. Sun, “Evaluation of spectral imaging for inspection of adulterants in terms of common wheat flour, cassava flour and corn flour in organic Avatar wheat (Triticum spp.) flour,” Journal of Food Engineering, vol. 200, pp. 59–69, 2017. [16] M. Kamruzzaman, D.-W. Sun, G. ElMasry, and P. Allen, “Fast detection and visualization of minced lamb meat adulteration using NIR hyperspectral imaging and multivariate image analysis,” Talanta, vol. 103, pp. 130–136, 2013. [17] M. Kamruzzaman, Y. Makino, and S. Oshita, “Non-invasive analytical technology for the detection of contamination, adulteration, and authenticity of meat, poultry, and fish: a review,” Analytica Chimica Acta, vol. 853, pp. 19–29, 2015. [18] B. M. Nicola¨ı, K. Beullens, E. Bobelyn et al., “Nondestructive measurement of fruit and vegetable quality by means of NIR spectroscopy: a review,” Postharvest Biology and Technology, vol. 46, no. 2, pp. 99–118, 2007. [19] H.-I. Wang, J.-Y. Peng, C.-Q. Xie, Y.-D. Bao, and Y. He, “Fruit quality evaluation using spectroscopy technology: a review,” Sensors, vol. 15, no. 5, pp. 11889–11927, 2015. [20] J. H. Cheng and D. W. Sun, “Hyperspectral imaging as an effective tool for quality analysis and control of fish and other seafoods: Current research and potential applications,” Trends in Food Science & Technology, vol. 37, no. 2, pp. 78–91, 2014. [21] M. Huang, M. S. Kim, S. R. Delwiche et al., “Quantitative analysis of melamine in milk powders using near-infrared hyperspectral imaging and band ratio,” Journal of Food Engineering, vol. 181, pp. 10–19, 2016. [22] M. Kamruzzaman, Y. Makino, and S. Oshita, “Rapid and nondestructive detection of chicken adulteration in minced beef using visible near-infrared hyperspectral imaging and machine learning,” Journal of Food Engineering, vol. 170, pp. 8–15, 2016.
Journal of Food Quality [23] Z. Han, J. Wan, L. Deng, and K. Liu, “Oil adulteration identification by hyperspectral imaging using QHM and ICA,” PLoS ONE, vol. 11, no. 1, Article ID e0146547, 2016. [24] J. B. Li, L. P. Chen, W. Q. Huang et al., “Multispectral detection of skin defects of bi-colored peaches based on vis-NIR hyperspectral imaging,” Postharvest Biology and Technology, vol. 112, pp. 121–133, 2016. [25] Z. Xiong, D.-W. Sun, Q. Dai, Z. Han, X.-A. Zeng, and L. Wang, “Application of Visible Hyperspectral Imaging for Prediction of Springiness of Fresh Chicken Meat,” Food Analytical Methods, vol. 8, no. 2, pp. 380–391, 2014. [26] M. R. Maleki, A. M. Mouazen, H. Ramon, and J. De Baerdemaeker, “Multiplicative Scatter Correction during On-line Measurement with Near Infrared Spectroscopy,” Biosystems Engineering, vol. 96, no. 3, pp. 427–433, 2007. [27] J. Ma, D.-W. Sun, and H. Pu, “Spectral absorption index in hyperspectral image analysis for predicting moisture contents in pork longissimus dorsi muscles,” Food Chemistry, vol. 197, pp. 848–854, 2016. [28] M. Khojastehnazhand, M. H. Khoshtaghaza, B. Mojaradi, M. Rezaei, M. Goodarzi, and W. Saeys, “Comparison of visiblenear infrared and short wave infrared hyperspectral imaging for the evaluation of rainbow trout freshness,” Food Research International, vol. 56, pp. 25–34, 2014. [29] S. Fan, B. Zhang, J. Li, C. Liu, W. Huang, and X. Tian, “Prediction of soluble solids content of apple using the combination of spectra and textural features of hyperspectral reflectance imaging data,” Postharvest Biology and Technology, vol. 121, pp. 51–61, 2016. [30] H. Huang, L. Liu, and M. O. Ngadi, “Assessment of intramuscular fat content of pork using NIR hyperspectral images of rib end,” Journal of Food Engineering, vol. 193, pp. 29–41, 2017. [31] A. Baraldi and F. Parmiggiani, “Investigation of the textural characteristics associated with gray level cooccurrence matrix statistical parameters,” IEEE Transactions on Geoscience and Remote Sensing, vol. 33, no. 2, pp. 293–304, 1995. [32] H. Pu, D.-W. Sun, J. Ma, and J.-H. Cheng, “Classification of fresh and frozen-thawed pork muscles using visible and near infrared hyperspectral imaging and textural analysis,” Meat Science, vol. 99, pp. 81–88, 2014. [33] D. F. Specht, “Probabilistic neural networks,” Neural Networks, vol. 3, no. 1, pp. 109–118, 1990. [34] D. F. Specht, “A general regression neural network,” IEEE Transactions on Neural Networks and Learning Systems, vol. 2, no. 6, pp. 568–576, 1991. [35] J.-H. Cheng, D.-W. Sun, H.-B. Pu et al., “Integration of classifiers analysis and hyperspectral imaging for rapid discrimination of fresh from cold-stored and frozen-thawed fish fillets,” Journal of Food Engineering, vol. 161, pp. 33–39, 2015. [36] A. N. Analytical, “Methods, Committee, z-Scores and other scores in chemical proficiency testing-their meanings, and some common misconceptions,” Analytical Methods, vol. 8, no. 28, pp. 5553–5555, 2016. [37] J.-H. Qu, D.-W. Sun, J.-H. Cheng, and H. Pu, “Mapping moisture contents in grass carp (Ctenopharyngodon idella) slices under different freeze drying periods by Vis-NIR hyperspectral imaging,” LWT- Food Science and Technology, vol. 75, pp. 529–536, 2017. [38] B. Jamshidi, S. Minaei, E. Mohajerani, and H. Ghassemian, “Reflectance Vis/NIR spectroscopy for nondestructive taste characterization of Valencia oranges,” Computers and Electronics in Agriculture, vol. 85, pp. 64–69, 2012.
Journal of Food Quality [39] J. T. Sun, B. X. Ma, J. Dong, R. G. Zhu, R. Y. Zhang, and W. Jiang, “Detection of internal qualities of hami melons using hyperspectral imaging technology based on variable selection algorithms,” Journal of Food Process Engineering, vol. 40, no. 3, Article ID e12496, 2017. [40] X. Wu, X. Song, Z. Qiu, and Y. He, “Mapping of TBARS distribution in frozen-thawed pork using NIR hyperspectral imaging,” Meat Science, vol. 113, pp. 92–96, 2016.
11
International Journal of
Journal of
Peptides
The Scientific World Journal Hindawi Publishing Corporation http://www.hindawi.com www.hindawi.com
Volume 2018 2013
Nucleic Acids
International Journal of
International Journal of
Cell Biology Hindawi www.hindawi.com
Microbiology Volume 2018
Hindawi www.hindawi.com
Volume 2018
Hindawi www.hindawi.com
Volume 2018
Anatomy Research International Hindawi www.hindawi.com
Hindawi www.hindawi.com
Volume 2018
Biochemistry Research International Hindawi www.hindawi.com
Volume 2018
Volume 2018
Submit your manuscripts at www.hindawi.com Genetics Research International
Advances in
Bioinformatics Hindawi www.hindawi.com
Advances in
International Journal of
Genomics Hindawi www.hindawi.com
Hindawi www.hindawi.com
Volume 2018
Volume 2018
Virolog y Hindawi www.hindawi.com
Zoology
Stem Cells International
International Journal of
Volume 2018
Hindawi www.hindawi.com
Volume 2018
Hindawi www.hindawi.com
Volume 2018
BioMed Research International Volume 2018
Hindawi www.hindawi.com
Volume 2018
Neuroscience Journal
Enzyme Research Hindawi www.hindawi.com
Journal of Parasitology Research Volume 2018
Hindawi www.hindawi.com
Volume 2018
Journal of
Marine Biology Hindawi www.hindawi.com
Volume 2018
Hindawi www.hindawi.com
Archaea Volume 2018
Hindawi www.hindawi.com
Volume 2018