Article
Integration of Directional Antennas in an RSS Fingerprinting-Based Indoor Localization System Raúl Guzmán-Quirós *, Alejandro Martínez-Sala, José Luis Gómez-Tornero and Joan García-Haro Received: 30 September 2015; Accepted: 17 December 2015; Published: 23 December 2015 Academic Editors: Kourosh Khoshelham and Sisi Zlatanova Department of Information and Communication Technologies, Universidad Politécnica de Cartagena, Cartagena 30202, Spain;
[email protected] (A.M.-S.);
[email protected] (J.L.G.-T.);
[email protected] (J.G.-H.) * Correspondence:
[email protected]; Tel.: +34-968-326-535; Fax: +34-968-325-973
Abstract: In this paper, the integration of directional antennas in a room-level received signal strength (RSS) fingerprinting-based indoor localization system (ILS) is studied. The sensor reader (SR), which is in charge of capturing the RSS to infer the tag position, can be attached to an omnidirectional or directional antenna. Unlike commonly-employed omnidirectional antennas, directional antennas can receive a stronger signal from the direction in which they are pointed, resulting in a different RSS distributions in space and, hence, more distinguishable fingerprints. A simulation tool and a system management software have been also developed to control the system and assist the initial antenna deployment, reducing time-consuming costs. A prototype was mounted in a real scenario, with a number of SRs with omnidirectional and directional antennas properly positioned. Different antenna configurations have been studied, evidencing a promising capability of directional antennas to enhance the performance of RSS fingerprinting-based ILS, reducing the number of required SRs and also increasing the localization success. Keywords: indoor localization system; received signal strength; fingerprinting technique; artificial neural networks; directional antennas
1. Introduction Many context-aware applications require services dependent on the user/tag location [1]. To name a few, guide navigation in museums and malls or asset tracking for logistical purposes in hospitals, airports or general industrial environments are some of the most promising services currently demanded. Most of these applications usually require indoor location, where global navigation satellite systems (GNSS) cannot guarantee location service due to the obstruction of the satellites’ signals [2]. For this reason, alternative indoor localization systems (ILS) employing different technologies are increasingly drawing more attention, [3]. Most of them are differentiated by the type of metrics employed to infer the position, such as time of arrival (TOA), time difference of arrival (TDOA), angle of arrival (AOA) or received signal strength (RSS). Systems that incorporate TOA, TDOA or AOA measurements usually achieve high location accuracy with errors below 1 m, but at the expense of more complex and expensive devices than RSS solutions due to the need for complex synchronization schemes and higher bandwidth requirements [4–8]. Currently, solutions based on RSS are quite attractive because of their easy integration in wireless networks and extremely low cost, since RSS measurement is usually reported by most of the current standards [9]. Basically, in the literature, three different techniques can be found to estimate the position from the RSS. (1) Proximity algorithms [10] provide symbolic relative location information. In these cases, the tag position is associated with the known location of the sensor that measures the strongest RSS value. They usually rely on a dense grid of sensors; (2) Distance-based Sensors 2016, 16, 4; doi:10.3390/s16010004
www.mdpi.com/journal/sensors
Sensors 2016, 16, 4
2 of 23
methods [9,11–14] require estimating the distance between the tag and the sensors from the RSS, obtaining the tag location by multilateration algorithms [9]. However, a good radio propagation model of the indoor electromagnetic channel is required [12–15], so the greater precision of the model, the better location accuracy achieved. These models are not trivial and usually require a custom-made survey of the indoor environment under consideration to obtain the model parameters. Finally; (3) the third group of systems encompasses those ones based on the fingerprinting-based technique (also called scene analysis) [16–19]. Fingerprinting has become one of the most popular and extended techniques applied to RSS-based indoor positioning systems. This technique mandatorily requires a site survey of the particular scenario of interest in order to gather a set of fingerprints composed of RSS vectors associated with the possible space locations where the tag can be positioned. Thus, a fingerprint database is created, which is generally called a radio map. Several approaches based on different architectures and positioning algorithms [4] have been proposed to estimate the tag position from the radio map. Among others, the most outstanding algorithms are maximum likelihood (ML) [20–22], K-nearest neighbors (KNN), weighted KNN (WKNN) [11] and diverse learning machines, such as support vector machines (SVMs) [23,24], radial basis functions (RBF) or artificial neural networks (ANN) [25–29]. ML, KNN or WKNN consist of comparing gathered RSS vectors with the RSS fingerprints stored in the radio map. Thereby, the most likely tag position is figured out. On the other hand, machine learning algorithms need an intermediate training phase after the site survey and before the operating stage. The machines must be previously trained so they can learn the mapping function between RSS signal space vectors and spatial locations in the radio map. After the training process, these learning machines will act as classifiers, providing the most probable location according to the knowledge acquired. Independent of the inferring technique, the unpredictable temporal fluctuation of the RSS inside indoor buildings is one of the main issues that any RSS-based ILS encounters and which jeopardizes their robustness and maximum accuracy [16,17]. These irregularities of the electromagnetic channel are produced by uncontrolled factors, such as interfering electric/electronic devices, people moving, open/closed doors, temperature/humidity variation as a function of the daytime/climatology and other dynamic phenomena [29,30]. Due to these phenomena, in-building location estimation from RSS is a complex problem that is difficult to be engineered using classical mathematical methods. For this reason, recent works have tried to incorporate improvements to filter the RSS noise sources and finely tune the tag position by combining different techniques [31–38], introducing additional sensor data (e.g., digital compass or pedometers [29,31], accelerometers [36–38], etc.), employing Kalman or particle swarm filters [32–35] or improving the radio map quality [18,19]. Nonetheless, it is interesting to note that RSS fingerprinting-based indoor localization techniques exploit the RSS variability, but from the spatial perspective, i.e., the greater the RSS changes along space, the more robust and the easier is the fingerprinting-matching task, as more dissimilar fingerprints arise at each possible tag location; hence, the higher the accuracy that can be achieved [16]. Indeed, this spatial variance can be interpreted as a negative effect, which increases the overall RSSI variance and degrades the localization performance, but this interpretation is not strictly right. The proper indoor channel complexity (mainly given by phenomena, such as non-line of sight (NLOS) multi-path effects because of reflections/refractions due to the building geometry, wall/floors, building material losses, etc.) can be an advantageous property for these systems, as it increments this spatial variation in the RSS distribution compared to outdoors, where RSS decay is mainly predicted by the distance losses with respect to the source. In this paper, we study the employment of omnidirectional and directional antennas to improve the accuracy of an RSS fingerprinting-based ILS for room-level positioning. The hypothesis behind it is: the variance of the RSSI (in terms of space) could be increased by integrating suitably-positioned and -oriented directional antennas (more directive antennas introduce higher sensitivity/variance with space). Thus, increased spatial variability should create more dissimilarity between different locations (fingerprints); the radio map quality can be enhanced, as fingerprints will be more robust
Sensors 2016, 16, 4
3 of 23
to noise (generated by the aforementioned dynamic phenomena) and, hence, more easily associated with the location. The rest of the paper is organized as follows. Related work is provided in Section 2. System operation concepts and architecture are introduced in Section 3. Section 4 describes the system deployment cycle, focusing on the description of the sensor network planning and calibration phases. Finally, Sections 5 and 6 discuss experimental test results and conclusions, respectively. 2. Related Work Several works have proposed learning machines as good candidates to estimate the tag position from RSS measurements. In [24], a kind of artificial neural network, called multilayer perceptron (MLP), was proposed to map for the first time the relation between coordinates (X,Y) of the tag position and the RSS gathered by an ad hoc WLAN. In [23–27], other types of learning machines, such as support vector machines (SVM), learning vector quantization (LVQ) and radial basis functions (RBF), were respectively studied for the same purpose, obtaining similar results. Up to date, most of these systems offer a coarse precision of 3–6 m for 90% of estimations [4], if no additional information/sensors are integrated [16]. This precision can be acceptable for many location-based services (LBS), which require room-/area-level localization [13,21–23], but not for exact point location. In fact, room-level accuracy has high interest given the number of highly practical applications that can be integrated with low cost techniques and quite extended commercial systems (smartphones, tablets, etc.). However, there is still a problem with service reliability, because of the RSS temporal fluctuations. At this point, it is good to note that the presented work is in the frame of the Spanish Project “ChAracterization, EvaLuation, Planning and IMprovement of Key Technologies for the Future Internet: Knowledge and Transfer” (CALM), Project Ref. TEC2010-21405-C02-02, which was intended to provide room-level localization of patients inside a hospital. In many particular applications as this one, meter/submeter indoor positioning is not necessary, and less accurate, much more inexpensive room-sized localization is adequate. This type of room-level solution can be found in many commercial products; see for instance [39–43]. Several previous works have proposed different approaches to provide room-level positioning so far, which seem to have obtained good results. In [13], a coarse room-level accuracy is given based on selecting the anchor node with the maximum associated RSS. Each anchor is associated with a room. However, problems arise when the tag is close to walls. This issue is improved in [21], where a path-restricted room-level localization system is proposed with additional intelligence, achieving an average success probability of 94%. Furthermore, high success is achieved in [22,23], where RSS-based probabilistic algorithms are applied to refine the room-level tag location based on detecting tag distance to passable boundary points (e.g., at entrances) [22] or calculating a transition probability between points [23], so they detect when the tag is likely moving between predefined areas with additional post-processing techniques. According to the experiments, around 95% of success is the average in [22] and 97% in [23], respectively, in controlled conditions. However, all previous cited works assumed omnidirectional antennas for the sensor readers and tags, obviating the interesting properties of non-isotropic (directional) antennas. Unlike omnidirectional antennas, directional antennas may report better spatial discrimination, because of their higher directivity at some angular directions. Some works have proposed exploiting directional antenna properties in a different way [44–52]. In [44], a review of antennas applied for indoor localization systems can be found. An AOA-based technique was presented in [45], where the angle was estimated from the difference between RSS captured by two directional antennas. Furthermore, [46–52] present similar AOA-based techniques employing directional antennas for location estimation in wireless sensor networks (WSN), reducing to two the minimum number of anchor nodes (sensor readers (SRs)) to estimate the tag position by multilateration techniques. In particular, in [52], the tag position was estimated from TOA and AOA measurements, the last one being estimated from the RSS received by an array of directional antennas.
Sensors 2016, 16, 4
4 of 23
None of these works have analyzed the integration of directional antennas to enhance the performance of a room-based RSS fingerprinting-based ILS following the hypothesis laid down in this paper, i.e., 2015, the increment of the spatial variability of the RSS distribution through intrinsic directional Sensors 15, 0004 antennas’ spatial variability. As will be seen below, a classical room-level RSS-based positioning thisbased paper, the increment of the spatial RSS intrinsic and engine oni.e., a simple MLP classifier will be variability employedof to the carry outdistribution the study. through Omnidirectional directional antennas’ spatial variability. As will be seen below, a classical room-level RSS-based directional antennas have been integrated in order to analyze their effect on the system performance. positioning engine based on a simple MLP classifier will be employed to carry out the study. In the next section, the architecture of the system is presented in detail. Omnidirectional and directional antennas have been integrated in order to analyze their effect on the system performance. In the next section, the architecture of the system is presented in detail.
3. Proposed Indoor Localization System
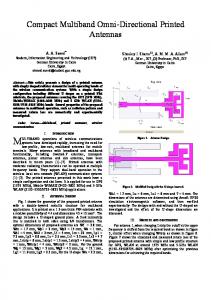
3. Proposed Indoor Localization Systemsystem is basically composed of three blocks, as illustrated The block diagram of the proposed in FigureThe 1: block (1) the physical layer, wheresystem the RSS is captured by the sensor reader (SR) network diagram of the proposed is basically composed of three blocks, as illustrated and managed coordination middleware (SNCM); (2) the localization server, in Figure 1:by (1)the the sensor physicalnetwork layer, where the RSS is captured by the sensor reader (SR) network and managed by the sensor network coordination (2) theoflocalization server, in end in which the RSS data are processed in order tomiddleware obtain the (SNCM); final position the tag; and (3) the the RSSblock, data are processed in order to obtain final position of the tag; and (3) the end user the user which application which represents end users. the Herein, context-aware applications demand application block, which represents end users. Herein, context-aware applications demand the location information to be employed by LBSs. location information to be employed by LBSs. The sensor network consists of a set of K sensor readers (SRs) placed at different fixed The sensor network consists of a set of K sensor readers (SRs) placed at different fixed locations locations throughout the scenario. These devices are in charge of capturing the RSS from the throughout the scenario. These devices are in charge of capturing the RSS from the beacons beacons transmitted by the tag, which can be located in some of the M rooms or areas of interest transmitted by the tag, which can be located in some of the M rooms or areas of interest (R = (R {R1=,...,R into which the scenario was previously divided. Then, the tags whose position M }) i ,...R {R1,...,R i,...R M}) into which the scenario was previously divided. Then, the tags whose position is is desired sendN N beacons, RSSbewill be captured byEach the k-th SRs.SR Each desiredwill will periodically periodically send beacons, and and their their RSS will captured by the SRs. k-th creates SR creates an RSS vector components, corresponding to each transmitted beacon: an RSS vector withwith N N components, corresponding to each transmitted beacon: S 1=,...,S {S1,...,S j ,...S N }. The captured RSS vector is organized by the SNCM layer, guaranteeing data S = {S ,...S }. The captured RSS vector is organized by the SNCM layer, guaranteeing data N j integrity and generating a final N × K RSS data matrix, which will be forwarded to the localization integrity and generating a final N ˆ K RSS data matrix, which will be forwarded to the localization server (second block) to infer the tagposition. position. server (second block) to infer the tag
Figure 1. Block diagram of the proposed RSS-based indoor localization system (ILS). Figure 1. Block diagram of the proposed RSS-based indoor localization system (ILS).
4
Sensors 2016, 16, 4
5 of 23
The localization server is mainly responsible for estimating the room ID (Ri ) where the tag is positioned. This localization engine constitutes the fundamental part of this block and consists of a two-layered architecture, which sequentially processes the RSS data matrix generated by the SNCM in the physical layer to estimate the most probable room where the tag might be located. The first layer corresponds to a pre-processing of the raw data and basically filters out outliers and averages the captured RSS data from each SR. After the pre-processing, the classifier layer, including the localization algorithm (an ANN, as will be seen), processes the averaged RSS and infers the room ID. Sensors 2015, 15, 0004 Furthermore, a database is integrated with the server. This is employed to store all of the information localization server is mainly responsible for estimating the parameters room ID (Ri) where the to tagthe is artificial related to the The radio map fingerprints, system configuration and related positioned. This localization engine constitutes the fundamental part of and consists of a neural network (ANN). The indoor localization system manager is this the block software tool supported by two-layered architecture, which sequentially processes the RSS data matrix generated by the SNCM the server,inimplemented in C# and MATLAB. This program allows one to control the whole system, the physical layer to estimate the most probable room where the tag might be located. The first configuration, tag parameters, calibrationofprocess, ANN etc., out giving flexibility and agility to layer corresponds to a pre-processing the raw data andtraining, basically filters outliers and averages thesystem capturedoffline RSS data from(deployment, each SR. After the pre-processing, the classifier layer, including the and the manage the phase radio map generation and system calibration) localization algorithm (an ANN, as will be seen), processes the averaged RSS and infers the room ID. experimental tests easily, as will be shown in the next sections. Furthermore, a database is integrated with the server. This is employed to store all of the Finally, this information will be accessed by the context-aware services when demanded by information related to the radio map fingerprints, system configuration and parameters related to the end users, in the third block. Therefore, the system system can bemanager seen as a software platform the artificial neural network (ANN). The indoor localization is the toolto provide supported by the to server, implemented in C# and MATLAB. applications This program allows one to surveillance, control the positioning information support different context-aware (tracking, assets whole system, configuration, tag parameters, calibration process, ANN training, etc., giving control, etc.). 4.
flexibility and agility to manage the system offline phase (deployment, radio map generation and system calibration) and the experimental tests easily, as will be shown in the next sections. Deployment Cycle Finally, this information will be accessed by the context-aware services when demanded by the end users, in thethe third block. Therefore, the system can be seen as a platform tocycle provide positioning In order to setup RSS fingerprinting-based ILS, the deployment depicted in information to support different context-aware applications (tracking, surveillance, assets control, etc.).
Figure 2 has been considered. Basically, it can be divided into two stages, which are common for any kind of fingerprinting-based ILS, the offline and the online stages. The offline stage is dedicated to setup the 4. Deployment Cycle system, i.e., plan the antennas’ initial position, generate thedeployment radio map (site survey process In order to setup the RSS fingerprinting-based ILS, the cycle depicted in Figure 2 [1]) and has been considered. Basically, it can bestage, dividedthe intosystem two stages, which are common any kind of train the ANN. Otherwise, in the online is operating in realfor time, estimating and ILS,to thethe offline the online stages. The offline stage is dedicated to setup the providing fingerprinting-based the tag localization endand user. system, i.e., plan the antennas’ initial position, generate the radio map (site survey process [1]) and Regarding the offline stage, this is divided into four phases, namely: Pre-project, planning, setup train the ANN. Otherwise, in the online stage, the system is operating in real time, estimating and and calibration phases. the to pre-project phase fulfils an analysis of the indoor scenario in detail, providing the tagFirstly, localization the end user. Regarding the offline stage, this is divided into Pre-project, planning, in order to define the rooms/areas of interest where thefour tagphases, will benamely: localized (imposed by the service setup calibration phases. Firstly, the pre-project fulfils an analysis the indoor scenario conditions) andand find the restrictions imposed by thephase infrastructure itself,of such as the location of its in detail, in order to define the rooms/areas of interest where the tag will be localized (imposed by power network sockets to feed the system or the potential electromagnetic interference sources, which the service conditions) and find the restrictions imposed by the infrastructure itself, such as the could interfere with ILS. Secondly, planning phase devoted to initiallyinterference positioning the SR location of itsthe power network socketsthe to feed the system or theis potential electromagnetic sources, which couldservice interfereconditions with the ILS. Secondly, the planning phasethe is devoted to initially antennas according to the and restrictions. Thirdly, site survey is the process positioning the SRisantennas according to the service conditions and restrictions. Thirdly, the sitein order to by which the radio map generated. In this step, a number of fingerprints are generated survey is the process by which the radio map is generated. In this step, a number of fingerprints are calibrate the system in the fourth phase, where the ANN is trained and tested with the radio map, generated in order to calibrate the system in the fourth phase, where the ANN is trained and tested so that it can to map, mapsothe withthe the location of the tag. The latter phases withlearn the radio thatRSS it canvectors learn to map RSS vectors with the location of the tag. The latter are neatly neatly explained in the next subsections. explained phases in theare next subsections.
Figure System deployment deployment cycle. Figure 2. 2. System cycle.
4.1. Site Survey and Calibration Phase
4.1. Site Survey and Calibration Phase
One of the drawbacks of any fingerprinting-based ILS is the offline stage. This stage requires
time anddrawbacks manpower. In this process must be repeated every scenario whereThis the system One of the ofaddition, any fingerprinting-based ILS isforthe offline stage. stage requires is set up or if the infrastructure suffers major modifications. For this reason, some authors are time and manpower. In addition, this process must be repeated for every scenario where the system is set up or if the infrastructure suffers major modifications. For this reason, some authors are looking 5
Sensors 2016, 16, 4
6 of 23
for research lines to deal with the reduction of the radio map generation efforts [18] or trying to Sensors 2015, 15, 0004 develop systems that omit this step totally or partially as much as possible [53]. looking for research lines to deal with the reduction of the radio map generation efforts [18] or trying
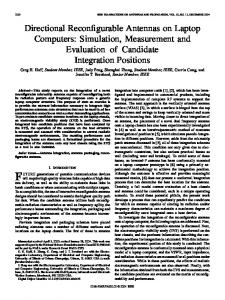
4.1.1. to Radiomap Generation develop systems that omit this step totally or partially as much as possible [53]. The site survey must be performed in order to generate the radio map. This map allows 4.1.1. Radiomap Generation one to characterize the spatial RSS distribution inside the indoor environment, collecting the site survey must be performed in order to generate the radio map. This map allows one to so-called The fingerprints, which in this case are composed of an RSS data matrix with N ˆ K features characterize the spatial RSS distribution inside the indoor environment, collecting the so-called (N transmitted beacons captured by K SRs) and the associated location (room ID) from where the tag fingerprints, which in this case are composed of an RSS data matrix with N × K features (N transmitted the beacons. Usually, it is assumed that the more fingerprints gathered, the better the transmitted beacons captured by K SRs) and the associated location (room ID) from where the tag radiotransmitted map will represent theUsually, scenario. therethe is more no clear guidance on howthe to better carry the out this the beacons. it isHowever, assumed that fingerprints gathered, process, since it depends on the scenario, the fluctuation of the signal and other parameters that radio map will represent the scenario. However, there is no clear guidance on how to carry out thismust be fixed during theit process tagscenario, position, number of transmitted process, since depends(e.g., on the thetransmission fluctuation ofpower, the signal and other parameters beacons, that be fixed during the process tag fingerprints position, transmission power, of transmitted etc.). must Furthermore, we cannot take as(e.g., many as desired, sincenumber it becomes unfeasible in Furthermore, we cannot take as fingerprints as performing desired, since becomes termsbeacons, of time,etc.). especially if the indoor scenario is many very large. Hence, theit site survey is unfeasible in terms of time, especially if the indoor scenario is very large. Hence, performing the not a trivial task. Many papers, such as [25–29], have assumed a static tag position during site the RSS survey is not a trivial task. Many papers, such as [25–29], have assumed a static tag position during measurement campaign in order to generate the radio map to characterize the spatial RSS fluctuation. the RSS measurement campaign in order to generate the radio map to characterize the spatial RSS Other authors have demonstrated the importance of the orientation of people with respect to the fluctuation. Other authors have demonstrated the importance of the orientation of people with SRs, as this influences the RSS variability due to the body absorption losses, which may report an respect to the SRs, as this influences the RSS variability due to the body absorption losses, which increase up to 3–6 dB of onupthe RSSdBstandard [30]. Furthermore, parameters, such as mayof report an increase to 3–6 on the RSSdeviation standard deviation [30]. Furthermore, parameters, temperature humidity or variations weatherbychanges the dynamics of a normal such as or temperature humidityproduced variations by produced weatherorchanges or the dynamics of aoffice environment (people, doors, etc.), can directly impact magnitude these irregularities on the normal office environment (people, doors, etc.), canthe directly impactofthe magnitude of these irregularitieschannel on the electromagnetic channel [19]. other In thisworks, paper, radio unlikemap otherfingerprints works, radiohave map been electromagnetic [19]. In this paper, unlike fingerprints havestroll been gathered as people stroll about the scenario statically), as we believe that gathered as people about the scenario (not statically), as (not we believe that these fingerprints these fingerprints will represent the electromagnetic fluctuation suffered by the signal during themore will represent the electromagnetic fluctuation suffered by the signal during the online stage online stage more realistically, when people move and the system operates in real time. Thereby, the realistically, when people move and the system operates in real time. Thereby, the RSS fluctuation RSS fluctuation will be better characterized by the ANN during the training process of the will be better characterized by the ANN during the training process of the calibration phase. calibration phase. Two Two software tools tools have been developed to manage the site process efficiently software have specifically been specifically developed to manage thesurvey site survey process in terms of time. In Figure 3, In the interface the so-called systemsystem management tool (Left) and the efficiently in terms of time. Figure 3, theof interface of the so-called management tool (Left) site survey can be installed a portable with the with Android and thetool site(Right) survey are toolshown, (Right) which are shown, which can beininstalled in a device portable device the OS (e.g., Android tablet orOS smartphone). Therefore, it is possible to control the localization server (where (e.g., tablet or smartphone). Therefore, it is possible to control the localization server the (where the systemtool management toolremotely is installed) via the WiFiAndroid from thedevice. AndroidThis device. system management is installed) viaremotely WiFi from hasThis allowed has allowed in realparameters time the system parameters and automatically organizing derived the configuring in realconfiguring time the system and automatically organizing the information information derived from the fingerprint generation. from the fingerprint generation.
Figure 3. (Left) System management (Right)site sitesurvey survey tool Android. Figure 3. (Left) System managementtool tool and and (Right) tool forfor Android.
6
Sensors 2016, 16, 4
7 of 23
Sensors 2015, 15, 0004
In Figure 4 is summarized the process followed to generate the site survey. As the first step, the system management tool and survey tool to are startedtheup the server the Android In Figure 4 is summarized thesite process followed generate siteinsurvey. As theand first step, the portable device, respectively. Then, digital of theup scenario and the tag (channel system management tool and site the survey tool map are started in the server and theconfiguration Android portable frequency, of beacons, TX power, etc.) are loaded in theand server. In the next step, a(channel person with device,number respectively. Then, the digital map of the scenario the tag configuration frequency, number beacons, TX power, loadedacross in theeach server. In the area/room next step, a (previously person the Android device andofthe tag fixed to the etc.) bodyaremoves defined with the Android device and the tag fixed to the body moves across each defined area/room defined in the pro-project phase). Different points are chosen randomly, trying to encompass the (previously defined in moves the pro-project phase). Different randomly, trying whole area. The person indicating on the touchpoints screenare of chosen the Android device thetoroom encompass the whole area. The person moves indicating on the touch screen of the Android device where he/she is located. Then, a beacon burst is transmitted from the tag to generate the fingerprint the room where he/she is located. Then, a beacon burst is transmitted from the tag to generate the associated with the current position. This process is repeated several times inside each room until no fingerprint associated with the current position. This process is repeated several times inside each rooms remain unexplored. Finally, the server stores as text files the fingerprints in the server database room until no rooms remain unexplored. Finally, the server stores as text files the fingerprints in the with server additional configuration information of interest for the investigations (RSS features, real(RSS position database with additional configuration information of interest for the investigations (room ID) of the tag, orientation, parameter values, etc.). features, real position (room ID) of the tag, orientation, parameter values, etc.).
Figure4.4.Site Site survey survey process Figure processflowchart. flowchart.
4.1.2. ANN Training
4.1.2. ANN Training
After generating the radio map, the system requires a calibration phase to learn how to localize After generating the radio map, the system a calibration to learn how in tothe localize the tags from the captured RSS patterns. This isrequires carried out by training phase the ANN integrated the tags from the captured RSS patterns. (samples) This is carried out by training ANN integrated in the localization engine with the fingerprints gathered during the radiothe map generation. There are different of ANN [25–29]; however, wethe have considered multilayer localization engine with the types fingerprints (samples) gathered here, during radio map generation. perceptron Although demonstrated that MLP ishere, muchwe superior other approaches, There are (MLP). different types itofis not ANN [25–29]; however, havetoconsidered multilayer such as KNN or ML methods for positioning [26], one advantage of this machine is its fast response, perceptron (MLP). Although it is not demonstrated that MLP is much superior to other approaches, it has been trained in its training phase, as will be seen below. This property allows one to have such once as KNN or ML methods for positioning [26], one advantage of this machine is its fast response, a reduced system latency and, hence, process more estimations in less time. On the contrary, once it has been trained in its training phase, as will be seen below. This property allows one to methods, such as KNN or ML, have to compare the input fingerprint with the whole radio map, so havethat a reduced systemcost latency and, hence, process more estimations computational exponentially rises with the size of the radio map.in less time. On the contrary, methods,The such as KNN or ML, have to compare the input fingerprint with[54]. the Hence, whole radio MLP is well known for being a type of universal approximator it will map, be so that computational cost exponentially rises with the size of the radio map. possible that these ANNs learn the relation between the RSS vectors and the room ID where the tag The MLP(the is well known being a type ofemployed universalMLP approximator Hence, be possible is located output). Thefor architecture of the is sketched [54]. in Figure 5. Ititiswill composed of an input layer with neurons,between as many the as SRs, hidden layer neurons output that these ANNs learn theKrelation RSSone vectors and the with roomP ID whereand theantag is located layer with R neurons, as many as defined target rooms. All output neurons integrate a sigmoid (the output). The architecture of the employed MLP is sketched in Figure 5. It is composed of transference function, which limits the output range from zero tolayer one. To select the estimated an input layer with K neurons, as many as SRs, one hidden with P neurons and room, an output the corresponding output with the highest value will be chosen. layer with R neurons, as many as defined target rooms. All output neurons integrate a sigmoid In order to train the MLP, a training algorithm and a convergence criterion to stop the process transference function, which limits the output range from zero to one. To select the estimated room, when the goal is reached must be chosen. The training samples are the radio map fingerprints. Then, the corresponding output withbetween the highest chosen. the MLP will learn to map RSS value vectorswill andbe the associated spatial locations. To do so, a In order totraining train the MLP, a training algorithm andthe a convergence criterion stopneuron, the process supervised algorithm will update iteratively weights associated withtoeach whenoptimizing the goal them is reached must be chosen. The training samples are the fingerprints. to minimize a previously-defined cost function (usually theradio meanmap square error Then,(MSE)). the MLP will learn to map between RSS vectors and the associated spatial locations. This is done until the convergence condition is met. If the radio map is sufficiently good and To an aappropriate has been will selected, the iteratively training willthe beweights correctlyassociated performed,with and each do so, supervisedarchitecture training algorithm update therefore, classification RSS patterns never seen before cost by thefunction MLP (not(usually presented during neuron, optimizing them of to new minimize a previously-defined the meanthe square training phase) should be correctly classified within the proper room. This property is called error (MSE)). This is done until the convergence condition is met. If the radio map is sufficiently generalization, and it is what makes these mathematical tools really attractive for complex good and an appropriate architecture has been selected, the training will be correctly performed, classification problems. There are dozens of training procedures based on different algorithms, such
and therefore, classification of new RSS patterns never seen before by the MLP (not presented during the training phase) should be correctly classified within the proper room. This property is 7 called generalization, and it is what makes these mathematical tools really attractive for complex
Sensors 2016, 16, 4
8 of 23
classification problems. There are dozens of training procedures based on different algorithms, such as the gradient-descent method, Levenberg–Marquardt (LM) or the classical backpropagation algorithm [54]. Furthermore, some stop training criteria, such as regularization or early-stopping, Sensors 2015, 15, 0004 have been analyzed in order to avoid overfitting and improve generalization [54]. In this case, as the the gradient-descent method, Levenberg–Marquardt or the classical backpropagation we have employed Levenberg–Marquardt algorithm (LM) combined with the early-stopping method algorithm [54]. Furthermore, some stop training criteria, such as regularization or early-stopping, for its fast convergence and the good generalization results obtained [55]. The MLP architecture have been analyzed in order to avoid overfitting and improve generalization [54]. In this case, we (i.e., the transference function, number of hidden layers andwith neurons per layer) hasforbeen estimated have employed the Levenberg–Marquardt algorithm combined the early-stopping method its fast convergence and the good generalization results obtained [55]. The MLP architecture (i.e., the from a trial and error test; again, as in the site survey process, no clear guidance can be found in the transference function, number of hidden layers and neurons per layer) has been estimated from a literature. These parameters on survey the number ofclear inputs/outputs defined, trial and error test;also again,depend as in the site process, no guidance can be found in thealthough it has parameters alsowith depend of inputs/outputs defined, for although has performed in been observed literature. that oneThese hidden layer P on = the 16 number neurons will be enough the ittests been observed that one hidden layer with P = 16 neurons will be enough for the tests performed in this work, as will seen inbethe thisbe work, as will seenexperiments’ in the experiments’section. section.
Figure 5. Multilayer perceptron: Proposed architecture.
Figure 5. Multilayer perceptron: Proposed architecture. Furthermore, notice that for the ANN training, the fingerprints have been pre-filtered before employing them as ANN inputs. As mentioned before, each fingerprint is described by the temporal Furthermore, theFrom ANN training, the were fingerprints have been pre-filtered before N × Knotice R matrix that of RSS for values. this matrix, the outliers filtered out, and missed data from out of range of the SRs was substituted by a predefined value (the sensitivity of the hardware [23,27]). employing them as ANN inputs. As mentioned before, each fingerprint is described by the temporal Then, the real input of the MLP was the averaged RSS calculated from the N beacons transmitted by N ˆ K R matrixthe oftag. RSS values. From thisis matrix, the were filtered out,layer andof missed data from This pre-filtering function the same as the outliers one integrated in the pre-filtering the localization engine. out of range of the SRs was substituted by a predefined value (the sensitivity of the hardware [23,27]). Finally, after the training phase, the overall localization engine is tested, with the trained MLP Then, the real input of theinto MLP was thelayer. averaged calculated from the toN estimate beacons incorporated the classifier Tests willRSS be performed in the scenario the transmitted by localization error in each defined room. If the as errorthe goalone has been properly reached during the MLP the tag. This pre-filtering function is the same integrated in the pre-filtering layer of the training process and fits the service quality required in the pre-project phase, then the system will be localization engine. considered ready to operate in the online stage, and the setup will be over. If not, the site survey will be repeated, to add more fingerprints the radio localization map (e.g., repeating measurements in rooms Finally, after the training phase, the tooverall engine is tested, with the trained where the localization system is mostly failing), remaking the calibration process.
MLP incorporated into the classifier layer. Tests will be performed in the scenario to estimate the localization error eachPhase defined room. If the error goal has been properly reached during the MLP 4.2. in Planning training process and the phase service required the pre-project phase, then the Thefits planning aimsquality to give a first approach in to the number and position of the required SRs system will be before deploying the system in the real scenario. For every fingerprinting-based ILS, it is desired to considered ready to operate in the online stage, and the setup will be over. If not, the site survey will optimize these parameters to achieve better accuracy with the lowest cost possible. This is a task that be repeated, to add more fingerprints to the map (e.g., measurements is being pursued by several authors, butradio its analysis is not easyrepeating because of the complexity of radioin rooms where propagation indoors and the number of variables to take into account (antenna radiation pattern, the localization system is mostly failing), remaking the calibration process. scenario model, antenna orientation and position, etc.). Only a few have dared to give some approaches based on genetic algorithms, but considering simple assumptions and propagation 4.2. Planning Phase models [56,57]. In order to perform the planning phase, a simulation tool and a set of qualitative criteria or The planning phase to give a first to thecriteria number the required SRs helping “tips”aims have been considered. Theapproach following planning for the and initialposition positioning of of the SRs are listed below: before deploying the system in the real scenario. For every fingerprinting-based ILS, it is desired
8 to optimize these parameters to achieve better accuracy with the lowest cost possible. This is a task that is being pursued by several authors, but its analysis is not easy because of the complexity of radio propagation indoors and the number of variables to take into account (antenna radiation pattern, scenario model, antenna orientation and position, etc.). Only a few have dared to give some approaches based on genetic algorithms, but considering simple assumptions and propagation models [56,57]. In order to perform the planning phase, a simulation tool and a set of qualitative criteria or helping “tips” have been considered. The following planning criteria for the initial positioning of the SRs are listed below:
Sensors 2016, 16, 4
‚
‚ ‚
‚
‚
9 of 23
Consider valid locations to place the SRs; the antennas usually will be located next to walls/roofs or places where it is possible to fix their position without hindering the normal movement of people. A trade-off between accuracy and cost must be taken into account; the more antennas, the greater the accuracy [15–17,29,30], but also, a higher cost is incurred. The whole scenario Sensors 2015, 15, 0004 should be connected by at least one SR with 90% (connectivity criterion). Omnidirectional antennas are useful to report wide coverage regions, while directional antennas Consider valid locations to place the SRs; the antennas usually will be located next to can be added to give coverage to more specific zones. walls/roofs or places where it is possible to fix their position without hindering the normal In order movement to strengthen the accuracy in a specific room/area, directional antennas can be of people. A trade-off between accuracy cost must be taken ainto account; RSS the more antennas, the positioned, oriented toward that and direction. Thus, stronger should be captured by greater the accuracywhen [15–17,29,30], butis also, a higherin cost is incurred. that directional antenna the tag located the pointed area, generating more robust The whole scenario should be connected by at least one SR with 90% (connectivity criterion). RSS fingerprints. Omnidirectional antennas are useful to report wide coverage regions, while directional Antennasantennas must be separated to avoid similar measurements. can be added toenough give coverage to more specificRSS zones.
In order to strengthen the accuracy in a specific room/area, directional antennas can be
These criteria haveoriented been extracted from the experimental conducted positioned, toward thatempirically direction. Thus, a stronger RSS should betests captured by that and also directional in antenna when works the tag [24–30]. is located Finally, in the pointed more process robust from results obtained previous note area, that generating the planning will be RSS fingerprints. iteratively repeated until the system achieves a suitable performance in the whole scenario under Antennas must be separated enough to avoid similar RSS measurements. consideration of all of the defined rooms. These criteria have been extracted empirically from the experimental tests conducted and also
4.2.1. Directional Antennas from results obtained in previous works [24–30]. Finally, note that the planning process will be iteratively repeated until the system achieves a suitable performance in the whole scenario under
Fromconsideration previous works, has beenrooms. demonstrated that the localization performance based on RSS of all ofit the defined patterns increases with the number of SRs and their strategic position [56]. Then, it is intuitive to Directional Antennas think that 4.2.1. the more robust the RSS fingerprints are with respect to interference noise, the easier the From previous works, hasthe beentag demonstrated that the on RSSd has been learning process and estimationitof location will be.localization Thereby,performance previous based criterion patterns increases with the number of SRs and their strategic position [56]. Then, it is intuitive to laid down on this basis. To this aim, directional antennas are proposed to help this process by virtue think that the more robust the RSS fingerprints are with respect to interference noise, the easier the of their inherent spatialand filtering properties. These will antennas can be pointed towards a determined learning process estimation of the tag location be. Thereby, previous criterion d has been spatial region. Therefore, the level of beacons received fromto non-pointed will be laid down on this basis. ToRSS this aim, directional antennas are proposed help this processdirections by virtue of their inherent spatial filtering properties.ones, These obtaining antennas canstronger be pointedRSS towards a determined from the much lower than signals from the pointed measurements spatial region. Therefore, the RSS level of beacons received from non-pointed directions will be pointed sectors where the antenna’s main beam is steered. This fact let us think about directional much lower than signals from the pointed ones, obtaining stronger RSS measurements from the antennas to enhance RSS patterns associated withisasteered. particular region of interest. This pointed sectors where the antenna’s main beam This fact let us(area/room) think about directional can be qualitatively understood by observing Figure 6, where a comparison between omnidirectional antennas to enhance RSS patterns associated with a particular region (area/room) of interest. This can be qualitatively understood by observing Figure 6, where a comparison between (Figure 6a) and directional (Figure 6b) antenna coverage inside a fictitious scenario with three defined 6a) and directional (Figure 6b) antenna coverage inside a fictitious scenario areas (A1,omnidirectional A2 and A3) (Figure is shown. From this picture, it can be understood that the RSS captured by with three defined areas (A1, A2 and A3) is shown. From this picture, it can be understood that the the omnidirectional from a tag located each area willinbeeach similar if compared RSS capturedantenna by the omnidirectional antenna in from a tag located area will be similar ifto the RSS captured by the directional antenna pointed at A1. Thus, it can beThus, seenit that compared to the RSS captured bymainly the directional antenna mainly pointed at A1. can bethe seendirectional that the directional introduces a new variable, the orientation, whichtoallows one tothe increase antenna introduces a newantenna variable, the orientation, which allows one increase robustness of the robustness of the RSS features in the signal space and, in theory, should enhance the robustness the RSS features in the signal space and, in theory, should enhance the robustness of the RSS patterns of the RSS patterns associated with that area, increasing the success probabilities of detecting the tag associatedwhen withstaying that area, at A1.increasing the success probabilities of detecting the tag when staying at A1.
(a)
(b)
Figure 6. Scenario defined with three areas: A1, A2 and A3. Coverage comparison between
Figure 6. (a) Scenario defined with three A1, A2 and A3.oriented Coverage comparison between (a) the the omnidirectional antenna andareas: (b) the directional antenna toward A1. omnidirectional antenna and (b) the directional antenna oriented toward A1. 9
Sensors 2016, 16, 4
10 of 23
Sensors 2015, 15, 0004
4.2.2. Simulation Tool 4.2.2. Simulation Tool
A simulator tool was developed to aid during the planning phase. The software tool has simulator tool in wasMATLAB developed[58] to aid during the planning phase.the Thewhole software tool has been been fullyAimplemented and basically can emulate system, positioning fully implemented in MATLAB [58] and basically can emulate the whole system, positioning the the SR antennas, generating a radio map from simulated RSS fingerprints and training theSR ANN. generating a radio map from simulated RSS fingerprints and training the ANN. Then, the Then,antennas, the performance can be approximately predicted, emulating the online stage and analyzing the performance can be approximately predicted, emulating the online stage and analyzing the performance. In Figure 7 is illustrated the interface of the simulator tool, where the main interface performance. In Figure 7 is illustrated the interface of the simulator tool, where the main interface shows the digital map of a test scenario, and the RSS intensity is overlapped (in a range of red to shows the digital map of a test scenario, and the RSS intensity is overlapped (in a range of red to whitewhite colors) for afor selected SRSR (green triangles), theRSS RSSdistribution distribution along scenario. colors) a selected (green triangles),visualizing visualizing the along the the scenario. To this end, a full model of the scenario has been developed, including walls, rooms/areas To this end, a full model of the scenario has been developed, including walls, rooms/areas and and hardware characteristics, such as as thethe tag (PTXTX ) or antennas’ radiation pattern. hardware characteristics, such tagtransmission transmission power power (P ) or thethe antennas’ radiation pattern.
Figure 7. Interface of the ILS simulator.
Figure 7. Interface of the ILS simulator.
The RSS distribution is obtained by means of an IEEE 802.11 channel model found in [59]. This
The RSS distribution is obtained path-loss by means of an IEEE 802.11 channel model found in [59]. This model is based on the double-slope model. model is based on the double-slope path-loss model. ( )=
+
L pdq “ L0 `
+ 10 log( ) + W ÿ
Lw ` 10αlog pdq ` X
(1)
(1)
Equation (1) includes four terms: L0 (dB), which represents the signal losses at a reference w “1 distance of 1 m, Lw (dB), which is the contribution due to walls (and depends on the wall material [59]), path-loss term, whichLdepends α andrepresents d (the Euclidean distance between tag Equation (1) the includes four terms: which the signal losses at athereference 0 (dB), on and the SR, respectively) and X, a random variable related to the shadow fading effect, modelled by wall distance of 1 m, Lw (dB), which is the contribution due to walls (and depends on the a Gaussian-type random variable with zero mean (μ x = 0) and variance σx. material [59]), the path-loss term, which depends on α and d (the Euclidean distance between the
tag and the SR, respectively) and X, a random variable related to the shadow fading effect, modelled 1 (2) = by a Gaussian-type random variable with zero mean √2 (µ x = 0) and variance σ x . Furthermore, notice that α and σx will be defined as a2 function of the type of room (office, large ´x office, etc.). The path-loss coefficient depends on distance, changing from a break point distance (dBP), 1 2 X “ ? e 2σx (2) as explained in [59]. 2π Regarding the system performance evaluation for the planning phase, the figures of merit to assess the system accuracy introduced next subsection. Furthermore, notice that are α and σ will in bethe defined as a function of the type of room (office, large x
office, etc.). The path-loss coefficient depends on distance, changing from a break point distance (dBP ), as explained in [59]. 10 for the planning phase, the figures of merit to Regarding the system performance evaluation assess the system accuracy are introduced in the next subsection.
Sensors 2016, 16, 4
11 of 23
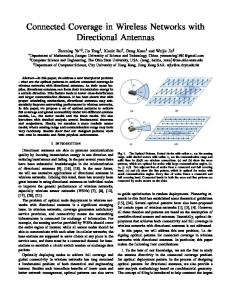
4.2.3. System Performance Different metrics can be defined to express the ILS performance, depending on the output type provided by the system [16]. Point-based ILSs give the coordinates (X,Y) where the tag may be located. In these cases, the error can be calculated from the Euclidean distance between the estimated tag location (X’,Y’) and the exact one (X,Y). Furthermore, system precision is defined as the radius of the disk where the tag is positioned under a certain probability (usually established as 90%). However, in a room-level ILS case, the output of the localization engine is the room ID (Ri ) in which the tag is positioned. Thus, error cannot be calculated from the Euclidean distance, but as the percentage of times the true room (i.e., the room where the object is located) is estimated. This is usually known as the classification success probability (PS ), which can be mathematically expressed as follows: Number of successful estimations (3) PS “ Total estimations In addition to PS , which represents a global system performance parameter, we will also consider the success probability associated with a pair of rooms i, j (PSij ), defined as the probability of selecting the room i, room j being the true room where the tag is located. Therefore, an RxR probability matrix (PM) is obtained when all combinations are calculated. This matrix is interesting because it offers detailed information about the correlation between rooms and how likely two rooms may be confused. Note that the main diagonal of the PM matrix (PSij with I = j) corresponds to the success probability per room, i.e., the success probability to locate the tag in room Ri , when the tag is located in that room. ¨ ˛ PS11 . . . PS1R ˚ .. ‹ .. PM “ ˝ ... (4) . . ‚ PSR1 . . . PSRR These metrics offer valuable information that can be employed in the experimental test phase to analyze the accuracy of the system, allowing the analysis of the system performance in a general way or, specifically, in a particular room. 4.2.4. Simulation Tool Furthermore, related to the planning phase, the connectivity concept is an important figure of merit to take into account, as it is related to the visibility of the tag from the SRs. This is an important concept for the planning phase, since the localization engine needs RSS data to infer the tag location. Hence, the more SRs are connected to the tag, the more RSSs will be captured and, hence, the more accurate will be the location estimation. Connectivity is related to the probability of received packet (PRP), and statistically, it can be defined for any k-th SR as: n (5) PRP “ N with n the number of received beacons measured by the k-th SR, over the total number of transmitted packets by the tag (N). Therefore, if an SR has not received any beacon from the tag (PRP = 0), that SR will be considered as “non-connected” to that location, with a PRP = 0. This probability is a function of the RSS, as demonstrated in Figure 8, where the PRP calculated experimentally is shown. This graph shows the average percentage of received beacons when an RSS level is measured. As observed, a log-sigmoid function is able to approach the cloud of measurements. It should be noted that this probability of receiving a beacon is practically PRP = 1 when the measured RSS is greater than ´80 dBm. However, PRP falls down sharply till PRP = 0.5 for RSS = ´86 dBm and is almost null (PRP = 0) when the RSS is below ´90 dBm. This is in line with our expectations, as below the sensitivity of the SR hardware (which is ´90 dBm), no measurements (or a very low number of them) should be obtained. Therefore, it can be derived that in
Sensors 2015, 15, 0004 Sensors 2016, 16, 4
12 of 23
0.8 0.6 0.4 0.2
Measured RSSI Estimated Model
1 Probability of Received Packet
Probability of Received Packet
These results reveal that the planning criteria can be laid down to meet a minimum PRP to ensure that useful RSS features are provided to the localization server most of the time [27]. Sensors 2015, 15, 0004 order to guarantee a PRP > 90% in the whole scenario, the SRs must receive beacons with a minimum RSS of ´83These dBm. These results reveal thatcriteria the planning criteria bea laid down to to meet a minimum results reveal that the planning can be laid down tocan meet minimum PRP ensure 1 that useful RSS features are provided to the localization server most of the time [27]. PRP to ensure that useful RSS features are provided to the localization server most of the time [27].
Measured RSSI Estimated Model
0.8 0.6 0.4 0.2
0 0 -70 -100 -100 -90 -90 -80-80 -70
-60 -60 RSS
RSS
-50 -50 -40 -40-30
-20 -30
-20
Figure 8. Probability of receivedpacket packet (PRP) received signalsignal strength. Figure 8. Probability of received (PRP)vs.vs. received strength. Figure 8. Probability of received packet (PRP) vs. received signal strength.
5. Experimental Tests
5. Experimental Tests 5. Experimental Teststo evaluate a prototype of the system, we conducted extensive experiments in an office In order facility different atypes of areas. The map is depicted in Figure 9 and has a size of 431.8 m2. In order towith evaluate prototype of location the system, we conducted extensive experiments in an In order toscenario evaluate a prototype ofenvironment the system,with wefurniture, conducted extensive experiments in an office This represents a typical people working, opening/closing office facility with different types of areas. The location map is depicted in Figure 9 and has 2a doors and commercial electronic devices (computers, WiFi networks, etc.). has The a map facility with different types of areas. The location map is routers, depicted in Figure 9 and sizehas of 431.8 m . 2 . This size of 431.8 mdivided scenario represents a typical environment with furniture, people working, been represents into five rooms ofenvironment interest: two offices, store, onepeople garage and a backyard. The This scenario a typical with one furniture, working, opening/closing opening/closing doors and commercial electronic devices (computers, routers, WiFi networks, etc.). system has been designed with a total number of seventeen SRs positioned around the building at doors and commercial electronic devices (computers, routers, WiFi networks, etc.). The map has reference points: fivefive SRs with omnidirectional (OA1–OA5) twelveone SRs garage with The map different has been divided into rooms of interest:antennas two offices, oneand store, and a been divided into five rooms of interest: two offices, one one garage and athebackyard. The antennas (DA1–DA12). Thewith defined roomsnumber and store, the of location/orientation SRs around backyard. directional The system has been designed a total seventeen SRs of positioned in the scenario seen. Note thatofbefore the deployment of the system, the planning system hasdeployed been designed withcana be total number seventeen SRs positioned around the building at the building at different reference points: five the SRsindoor withenvironment omnidirectional antennas (OA1–OA5) and phase was points: previously performed, simulating and selecting the SRs’ initial SRs with different reference five SRs with omnidirectional antennas (OA1–OA5) and twelve twelve SRspositions. with directional antennas (DA1–DA12). The rooms thewas location/orientation A connectivity of PRP > 90% to at least one SR fromdefined any location of theand scenario ensured. directional antennas (DA1–DA12). The defined rooms and the location/orientation of the SRs of the SRs deployed in the scenario can be seen. Note that before the deployment of the system, the deployed in the scenario can be seen. Note that before the deployment of the system, the planning planning phase was previously performed, simulating the indoor environment and selecting the SRs’ phase was previously performed, simulating the indoor environment and selecting the SRs’ initial initial positions. A connectivity of PRP > 90% to at least one SR from any location of the scenario positions. A connectivity of PRP > 90% to at least one SR from any location of the scenario was ensured. was ensured.
Figure 9. Experimental site and the sensor readers (SRs) deployed. Red arrows indicate the orientation of directional antennas.
12
Figure arrows indicate thethe orientation of Figure 9. 9. Experimental Experimentalsite siteand andthe thesensor sensorreaders readers(SRs) (SRs)deployed. deployed.Red Red arrows indicate orientation directional antennas. of directional antennas.
12
Sensors 2016, 16, 4
13 of 23
To analyze the effect of integrating directional antennas on the system performance, different configurations of SRs with different numbers and types of antennas (directional/omnidirectional Sensors 2015, 15, 0004 antennas) have been tested. For each configuration, the overall success probability PS and specific To analyzeNext, the effect integrating antennas on the system performance, PM were calculated. we of describe thedirectional deployment of the prototype system ondifferent the real scenario. configurations of SRs with different numbers and types of antennas (directional/omnidirectional Later, a discussion is also given about the experimental results regarding the effect of different antennas) have been tested. For each configuration, the overall success probability PS and specific configurations ofcalculated. omnidirectional/directional antennas. PM were Next, we describe the deployment of the prototype system on the real scenario. Later, a discussion is also given about the experimental results regarding the effect of different
5.1. System Prototype of omnidirectional/directional antennas. configurations
Figure illustrates 5.1.10 System Prototypethe hardware employed for the system prototype. The SR and tag prototypes (Figure 10a,b, respectively) have been designed based on the CC2510 chip [60] offered by Texas Figure 10 illustrates the hardware employed for the system prototype. The SR and tag Instruments (TI). These chips integrate diverse functionalities to operate asbytransceivers prototypes (Figurecommercial 10a,b, respectively) have been designed based on the CC2510 chip [60] offered Texas Instruments (TI).All These commercial chips integrate diverseand functionalities to operate as and also to capture the RSS. related communication protocols middleware were programmed transceivers through and also tothe capture the RSS. All(development related communication protocols and middleware in the C language CC2510DK kit), also offered by TI. Thewere tag prototype programmed in the C language through the CC2510DK (development kit), also offered by TI. The incorporates an integrated PCB slot antenna with vertical polarization and a quasi-omnidirectional tag prototype incorporates an integrated PCB slot antenna with vertical polarization and a pattern inquasi-omnidirectional the XY plane (assuming vertical orientation the tag). Both devices operate pattern ina the XY plane (assumingof a vertical orientation of the tag). Both in the ISM devices operate in the ISM band (2.45 GHz). band (2.45 GHz).
(a)
(b)
(c)
(d)
Figure 10. Hardware devices: (a) tag and (b) four sensor reader prototypes based on TI CC2510
Figure 10. Hardware devices: (a) antennas tag and(TP-Link): (b) four(c)sensor reader TL-ANT2408C prototypes antenna based on modules. Employed commercial omnidirectional and TI CC2510 modules.(d) Employed commercialantenna antennas (c) omnidirectional TL-ANT2408C antenna and directional TL-ANT2406A with (TP-Link): associated XY-plane radiation patterns (vertical polarization). (d) directional TL-ANT2406A antenna with associated XY-plane radiation patterns (vertical polarization).
Each SR device has an RP-SMA (Reverse-Polarity SubMiniature version A) connector allowing it to have an external antenna plugged in. In this case, each SR can be connected to either an external or directional antenna. Two commercial antennas from TP-Link have A) beenconnector acquired allowing Eachomnidirectional SR device has an RP-SMA (Reverse-Polarity SubMiniature version investigations. In this case, the (OA) with 8 dBian external havefor anour external antenna plugged in.TL-ANT2408C In this case,omnidirectional each SR can antenna be connected to an either
it to 13 omnidirectional or directional antenna. Two commercial antennas from TP-Link have been acquired for our investigations. In this case, the TL-ANT2408C omnidirectional antenna (OA) with an 8 dBi gain (Figure 10c) and the TL-ANT2406A directional antenna (DA) with a 120˝ horizontal half-power beam width and a 6 dBi gain (Figure 10d) were chosen. In Figure 11, the set of tripods with the SR antennas installed in order to locate the antennas in the scenario for the experiments is shown. These
Sensors 2016, 16, 4
14 of 23 Sensors 2015, 15, 0004
tripods are prepared with a support, which is able to hold up to four antennas: one omnidirectional gain (Figure 10c) and the TL-ANT2406A directional antenna (DA) with a 120° horizontal half-power ˝ and three oriented directional antennas to cover sectors of approximately 120˝ . antenna to coverbeam 360width and a 6 dBi gain (Figure 10d) were chosen. In Figure 11, the set of tripods with the SR antennas installed order to locate thetripod antennas has in theascenario for the experiments the is shown. These The tripods are two meters ininheight. Each box encapsulating SR prototypes, which tripods are prepared with a support, which is able to hold up to four antennas: one omnidirectional are connected toantenna the corresponding antennas via RP-SMA. In this first prototype, USB connectors to cover 360° and three oriented directional antennas to cover sectors of approximately 120°. are two in height. Eachwith tripod has encapsulating the SR prototypes, which feeds the SRs have been used The fortripods the SRs tometers communicate thea box server. Furthermore, the USB are connected to the corresponding antennas via RP-SMA. In this first prototype, USB connectors hardware by itshave 5-Vbeen output. Future versions are being developed to employ Power over Ethernet used for the SRs to communicate with the server. Furthermore, the USB feeds the SRs (PoE) technology in order longer, less expensive and tofaster between hardware by its to 5-V get output. Future versions are being developed employconnection Power over Ethernet (PoE) SRs and the technology in order to get longer, less expensive and faster connection between SRs and the server. server. These tripods are located with the indicated antennas, according to the planning phase, at the These tripods are located with the indicated antennas, according to the planning phase, at the locations depicted in Figure locations depicted9.in Figure 9.
(a)
(b)
(c)
Figure 11. Deployed tripod examples. (a) Tripod with support to hold three DAs and one OA; (b) zoom tripod on the support and antennas; zoom on with the box support with encapsulated SRs inside; Figure 11. Deployed examples. (a)(c)Tripod to hold threeRP-SMA DAs and connect the SR to the antennas; the USB output cable connects the SRs to the server through a (b) zoom on thecables support and antennas; (c) zoom on the box with encapsulated SRs inside; USB hub (which is embedded inside the box, with the SRs).
one OA; RP-SMA cables connect the SR to the antennas; the USB output cable connects the SRs to the server through a 5.2. Experimental Setup inside the box, with the SRs). USB hub (which is embedded
Following the deployment cycle described in Figure 2, the indoor scenario was analyzed and the radio map generated. This process was managed according to the flowchart of Figure 4 to 5.2. Experimentalperform Setupthe site survey process. Remember that this process is extremely relevant, since depending on how the radio map is built, it will represent in a more reliable way the irregularities and features Following the deployment cycle channel described in Figure 2, the indoor scenario was analyzed and the of the indoor electromagnetic [17,18,26]. During the process calibration was phase,managed a person walks around theto scenario, with one transmitter tag 4 to perform radio map generated. This according the flowchart of Figure fixed to his or her chest and the Android device with the site survey tool to indicate the location and the site survey process. Remember thatremotely, this process is extremely since depending on how control the fingerprint generation as indicated in the previousrelevant, section. The Android device to run siterepresent survey tool was Ericsson Xperiaway Neo V (Android Version 4.0.4). Thisfeatures of the the radio map isused built, it the will in aa Sony more reliable the irregularities and device was linked to the server through a WiFi network (802.11b). It should be noted that, in order to
indoor electromagnetic channel [17,18,26]. During the calibration phase, a person walks around the scenario, with one transmitter tag fixed 14 to his or her chest and the Android device with the site survey tool to indicate the location and control the fingerprint generation remotely, as indicated in the previous section. The Android device used to run the site survey tool was a Sony Ericsson Xperia Neo V (Android Version 4.0.4). This device was linked to the server through a WiFi network (802.11b). It should be noted that, in order to obtain a more diverse radio map, three additional people with different heights and complexions repeated the same process. The configuration parameters used to generate the fingerprints were: i ii iii
Tag transmission power PTX = 0 dBm, Number of beacons per tag transmission N = 20, Refresh transmission time T = 500 ms.
With these settings, one fingerprint was generated approximately per second, with 20 RSS measures captured per SR. These measurements were associated with the room ID where the tag (the
Sensors 2016, 16, 4
15 of 23
user) was located at that time. A total radio map with 1095 fingerprints was created for the current indoor environment approximately in 25 min, taking different random paths/pathways inside each one of the five target rooms/areas defined in the testing scenario. Furthermore, note that missed RSS data (generated by out of range SRs) were replaced by a fixed value of ´90 dBm (the sensitivity of the SR receiver) for mathematical purposes, in order to keep numerical values for the ANN in the subsequent calibration phase. In Table 1 is specified the total number of samples generated per room and the sample density per square meter. From these results, note that an average density of 2.5 samples/m2 was kept, R2 being the room with the highest density. Table 1. Number of gathered fingerprints inside the scenario (431.8 m2 ). R1
R2
R3
R4
R5
Total
# Samples 86 Samples/m2 3.5
137 5.6
264 2.7
438 1.9
170 3.0
1095 2.5
The site survey was repeated at different time frames throughout the day (the morning, the noon and afternoon), in order to sample the indoor channel properly. This is a recommended practice, since as mentioned before, RSS measurements are quite affected by temperature and humidity variations across the day or the dynamic changes in the environment [19]. It is also worthy to note that the site survey tool was demonstrated to be very useful for the offline stage, optimizing the radio map generation, especially in terms of manpower and consuming time and without needing additional techniques to minimize radio map generation efforts, as proposed in other works [18]; a fast generation of 50 fingerprints per minute can be reached. Furthermore, for future investigations, other additional data of interest were recorded during the site survey, such as the (X,Y) coordinates (also provided by the user through the Android device) or the tag orientation (readily provided by the digital compass of the Android device). Furthermore, in order to speed up the process, a future version is currently being programmed, which will allow one to generate in parallel fingerprints by a collaborative method based on employing several tags at the same time to generate the radio map. This will enormously reduce the time consumption dedicated to the site survey. After the radio map generation, the calibration phase was managed to train the ANN. For the training process, the MATLAB Neural Network Toolbox (2011 version) [58] was utilized. This library furnishes several functions to create, train and test MLPs. This process takes place in the server, which was run by an ASUS Quad-Core Intel Core i7 2.4 GHz with 4 GB RAM. Regarding the MLP architecture, a hidden layer with 16 neurons was chosen for every configuration. This parameter was obtained from trial and error, observing the minimization of the generalization error for the worst configuration, i.e., when all 17 SRs are selected, which corresponds to the case with the highest number of entries to be processed by the ANN. The calibration process must be performed for each one of the chosen SR configurations. To do so, for each selected configuration with N’ antennas (N’ < N), an ANN was trained taking the corresponding subset of N’ RSS features from the radio map corresponding to the selected N’ SRs employed to infer the tag location. During the ANN training process, the generated radio map was divided randomly into three sets: a training set of 766 samples (70% of the radio map) to update the network weights iteratively by the training algorithm, a test set of 220 samples (20%) to assess the generalization error of the MLP during the training process and a verification set of 110 samples (10%) in order to evaluate the stop training criterion [57,58]. Then, the ANN training process randomly initializes the numerical weights associated with each neuron. Each training step will try to find the most suitable weights to associate the input data (RSS vectors) with the desired output (room ID). For this purpose, the Levenberg–Marquardt algorithm was chosen for its memory and time efficiency [57]. Approximately, the training process reaches the convergence criterion for any SR configuration in less than 200 epochs (less than 2 min). This process was repeated several
Sensors 2015, 15, 0004
Sensors 2016, 16, 4 16 of 23 in order to evaluate the stop training criterion [57,58]. Then, the ANN training process randomly initializes the numerical weights associated with each neuron. Each training step will try to find the most suitable weights to associate the input data (RSS vectors) with the desired output (room ID). times, reinitializing MLP initial weights and the training, verification and sets. and Then, For this purpose, the Levenberg–Marquardt algorithm was chosen for its test memory timethe trained efficiency Approximately, the training processperformance) reaches the convergence criterion for any SR Later, the network with the [57]. least generalization error (best achieved was chosen. less than neural 200 epochs (less than 2 min). This process repeated several times, weights ofconfiguration the chosenin trained network were stored in the was localization engine database, to reinitializing MLP initial weights and the training, verification and test sets. Then, the trained be accessed in the future during the online stage by the localization engine. network with the least generalization error (best performance) achieved was chosen. Later, the weights of the chosen trained neural network were stored in the localization engine database, to be 5.3. Test and Results accessed in the future during the online stage by the localization engine.
More5.3. than 200 SR configurations have been set for different combinations of directional and Test and Results omnidirectional antennas chosen from the initial deployed set with 17 SRs. In order to evaluate the More than 200 SR configurations have been set for different combinations of directional and system performance forantennas each configuration, a pathway was established be to followed by the users omnidirectional chosen from the initial deployed set with 17 SRs. Into order evaluate the throughout the whole scenario, asconfiguration, observed ina Figure pathway has been by designed system performance for each pathway12. wasThe established to be followed the usersto go over throughout the whole observed in Figure 12. The pathway been designed go over all of the target rooms. As in scenario, the site as survey process, different peoplehas carried the tag to fixed to their chest all of the target rooms. As in the site survey process, different people carried the tag fixed to their to perform the tests with the tag transmitting beacons periodically as the person moves all over the chest to perform the tests with the tag transmitting beacons periodically as the person moves all over defined areas. Therefore, the reliability of the of system is tested in quite conditions, taking the defined areas. Therefore, the reliability the system is tested in quitehard hard realistic realistic conditions, into account that people movement and body orientation are increasing the RSS temporal taking into account that people movement and body orientation are increasing the RSS temporalfluctuation even more [30]. even morefluctuation [30].
Figure 12. Pathway followed blue) by during experimental tests. Figure 12. Pathway followed (in(inblue) bythe theusers users during experimental tests.
The pathways were followed in both directions, and the tests were repeated daily at different time frames were during followed one week. During thedirections, tests, the system operating in its online stage,daily and the The pathways in both andwas the tests were repeated at different tag during was configured to transmit N = the 10 beacons periodically shorter refresh timeonline of time frames one week. During tests, the systemwith wasa operating in its stage, T = 250 ms (higher N and lower T values would overload the system). The tag power transmission and the tag was configured to transmit N = 10 beacons periodically with a shorter refresh time of was PTX = 0 dBm (as previously established during the site-survey process, to ensure connectivity T = 250 ms (higher T values would overload system). The Hence, tag power between theN tagand andlower all of the SRs along the whole scenariothe most of the time). about transmission 500 positions were inferred for each pathway (four per second during 2 min of walking). Finally, a total was PTX = 0 dBm (as previously established during the site-survey process, to ensure connectivity of 27tag testsand were all performed. between the of the SRs along the whole scenario most of the time). Hence, about The probability matrix PM presented in Equation (4) was calculated from the test results for 500 positions were inferred for each pathway (four per second during 2 min of walking). Finally, every SR configuration. The PSij per each room was easily obtained from the main diagonal of the a total of 27 tests were performed. The probability matrix PM presented in Equation (4) was calculated from the test results for 16 every SR configuration. The PSij per each room was easily obtained from the main diagonal of the PM. The overall PS was also obtained applying Equation (3), dividing the total number of successful estimations over the total number of estimations carried out during the test. Table 2 presents the results for the most outstanding SR configurations in terms of location success probability (PS ). The table represents the minimum performance (per room and global) obtained for 90% of the 27 tests performed per each configuration. Furthermore, in order to give a deeper comprehension of the results presented in Table 2, Figure 13 shows a box-and-whisker plot with further information about the overall PS resulting from the 27 tests performed for each SR configuration analyzed in Table 2. This analysis has been conducted using MATLAB function “boxplot”, given the calculated PS resulting from each test. In each plot, the central mark is the
deeper comprehension of the results presented in Table 2, Figure 13 shows a box-and-whisker plot with further information about the overall PS resulting from the 27 tests performed for each SR configuration analyzed in Table 2. This analysis has been conducted using MATLAB function “boxplot”, given the calculated PS resulting from each test. In each plot, the central mark is the median PS obtained for each configuration, the edges of the box are the 25th and 75th percentiles; the Sensors 2016, 16, 4 17 of 23 whiskers extend to the most extreme resulting PS values (not considered as outliers); and the considered outliers are plotted individually as red crosses.
median PS obtained for each configuration, the edges of the box are the 25th and 75th percentiles; Table 2. Success probability per room PSr (r-th room) and overall PS. the whiskers extend to the most extreme resulting PS values (not considered as outliers); and the considered plottedID individually red Ps crosses. # outliers are Antennas Ps1as(%) 2 (%) Ps3 (%) Ps4 (%) Ps5 (%) Ps (%) 1
3 OA = {2,3,4} 17 7.8 18.3 68.5 39.8 Table 2. Success probability per room PSr (r-th room) and overall PS . 3 OA = {1,2,3} 18.2 6.7 52.3 62.1 44.6
2 # 1 2 3 4 5 6 7 8 9 10 11 12
3
5 OA Antennas ID= {1–5} DA = {1,10} 3 OA =2{2,3,4}
21.3 Ps (%) 7.1 Ps1 (%) 2 4 36.1 17 67.4 7.8 3 OA =3 {1,2,3} 18.2 69.7 6.7 5 DA = {1,5,11} 39.9 5 OA = {1–5} 21.3 7.1 6 5 DA = {1,2,5,8,10} 73.5 81.1 2 DA = {1,10} 67.4 36.1 7 8 DA = {3,4,5,6,7,9,11,12} 69.7 13.9 32.4 3 DA = {1,5,11} 39.9 73.5 72.3 81.1 8 5 DA = {1,2,5,8,10} 12 DA = {1–12} 85.0 8 DA = {3,4,5,6,7,9,11,12} 13.9 32.4 9 3 OA = {2,3,4} + 1 DA = {1} 71.4 38.5 12 DA = {1–12} 72.3 85.0 OA = + {2,3,4} DA = {2} 71.4 20.6 74.0 310 OA =3{2,3,4} 1 DA+=1{1} 38.5 311 OA =3 {2,3,4} + 1 DA = {2} 20.6 74.0 OA = {2,3,4} + 2 DA = {1,2} 70.8 74.4 3 OA = {2,3,4} + 2 DA = {1,2} 70.8 74.4 12 =5{1-5} OA =+ {1-5} + 12 DA = {1–12}79.4 79.4 84.0 5 OA 12 DA = {1–12} 84.0
51.3 Ps 3 (%) 36.0 18.3 52.3 57.1 51.3 71.4 36.0 74.4 57.1 71.4 77.6 74.4 41.3 77.6 45.1 41.3 45.1 68.9 68.9 74.6 74.6
43.9 52.5
68.1 53.8 Ps (%) Ps4 (%) 44.7Ps5 (%) 65.168.5 47.9 39.8 54.5 43.9 60.662.1 52.6 44.6 65.4 52.5 70.468.1 55.1 44.7 75.7 53.8 65.1 47.9 54.5 81.860.6 49.8 52.6 63.4 65.4 82.270.4 62.1 55.1 80.7 75.7 81.8 49.8 63.4 68.5 48.4 63.9 82.2 62.1 80.7 64.368.5 52.2 48.4 59.9 63.9 83.264.3 53.2 52.2 79.4 59.9 83.2 53.2 79.4 82.582.5 57.1 57.1 81.0 81.0
90 Overall PS (%)
80 70 60 50 40 30 1
2
3
4
5 6 7 8 9 SR Configuration (#)
10
11
12
Figure 13. Box-and-whisker plot from2727test testpathways pathways configurations Figure 13. Box-and-whisker plotfor forthe thePPSS resulting resulting from for for the the configurations presented in Table presented in Table 2. 2.
5.4. Discussion
17
Comparing the overall performance obtained for every configuration, it is clearly observed that the planning of the SRs is relevant, since different configurations of SRs may result in very different performances of the system for the same scenario. It is revealed that the more SRs, in general, the better the system performance achieved, according to the conclusions of [16,29,30]. However, it has been observed that this tendency is not always accomplished. Observing several configurations with the same or even a greater number of antennas, independently of the antenna type, it is shown that the same configurations with different SRs can obtain quite dissimilar performances, even degrading it if no proper antennas are included for the tag estimation. Regarding this phenomena, in Table 1, some of the configurations can be compared, and it can be conclude that adding more antennas is not always a feasible solution to enhance PS . This is clearly appreciated comparing Configuration #1 vs. #2, with three OAs each, for which different performances (44% and 52%, respectively) with the same number of OAs were obtained. Furthermore, this can be observed if we compare Configuration
Sensors 2016, 16, 4
18 of 23
#2 vs. #3, where the performance keeps constant with 53%, despite that two more OAs being employed for the location estimation in Configuration #3. Furthermore, observing Configuration #6 against #7, with five and eight Das, respectively, the performance decreases from 75.7% to 63.4%. From these observations, it can be derived that the increase of the number of antennas does not always enhance the performance, but planning must be also taken into account properly, since adding antennas arbitrarily might even produce the opposite effect. Regarding the inclusion of directional antennas, the results also confirm our assumptions about the spatial filtering properties to enhance the fingerprints’ robustness and quality. It can be observed how the integration of directional antennas may improve performance in some rooms. This is proven by observing the performances obtained for Rooms 1 and 2 (corresponding to two offices with a similar area of 24.5 m2 ) in Configurations #1, #9, #10 and #11. The employment of just OAs in Configuration #1 does not improve the performance inside those rooms, it being not possible to distinguish between them, and attaining a poorer performance inside these areas: PS1 = 17% and PS2 = 7.8%. However, the insertion of a directional antenna may improve performance, as can be noted comparing Configurations #9 and #10, where DA1 and DA2 are included respectively, increasing significantly the performance in R1 and R2 up to PS1 = 71.4% and PS2 = 74%, respectively, with respect to the firs cited configuration with only three OAs. Finally, DA1 and DA2 are combined with three OAs in Configuration #11, and a significant improvement for rooms R1 and R2 is achieved (PS1 = 70.8% and PS2 = 74.4%) at the same time, increasing the overall performance up to 79.4%. This example clearly demonstrates how the insertion of Das, suitably oriented and positioned, may further improve the performance in certain rooms due to the spatial discrimination enhancement associated with directive antennas, confirming our initial hypothesis. It should be also noted that comparing previous Configuration #11 (with three OAs and two DAs) with #6 (with 12 DAs) and #12 (with five AOs and 12 DAs), a similar performance is obtained, corroborating that the inclusion of more antennas is not worthwhile in this experimental case. Hence, it is clearly demonstrated how a properly deployed five-antenna configuration (#11), which combines three OAs and two DAs, is able to obtain almost the same performance as for configurations with 12 (#6) and 17 (#12) antennas, respectively. These observations lead us again to remark on the importance of the planning phase and how properly positioning and orienting the SR antennas, the number of required SRs can be drastically reduced to optimize the performance of the system with the minimum number of antennas. Finally, notice that the 25th and 75th percentiles (limits of the blue boxes in Figure 13) are really close for Configurations #6, #11 and #12. This means that the performance achieved for these configurations is stable between those values (about 82.5% and 87.5% for Configuration #11) for almost every test performed. To sum up, several conclusions can be highlighted from this study: i
ii
iii
It has been observed that the monotonically-increasing tendency of accuracy (successes probability) with the number of antennas is not totally true. The planning phase (antennas’ position) affects the performance of the system severely. DAs may improve the accuracy of the system if they are properly deployed and oriented, allowing a better distinction between target areas (rooms) without excessively increasing the number of antennas. During the experiments, this is demonstrated with a configuration with five antennas (three AOs and two ADs), which results in a similar performance as the one obtained by 17 antennas (five AOs and 12 ADs). The above point endorses that the integration of DAs increases the fingerprint quality, making RSS patterns more robust against noise and more easily recognizable by the MLP algorithm.
From these remarks, it is evidenced that the addition of directional antennas enhances the performance of RSS-based systems if SRs are deployed properly. However, as mentioned previously, RSS-based systems are linked to an inherent limitation in terms of maximum accuracy due to the
Sensors 2016, 16, 4
19 of 23
complex unpredictable variability of the RSS [16], that together with the ANN error, makes the ANN not be able to predict the room location with 100% success. At this point, it would be also interesting to compare our results with the state-of-the-art woks. To do so, we have taken into account the most recent references found in the literature related to room-level RSS-based positioning [21–23]. If we try to compare our best results in terms of accuracy and number of antennas directly, which has been for Configuration #11 Ps (90%) = 79.4% (with five antennas), it seems we have a priori inferior results compared to the over 90% average success results obtained in [21–23]. However, it is important be take into account several points to compare our results to others: ‚ ‚
‚
‚
The metric we have employed is quite demanding, as we calculate the minimum Ps obtained for 90% of the tests, which gives an estimation of the system reliability for 90% of the time. The work in [21–23] provided average Ps, which is the mean of all of the tests conducted. This metric is much poorer, as it does not talk about the reliability of the system and takes into account outliers. In fact, if we averaged the Ps results for the 27 tests done with Configuration 11, our average success Ps (average) = 86% (see the red line in the middle of the box for Configuration #11 in Figure 13), which seems to be much better, but it has no information about reliability. However, another factor to take into account is the test conditions. The covered area, as the number of SR in [21–23], is quite different. For example, in [23], 17 omnidirectional antennas were employed. Furthermore, no information regarding the conditions of the tag or the scenario is given (e.g., some questions related to the static, fixed orientation of the tag during transmission/ reception; people presence in the environment).
In this paper, we have employed a simple MLP-based indoor positioning system to analyze the directional antennas’ effect on the positioning performance. However, it is worthy to note that to overcome the system limitations, extra information from other data sources (e.g., accelerometers or other sensors, such as infrared) or building geometry, could be integrated in the post-processing layer engine [32], in order to refine the raw estimation obtained from the classifier layer, although at the expense of increasing system complexity and computational cost. To this aim, several algorithms and techniques have already been largely studied [21–23,31–35] that could be combined with our system for future studies. To finalize, another point that is interesting to remark on before concluding this section is that similar conclusions are expected if another classifier, such as KNN, ML or SVM, is employed in the location engine, instead of the MLP. The authors obtained similar results to the ones presented in Table 2 and Figure 13 employing the KNN classifier; however, for the sake of space, and to focus on the principal concern of this paper, we have presented the results for an MLP, which is a well-known classifier that has been demonstrated to be stable and advantageous compared to others in terms of time response (which is quite important to run the prototype during the tests). 6. Conclusions The present paper addresses the integration of directional antennas to enhance the performance of receive signal strength (RSS) fingerprinting-based indoor localization systems (ILS). A room-level RSS fingerprinting-based ILS has been developed for research purposes, with a localization engine based on an artificial neural network (ANN) to infer the tag position. The system architecture is based on a sensor network composed of a set of K sensor readers (SRs), each one connected to an external omnidirectional or directional antenna, which are in charge of measuring the RSS from the beacons transmitted by the tag. A centralized server will infer the tag position in real time from the RSSs gathered by the SRs. A full deployment process of the sensor network is described. A planning phase was previously performed, aided by our own simulation tool, to estimate the number and position/orientation of omnidirectional/directional antennas in order to optimize the system
Sensors 2016, 16, 4
20 of 23
performance. After planning, the physical deployment of the sensor network is chosen, and a site survey process is conducted to generate a radio map with fingerprints that rigorously characterizes the indoor environment. A final calibration phase is used to train the ANNs with the radio map data in order to infer the possible tag positions from the RSS fingerprints. A prototype has been deployed in a real scenario of 432 m2 used as the experimental testbed. The scenario represents the conditions of typical office environment activity. Different combinations of omnidirectional and directional antennas have been intensively studied to analyze the effect of antenna type to increase the probability of positioning the tag in the true room. A radio map with more than 1000 fingerprints was generated in an efficient way, by the aid of our own software tools developed in C#, Java and MATLAB, allowing generating fingerprints very quickly and cost-effectively. Furthermore, different test pathways performed by different people were used to better characterize and evaluate the system performance during the experiments. In general, the results demonstrate our initial hypothesis, which established that adding directional antennas, suitably oriented and positioned, introduces a new degree of freedom (and novelty), which increases the quality of the RSS fingerprints, ultimately enhancing the room discrimination realized by the ANNs. This way, it has been demonstrated that in most of the configurations evaluated, the localization performance could be improved if appropriate sets of directional and omnidirectional antennas were chosen. A summary of the most successful results allows us to conclude that the performance can be improved in certain rooms using properly-positioned/oriented directional antennas, without affecting the performance in other spatial regions and, therefore, improving the overall system performance. Furthermore, results also demonstrate that using properly-planned configurations combining omnidirectional and directional antennas would allow maintaining good performance while the number of needed antennas is dramatically reduced, therefore saving on economic costs. Future works will be focused on the introduction of new low-cost planar and multi-beam directive antennas. These antennas will be able to sectorize space with three or six narrow beams (low beam width) in order to get better results, without economically jeopardizing the solution and gaining the feasibility of the RSS fingerprinting-based ILSs. Acknowledgments: This research has been supported by the Ministerio de Economía y Competitividad/Fondo de Europeo de Desarrollo Regional (MINECO/FEDER), project titled “COoperatine INtelligence Schemes for Future Internet emerging technologies” (COINS) (Project Ref. TEC2013-47016-C2-2-R), and the Spanish national project, “ChAracterization, EvaLuation, Planning and IMprovement of Key Technologies for the Future Internet: Knowledge and Transfer” (CALM), (Project Ref. TEC2010-21405-C02-02). It is also developed in the framework of “Programa de Ayudas a Grupos de Excelencia de la Región de Murcia, de la Fundación Séneca, Agencia de Ciencia y Tecnología de la Región de Murcia (RM)”. Author Contributions: This work is a collaborative development of all authors. Raúl Guzmán-Quirós programmed the location engine algorithms, performed the experimental results and wrote the paper; Alejandro Martínez-Sala designed the system architecture, programmed the system management and site survey software tools and designed the experiments; José Luis Gómez-Tornero contributed also to experiments design, selection and antennas positioning, data analysis and paper writing. Joan García-Haro is the investigator-in-charge of CALM and COIN projects and has contributed resources, data analysis and paper writing. Conflicts of Interest: The authors declare no conflict of interest.
References 1. 2. 3. 4.
Kolodziej, K.W.; Hjelm, J. Local Positioning Systems: LBS Applications and Services; CRC Press: Boca Raton, FL, USA, 2006. Engee, P.K. The global positioning system: Signals, measurements and performance. Int. J. Wirel. Inf. Netw. 1994, 1, 83–105. [CrossRef] Deak, G.; Curran, K.; Condell, J. A survey of active and passive indoor localisation systems. Comput. Commun. 2012, 35, 1939–1954. [CrossRef] Liu, H.; Darabi, H.; Banerjee, P.; Liu, J. Survey of Wireless Indoor Positioning Techniques and Systems. IEEE Trans. Syst. Man Cybern. Part. C Appl. Rev. 2007, 37, 1067–1080. [CrossRef]
Sensors 2016, 16, 4
5. 6. 7. 8.
9.
10.
11.
12.
13. 14. 15. 16.
17.
18. 19.
20. 21.
22.
23.
24.
21 of 23
Dardari, D.; Closas, P.; Djuric, P.M. Indoor Tracking: Theory, Methods, and Technologies. IEEE Trans. Veh. Technol. 2015, 64, 1263–1278. [CrossRef] Kok, M.; Hol, J.D.; Schon, T.B. Indoor Positioning Using Ultrawideband and Inertial Measurements. IEEE Trans. Veh. Technol. 2015, 64, 1293–1303. [CrossRef] Wu, Z.-H.; Han, Y.; Chen, Y.; Liu, K.J.R. A Time-Reversal Paradigm for Indoor Positioning System. IEEE Trans. Veh. Technol. 2015, 64, 1331–1339. [CrossRef] Atia, M.M.; Liu, S.; Nematallah, H.; Karamat, T.B.; Noureldin, A. Integrated Indoor Navigation System for Ground Vehicles With Automatic 3-D Alignment and Position Initialization. IEEE Trans. Veh. Technol. 2015, 64, 1279–1292. [CrossRef] Yang, J.; Chen, Y. Indoor Localization Using Improved RSS-Based Lateration Methods. In Proceedings of the IEEE Global Telecommunications Conference, Honolulu, HA, USA, 30 November–4 December 2009; pp. 1–6. He, T.; Huang, C.; Blum, B.M.; Stankovic, J.A.; Abdelzaher, T. Range-free localization schemes for large scale sensor networks. In Proceedings of the 9th annual international conference on Mobile computing and networking (MobiCom’03), San Diego, CA, USA, 14–19 September 2003; pp. 81–95. Bahl, P.; Padmanabhan, V.N. RADAR: An in-building RF-based user location tracking system. In Proceedings of the IEEE Nineteenth Annual Joint Conference of the IEEE Computer and Communications Societies, Tel Aviv, Israel, 23–30 March 2000; pp. 775–784. Dao, T.-K.; Pham, T.-T.; Castelli, E.A. Robust WLAN Positioning System Based on Probabilistic Propagation Model. In Proceedings of the 9th International Conference on Intelligent Environments (IE), Athens, Greece, 18–19 July 2013; pp. 24–29. D'Hoe, K.; Ottoy, G.; Goemaere, J.P.; Strycker, L. Indoor Room Location Estimation. Adv. Electr. Comput. Eng. 2008, 8, 78–81. [CrossRef] Macii, D.; Colombo, A.; Pivato, P.; Fontanelli, D. A Data Fusion Technique for Wireless Ranging Performance Improvement. IEEE Trans. Instrum. Meas. 2013, 62, 27–37. [CrossRef] Kaemarungsi, K. Design of Indoor Positioning Systems Based on Location Fingerprinting Technique. Ph.D. Thesis, University of Pittsburgh, Pennsylvania, PA, USA, February 2005. Elnahrawy, E.; Li, X.; Martin, R.P. The limits of localization using signal strength: A comparative study. In Proceedings of the 2004 First Annual IEEE Communications Society Conference on Sensor and Ad Hoc Communications and Networks, Santa Clara, CA, USA, 4–7 October 2004; pp. 406–414. Kaemarungsi, K. Distribution of WLAN received signal strength indication for indoor location determination. In Proceedings of the 2006 1st International Symposium on Wireless Pervasive Computing, Phuket, Thailand, 16–18 January 2006. Chai, X.; Yang, Q. Reducing the Calibration Effort for Probabilistic Indoor Location Estimation. IEEE Trans. Mob. Comput. 2007, 6, 649–662. [CrossRef] Yin, J.; Yang, Q.; Ni, L. Adaptive Temporal Radio Maps for Indoor Location Estimation. In Proceedings of the Third IEEE International Conference on Pervasive Computing and Communications, Kauai, HA, USA, 8–12 March 2005; pp. 85–94. Youssef, M.; Agrawala, A. The Horus location determination system. Wirel. Netw. 2007, 14, 357–374. [CrossRef] Chiu, Y.M.; Wang, K.; Jan, R.H.; Hu, Y.J.; Ku, T.H. An efficient room-based indoor localization scheme for wireless sensor networks. In Proceedings of the 5th Workshop on Wireless Ad Hoc and Sensor Networks, Hsinchu, China, 10–11 September 2009. Lo, C.-C.; Chen, C.-C.; Tseng, Y.-C.; Chiang, J.-C.; Feng, K.-C.; Kuo, L.-C.; Wang, Y.-C. A Room-Based Localization System Using Wireless Triggers and Pattern Matching Techniques. In Proceedings of the IEEE VTS Asia Pacific Wireless Communications Symposium (APWCS), Kyoto, Japan, 19–21 August 2012. Hotta, S.; Hada, Y.; Yaginuma, Y. A robust room-level localization method based on transition probability for indoor environments. In Proceedings of the International Conference on Indoor Positioning and Indoor Navigation (IPIN), Sidney, Australia, 13–15 November 2012; pp. 1–8. Wu, C.L.; Fu, L.C.; Lian, F.L. WLAN location determination in ehome via support vector classification. In Proceedings of the 2004 IEEE International Conference on Networking, Sensing and Control, Taipei, Taiwan, 21–23 March 2004; pp. 1026–1031.
Sensors 2016, 16, 4
25.
26. 27. 28. 29.
30.
31. 32. 33.
34.
35. 36.
37.
38.
39. 40. 41. 42. 43. 44. 45.
46.
47.
22 of 23
Battiti, R.; Villani, A.; Nhat, T.L. Neural network models for intelligent networks: Deriving the location from signal patterns. In Proceedings of Annual Symposium on Autonomous Intelligent Networks and Systems (AINS), Los Angeles, CA, USA, 8–9 May 2002. Brunato, M.; Battiti, R. Statistical learning theory for location fingerprinting in wireless LANs. Comput. Netw. 2005, 47, 825–845. [CrossRef] Ahmad, U.; Gavrilov, A.V.; Lee, S.; Lee, Y.K. A modular classification model for received signal strength based location systems. Neurocomputing 2008, 71, 2657–2669. [CrossRef] Tsai, C.-Y.; Chou, S.-Y.; Lin, S.-W.; Wang, W.-H. Location determination of mobile devices for an indoor WLAN application using a neural network. Knowl. Inf. Syst. 2009, 20, 81–93. [CrossRef] Martínez-Sala, A.S.; Guzman-Quirós, R.; Egea-López, E. Using neural networks and Active RFID for indoor location services. In Proceedings of the 2010 European Workshop on Smart Objects: Systems, Technologies and Applications (RFID Sys Tech), Ciudad Real, Spain, 15–16 June 2010; pp. 1–9. Kaemarungsi, K.; Krishnamurthy, P. Properties of indoor received signal strength for WLAN location fingerprinting. In Proceedings of the First Annual International Conference on Mobile and Ubiquitous Systems: Networking and Services, Boston, MA, USA, 22–26 August 2004; pp. 14–23. Blumrosen, G.; Luttwak, A. Human Body Parts Tracking and Kinematic Features Assessment Based on RSSI and Inertial Sensor Measurements. Sensors 2013, 13, 11289–11313. [CrossRef] [PubMed] Chen, Z.; Zou, H.; Jiang, H.; Zhu, Q.; Soh, Y.-C.; Xie, L. Fusion of WiFi, Smartphone Sensors and Landmarks Using the Kalman Filter for Indoor Localization. Sensors 2015, 15, 715–732. [CrossRef] [PubMed] Outemzabet, S.; Nerguizian, C. Accuracy enhancement of an indoor ANN-based fingerprinting location system using Kalman filtering. In Proceedings of the IEEE 19th International Symposium on Personal, Indoor and Mobile Radio Communications, Cannes, France, 15–18 September 2008; pp. 1–5. Ali-Loytty, S.; Perala, T.; Honkavirta, V.; Piche, R. Fingerprint Kalman Filter in indoor positioning applications. In Proceedings of the 2009 IEEE Control Applications, (CCA) and Intelligent Control, Saint Petersburg, Russia, 8–10 July 2009; pp. 1678–1683. Jan, S.-S.; Hsu, L.-T.; Tsai, W.-M. Development of an Indoor Location Based Service Test Bed and Geographic Information System with a Wireless Sensor Network. Sensors 2010, 10, 2957–2974. [CrossRef] [PubMed] Liu, Y.; Dashti, M.; Abd Rahman, M.A.; Zhang, J. Indoor localization using smartphone inertial sensors. In Proceedings of the 2014 11th Workshop on Positioning, Navigation and Communication (WPNC), Dresden, Germany, 12–13 March 2014; pp. 1–6. Gaedeke, T.; Johnson, M.; Hedley, M.; Stork, W. Fusion of wireless ranging and inertial sensors for precise and scalable indoor localization. In Proceedings of the 2014 IEEE International Conference on Communications Workshops (ICC), Sidney, Australia, 10–14 June 2014; pp. 138–143. Chen, X.; Yan, X.; Shen, X. Indoor positioning fusion algorithm for smartphones. In Proceedings of the 2014 International Conference on Indoor Positioning and Indoor Navigation (IPIN), Busan, Korea, 27–30 October 2014; pp. 620–626. Ekahau. Available online: http://www.ekahau.com/real-time-location-system (accessed on 15 November 2015). Versustech. Available online: http://www.versustech.com/rtls-vendor/ (accessed on 15 November 2015). Visionic Tecnologies. Available online: http://www.elpas.com/products/IR-Reader.aspx (accessed on 15 November 2015). Centrak. Available online: https://www.centrak.com/solution-overview/ (accessed on 15 November 2015). Aeroscout. Available online: http://www.stanleyhealthcare.com/products/ex4000-exciter (accessed on 15 November 2015). Brás, L.; Carvalho, N.B.; Pinho, P.; Kulas, L.; Nyka, K.A. Review of Antennas for Indoor Positioning Systems. Int. J. Antennas Propag. 2012, 2012, 1–14. [CrossRef] Jiang, J.-R.; Lin, C.-M.; Lin, F.-Y.; Huang, S.-T. ALRD: AoA localization with RSSI differences of directional antennas for wireless sensor networks. In Proceedings of the 2012 International Conference on Information Society (i-Society), London, UK, 25–28 June 2012; pp. 304–309. Werner, J.; Wang, J.; Hakkarainen, A.; Gulati, N.; Patron, D.; Pfeil, D.; Dandekar, K.; Cabric, D.; Valkama, M. Sectorized Antenna-based DoA Estimation and Localization: Advanced Algorithms and Measurements. IEEE J. Sel. Areas Commun. 2015, 33, 2272–2286. [CrossRef] Ou, Ch.-H. A Localization Scheme for Wireless Sensor Networks Using Mobile Anchors With Directional Antennas. IEEE Sens. J. 2011, 11, 1607–1616. [CrossRef]
Sensors 2016, 16, 4
48.
49.
50.
51.
52.
53. 54. 55. 56.
57. 58. 59. 60.
23 of 23
Niculescu, D.; Nath, B. Ad hoc positioning system (APS) using AOA. In Proceedings of the Twenty-Second Annual Joint Conference of the IEEE Computer and Communications. IEEE Societies, San Francisco, CA, USA, 30 March–3 April 2003; pp. 1734–1743. Nasipuri, A.; Li, K. A directionality based location discovery scheme for wireless sensor networks. In Proceedings of the 1st ACM international workshop on Wireless sensor networks and applications, Atlanta, GA, USA, 28 September 2002; pp. 105–111. Chintalapudi, K.K.; Dhariwal, A.; Govindan, R.; Sukhatme, G. Ad-hoc localization using ranging and sectoring. In Proceedings of the Twenty-third Annual Joint Conference of the IEEE Computer and Communications Societies, Hong Kong, China, 7–11 March 2004; pp. 2662–2672. Malhotra, N.; Krasniewski, M.; Yang, C.-L.; Bagchi, S.; Chappell, W. Location estimation in ad-hoc networks with directional antenna. In Proceedings of the 25th IEEE International Conference on Distributed Computing Systems, Columbus, OH, USA, 6–10 June 2005; pp. 633–642. Jang, H.; Choi, H.; Jung, Y.; Baek, Y. Robustness of Distributed RTLS for Dense Large-Scale Environments. In Proceedings of the 2010 Seventh International Conference on Information Technology: New Generations, Las Vegas, NV, USA, 12–14 April 2010; pp. 58–63. Ahmad, U.; Gavrilov, A.V.; Lee, Y.K.; Lee, S. Context-aware, self-scaling Fuzzy ArtMap for received signal strength based location systems. Soft Comput. 2007, 12, 699–713. [CrossRef] Hornik, K. Approximation capabilities of multilayer feedforward networks. Neural Netw. 1991, 4, 251–257. [CrossRef] Hagan, M.; Menhaj, M. Training Feedforward networks with the Marquardt algorithm. IEEE Trans. Neural Netw. 1994, 5, 989–993. [CrossRef] [PubMed] Meng, W.; He, Y.; Deng, Z.; Li, C. Optimized access points deployment for WLAN indoor positioning system. In Proceedings of the 2012 IEEE Wireless Communications and Networking Conference (WCNC), Paris, France, 1–4 April 2012; pp. 2457–2461. Du, Y.; Yang, D.; Xiu, C.A. Novel Method for Constructing a WIFI Positioning System with Efficient Manpower. Sensors 2015, 15, 8358–8381. [CrossRef] [PubMed] Matlab Neural Tool Box. Available online: http://www.mathworks.com/ (accessed on 1 February 2015). Rappaport, T.S. Wireless Communications: Principles and Practice, 2nd ed.; Prentice Hall PTR: Upper Saddle River, NJ, USA, 2001. Texas Instruments. Available online: http://www.ti.com/product/cc2510f16 (accessed on 15 March 2015). © 2015 by the authors; licensee MDPI, Basel, Switzerland. This article is an open access article distributed under the terms and conditions of the Creative Commons by Attribution (CC-BY) license (http://creativecommons.org/licenses/by/4.0/).