Journal of Integrative Bioinformatics, 7(2):112, 2010
http://journal.imbio.de
Integration of -omics data and networks for biomedical research with VANTED Christian Klukas1 and Falk Schreiber1,2 1 Leibniz
2
Institute of Plant Genetics and Crop Plant Research, Corrensstr. 3, 06466 Gatersleben, Germany Martin Luther University Halle-Wittenberg, 06099 Halle, Germany
[email protected],
[email protected] Abstract
Increasingly, research focus in the fields of biology and medicine moves from the investigation of single phenomena to the analysis of complex cause and effect relationships. The clarification of complicated relationships requires the consideration of different domains, such as gene expression, protein, and metabolite data. Furthermore, it is often sensible not to analyze the collected data in isolation, but to consider the context of relevant biological networks. In this paper newly developed functionalities of the VANTED system are presented. They allow users from medicine and biology to interactively structure extensive experimental data, to filter, to evaluate, and to visualize the data and the analysis results in the context of biological networks and classification hierarchies.
1
Introduction
The methodology of biochemical research has strongly changed during the last years. Nowadays large amounts of experimental data is produced by massive-parallel analysis technologies, for instance by automated enzyme-assays, metabolite- and transcript-profiling. Using the right supporting software, the resulting data base provides a comprehensive view on the biochemistry of an organism. The clarification of complicated connections in organisms generally requires the consideration of different domains. To handle this problem, instead of analysing the data in isolation, it is worth to consider the context of relevant biological networks. Available software systems for this task (see [5]) are tuned besides a few exceptions to single data domains and/or are firmly coupled to certain databases. In this paper newly developed functionalities of the VANTED system [2] are presented. They allow users from medicine and biology to interactively work with extensive experiment data, to filter, to statistically evaluate, and to visualize the analysis results directly in context of relevant biological networks and classification hierarchies.
2
Methods
For the analysis of experimental data integrated views of the measured values and relevant background information should be generated. This approach corresponds with the idea of system biology – instead of considering single parts, the analysis covers the overall system with doi:10.2390/biecoll-jib-2010-112
1
Journal of Integrative Bioinformatics, 7(2):112, 2010
http://journal.imbio.de
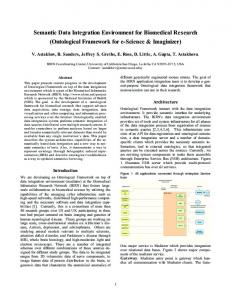
all interactions to better understand biological phenomena. In order to fulfill the goal of creating a software system which supports users in such an integrated analysis, three aspects are of importance for the design of the VANTED software: 1) data models for experiment data and biological networks, 2) the process of data mapping, by means of connecting experiment data and networks, 3) the analysis and visualization of the network-integrated data sets. These three points are described in the following. 1) Data models for experiment data and biological networks By investigation of common experiment designs the following crucial experimental factors have been identified: information about time series, replicates, environmental conditions, treatments and genetic lines. A data model which is able to handle experiment data, partitioned by the mentioned experiment factors, has been developed and is shown in Figure 1. To simplify the design and implementation, the model does not store information about the experiment procedures, but instead focuses on information required for experiment data mapping, visualization and analysis. experiment name : String coordinator : String importDate : Date importBy : String comment : String
1
1..*
condition species : String genotype : String treatment : String
1
0..*
sample time : Float timeUnit : String
1
0..*
measurement value : Float unit : String replicateID : int
1..*
1
substance name : String synonyms : String
Figure 1: Data model for experiment data sets.
In contrast to some other systems VANTED supports dynamic networks. Networks can be loaded into the system from databases (e. g. KEGG) or from files (e. g. GML, SBML, Pajek .net format). In addition, it is possible to construct or edit networks manually with integrated editor functions, thus networks can be easily extended if more substances were measured. The following graph data model is used as a flexible basis for different kinds of biological networks as well as for classification hierarchies: The mapping-graph MG is defined based on a graph G = (V, E) with a set of nodes V and a set of directed or undirected edges E, and additionally, a set of labels L, sets of node- and edgetypes TV and TE , a set of experiment data M , the label function l : V, E 7→ L, the node- and edge-type functions tV : V 7→ TV , tE : E 7→ TE , the data mapping function z : V, E 7→ M . This mapping-graph M G is written as M G = (V, E, l, tV , tE , z). Depending on the biological network under investigation, different sets of node- and edge-types are used. Two examples: (1) For a protein-protein interaction mapping-graph M GP P I , the following node- and edgetypes are used: TV = {P rotein} and TE = {Interaction}. Each edge of the modelled graph M GP P I stands for an undirected interaction between two proteins, represented by the end points of the particular edge. (2) A KEGG-mapping-graph M GKEGG uses the following node- and edge-types: TV = { Orthologue, Enzyme, Gene, Gene-Group, Metabolite, Pathway-Link} and TE = {ECrel, PPrel, doi:10.2390/biecoll-jib-2010-112
2
Journal of Integrative Bioinformatics, 7(2):112, 2010
http://journal.imbio.de
GErel, PCrel, Link}. A description of the KGML format, which stores information about a particular KEGG pathway, the listed node- and edge-types as well as the transformation into a dynamic graph model has been published previously [4]. 2) Data mapping For the integration of measurement data into relevant networks a data mapping is carried out. Given a mapping-graph M G and a set of experimental data sets ED (according to the definition shown in Figure 1), from ED derived subsets of the experiment data are connected to elements of M G, using the following algorithm. The result of this algorithm corresponds to the data function z of M G. Algorithm 1 Data mapping Require: M G – mapping-graph Require: ED – experiment data, objects of type experiment 1: M ⇐ generate for each substance in ED a separate data set 2: for all graphelements ge ∈ M G do 3: Z⇐∅ 4: A ⇐ label(ge) ∪ synonyms(ge) 5: for all m ∈ M do 6: B ⇐ id(m) ∪ synonyms(m) 7: if |A ∩ B| > 0 then 8: Z ⇐m∪Z 9: end if 10: end for 11: z(ge) = Z 12: end for In the beginning of the data mapping algorithm (line 1), the given exerimental data sets are partitioned into multiple data sets. For each substance in the data sets ED new data sets are constructed, containing only the measurement data and corresponding experiment info, which is related to a particular substance. Two sets A, B are initialized (lines 4 and 6). A contains the substance identifier (id(m)) and corresponding synonyms, set B contains the graphelement label and additionally defined or derived synonyms. Information about synonyms is taken automatically from the integrated databases (Expasy Enzyme [1], KEGG Compound and KEGG BRITE [3]) or can be provided by the user. For each node and edge in M G (line 2 and 4), it is tested, whether the intersection of set A and B contains at least one element (line 7). Is this the case, the data set m (containing experiment data of one substance) is included in the set of data to be mapped (Z, line 8). After checking all substance data sets m ∈ M the mapped data for a particular graph element is defined (line 11). Optionally (not shown in Algorithm 1), data sets which could not be mapped on the basis of substance names and synonyms are mapped to newly generated network nodes. In this manner new substances can be easily integrated into an existing network. 3) Histogram functions for classification hierarchies and network-integrated data The basis of the histogram functions are classification hierarchies modelled as graphs (e. g. Gene Ontology or KEGG BRITE) consisting of classification nodes CN and leaf-nodes LN doi:10.2390/biecoll-jib-2010-112
3
Journal of Integrative Bioinformatics, 7(2):112, 2010
http://journal.imbio.de
representing genes. A data analysis function is used to partition the leaf-nodes LN into several groups (e. g. up- or down-regulated gene nodes). In order to get an overview about the classification-specific group assignment within CN , the frequencies of the group-assignments for LN are determined and a corresponding data set is constructed for every non-leaf CN hierarchy node. This data set is visualized by node-embedded bar- or pie-charts. The most interesting CN nodes are nodes which show an uncommon pattern in the frequency of assigned groups. The significance of an observed frequency distribution in comparison to the overall proportions can be analyzed using Fisher’s exact test. The result of this statistical test is a probability value p. If p lies under a user-defined threshold (e. g. p ≤ 0.05), the observed frequency distribution is regarded as non-random and therefore as significant. The visualization may then be simplified by removing all nodes from the hierarchy from which there is no significant node reachable, see Figure 2 (top). VANTED also supports the visualization of several values connected to a single network element. While other systems often support only a simple colour code for the representation of a single measured value or the ratio of two values, the integration of diagrams into the network representation enables the visualization of more complex structured data sets. Another advantage in using line- or bar-charts is that such kinds of diagrams are widely used in other areas and thus are easy to understand.
3
Application example
Certain human cell lines are used to investigate the development of cancer. For this application example gene expression data of a human cell line, affected by a specific type of carcinoma (human choriocarcinoma BeWo), is compared to a control line (human placenta). The data sets were downloaded from the KEGG EXPRESSION database [3]. In order to get a general overview about the differences of the lines, the gene expression data can be assigned with the VANTED system to the KEGG pathway hierarchy (using information from the KEGG BRITE system). In the present data set no additional annotation files need to be considered in order to generate a corresponding pathway hierarchy, because the data sets from the KEGG EXPRESSION database already use gene IDs, used also inside the KEGG pathway diagrams. For data sets from a different source additional annotation files may be needed. At first a data mapping is carried out which generates for each gene of the data set a new node. After that, the automated workflow is started by using the menu command “Hierarchy/Analysis Pipeline ”: 1. Depending on the gene expression values, the available network nodes are categorized as down-, up- or not-regulated. A user-specified threshold is used during this procedure. 2. Gene-nodes are related to the KEGG Pathway hierarchy which is constructed as classification tree. Each new node of the classification tree represents a pathway, a BRITE gene function or a (pathway) category. In the present data set 695 out of 836 gene nodes could be connected to at least one node of the classification hierarchy. 3. Histograms are calculated. For each classification node the number of reachable nodes, belonging to a user-selected group as well as the number of remaining reachable genenodes are determined. In this example, user selected nodes are unregulated nodes.
doi:10.2390/biecoll-jib-2010-112
4
Journal of Integrative Bioinformatics, 7(2):112, 2010
http://journal.imbio.de
4. In step two of the pipeline 695 genes were assigned to 190 different pathways. Most of the pathways show a similar relative proportion of not-regulated to up- or down-regulated genes. With the help of Fisher’s exact test those pathways can be identified, which show a non-random divergence to this pattern. By using p ≤ 0.05, 18 pathway nodes and KEGG BRITE category nodes remain in the visualization and can be easily investigated in more detail. 5. The layout of the result network takes place. The result of the pipeline is shown in Figure 2 (top). The remaining pathway nodes contain in comparison to the complete data set either a comparatively high or low number of regulated genes. From the classification hierarchy KEGG pathways can be loaded and be investigated in detail. Figure 2 (bottom) shows the ECM-Receptor Interaction pathway which contains a comparatively large number of down-regulated genes and two up-regulated genes. The corresponding distribution of the genes within the pathways can be easily recognized.
4
Summary
VANTED is implemented as an open source Java Web Start application and therefore can be used on most computer platforms such as Linux, Windows and Mac OS X. The combination of functions for the network-integrated visualization and analysis of experiment data of different -omics areas, including the integration into KEGG pathways and Gene Ontology, as well as the flexible visualization of time series data, different conditions and replicates, make VANTED a valuable tool for research projects in biology, medicine and bioinformatics.
References [1] A. Bairoch. The ENZYME database in 2000. Nucleic Acids Research, 28(1):304–305, 2000. [2] B.H. Junker, C. Klukas, and F. Schreiber. VANTED: a system for advanced data analysis and visualization in the context of biological networks. BMC Bioinformatics, 7(1):109, 2006. [3] M. Kanehisa, M. Araki, S. Goto, M. Hattori, M. Hirakawa, M. Itoh, T. Katayama, S. Kawashima, S. Okuda, T. Tokimatsu, et al. KEGG for linking genomes to life and the environment. Nucleic Acids Research, 36(Database issue):D480, 2008. [4] C. Klukas and F. Schreiber. Dynamic exploration and editing of KEGG pathway diagrams. Bioinformatics, 23(3):344–350, 2007. [5] M. Suderman and M. Hallett. Tools for visually exploring biological networks. Bioinformatics, 23(20):2651–2659, 2007.
doi:10.2390/biecoll-jib-2010-112
5
Journal of Integrative Bioinformatics, 7(2):112, 2010
http://journal.imbio.de
Figure 2: Top: KEGG BRITE pathway hierarchy (by means of Fisher’s exact test as significant recognized pathways). Note that only classification nodes CN are shown. Bottom: ECM-Receptor Interaction pathway with detailed representation of up- (red) and down-regulated (blue) genes.
doi:10.2390/biecoll-jib-2010-112
6