INTEGRATION OF OPEN-SOURCE TOOLS FOR OBJECT-BASED MONITORING OF URBAN TARGETS R. R. Antunes a, E. S. Bias a, R. S. Brites a, G. A. O. P. Costa b a
Federal University of Brasilia, Brazil –
[email protected],
[email protected],
[email protected] b Rio de Janeiro State University, Brazil –
[email protected]
KEY WORDS: Object Based Image Analysis, Data Mining, InterIMAGE, Orange Canvas.
ABSTRACT: The constant increase in population in conjunction with unplanned and irregular urban growth, typical problems in developing countries, can promote a rapid increase in population density and related public infrastructure demand that may be hard to bear with the available economic resources. Efficient monitoring of urban development is thus a key instrument for planners and public policy makers that have to cope with this scenario. This work aims at developing a tool to aid monitoring urban growth from very-high resolution remote sensing images, focussing on the integration of available open-source software and the application of OBIA methods. Specifically, we created a method for detection of urban, land use/land cover classes based on the integration of the InterIMAGE and the Orange Canvas software packages. The image interpretation model for the particular application was constructed with the aid of dataflow building blocks (widgets) for data analysis, structured in the visual programming environment of Orange Canvas. The Classification Tree and the Classification Tree Graph widgets were used to design a decision tree that was later translated in InterIMAGE Decision Rules. The study was conducted over an image from the GeoEye-1 sensor, covering a central area of the city of Goianésia, in the Midwestern region of Brazil. Ten land use/land cover classes were the target of the supervised classification. The results obtained in the experiments confirm that the integration of the two open-source packages can provide for accurate remote sensing image analysis, while facilitating data exploration and the construction of automatic image interpretation models. 1. INTRODUCTION A great challenge is posed to urban planners by the fact that intra-urban occupation has been advancing lately, notably in developing countries. Because of this, automatic tools capable of discovering and mapping possible irregularities are on great demand by the public administration. Lang (2008) endorses this argument by describing a growing demand for updated geospatial information combined with quick extraction techniques, to allow for an improved decision-making process and, consequently, an improved management. Object-based analysis (OBIA) has stood out as an option for the monitoring of urban areas. The diversity of objects that can be identified by the current sensors can be better interpreted by this method due to the possibility of introducing an analyst’s knowledge and exploiting multiple features in the classification process. According to Blaschke, Burnett, and Pekkarinen (2004), many geo-information aspects cannot be obtained solely through pixel information, but they could be obtained in a context of proximity to objects of interest. Blaschke (2013) states that OBIA (Object-Based Analysis) allows additional information to be included so as to direct modeling and classification processes. This additional information can be statistics computed considering the pixels that belong to an object, such as: average reflectance; standard deviation of reflectance values; maximum and minimum pixel values, textural and morphological measures of the objects, and topological relationships to other objects. Integration of data mining software to the InterIMAGE open source image classification system has shown good results so far, according to studies such as: (Bias et al., 2014; Antunes et al., 2014; Passo et al., 2014; Nascimento et al., 2013). By using open-source data mining software packages, it is possible to
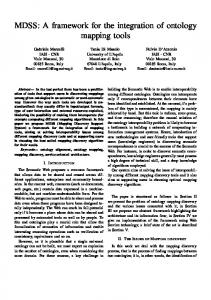
employ the many available algorithms in object-based classification, and also to extend, adapt or combine existing ones. Many current object-based studies have used the open-source WEKA data mining software package (Witten and Frank, 2005). In this context, it is interesting to check whether integration between InterIMAGE and other data mining software packages is viable, specially taking into account accuracy of results and efficiency of the overall processes. This study aims at analyzing and assessing the potential of such integration, as well as the quality of the results obtained through object-based urban area classification using InterIMAGE in conjunction with the Orange Canvas open-source data mining software. 2. MATERIALS AND METHODS The study area is the municipality of Goianésia, located in the Midwestern region of Brazil, on the Central Plateau, in the north central region of Goiás State. A pansharpened image from the GeoEye-1 Sensor, acquired in 2013 was used in this study (Fig. 1). The following open-source software packages were used in the study: QuantumGIS, version 2.8 (QGIS, 2016); Orange Canvas, version 2.7 (ORANGE, 2016); and InterIMAGE, version 1.43 (INTERIMAGE, 2010). Orange Canvas is a software written in the Python language that offer a broad set of data mining and machine learning algorithms, developed by the Bioinformatics Laboratory of the Faculty of Computer and Information Science at University of Ljubljana, Slovenia, in collaboration with the open source community (Demsar et al., 2013).
InterIMAGE has been developed by the Computer Vision Lab of the Faculty of Electric Engineering at Pontifical Catholic University of Rio de Janeiro (PUC-Rio) and by the Image Processing and Remote Sensing divisions at the Brazilian National Institute for Space Research (INPE).
of the classes of interest independent segmentations were produced, using segmentation procedure proposed in (BAATZ & SHÄPE 2000). The classes and segmentation parameter values used are shown in Table 1. The segmentation of the other classes: vegetation, shade and roads; were produced through image thresholding based on NDVI and brightness values. Segment were exported according to the following attributes: shape, spectral statistics, and texture.
Table 1. Segmentation parameter values. Textural (entropy), spectral statistics (mean, minimum and maximum pixel values, brightness, band ratios) and morphological (primary angle, squareness, circularity, compacity) features were computed for each image segment.
Figure 1. GeoEye-1 image covering the municipality of Goianésia used in this work. In this work 10 thematic classes were the subject of the classification process, namely: vegetation, swimming pools, shade, urban roads, exposed soil, concrete floor, metal roofing, asbestos roofing, clear ceramics roofing and dark ceramics roofing. Figure 2 shows the 5 stages of the methodology employed in this study.
Image preparation (1)
Pre-classification (2)
Classification (4)
Data mining (3)
In Stage 3, the Orange Canvas software package was used to explore the classification feature space aiming at defining decision rules for the posterior classification with InterIMAGE, at Stage 4. Finally, in Stage 5, the classification accuracy was assessed, in terms of Global and TAU accuracy metrics. 3. DATA MINING AND CLASSIFICATION PROCEDURES Orange Canvas provides a visual programming environment, which is based on flowchart building blocks called widgets, to support data analysis. Widgets are grouped into classes according to their function. Widget flowcharts can be built for input, exploration and visualization of data, such as the flowchart shown in Figure 3.
Result analysis (5)
Figure 2. Stages of the methodology. Stage 1 has to do with image preparation. In this stage, the spectral bands of the GeoEye-1 image were pansharped using the Gram-Schmidt method, and cropped to 977 x 1531 pixels with the QuantumGIS sofware. In Stage 2 the InterIMAGE software package was used for segmentation, feature extraction and sample selection. For some
Figure 3. Widgets flowchart.
The Widget classes in Orange Canvas are: Widget File: reads the input data file (data table with data instances).
Orange Canvas can display the rules associated to the different classes, in textual and graphic form, as shown in Figure 7, for the dark ceramics roofing class.
Widget Data Table: receives one or more sets of data as input and displays them in spreadsheet form. Widget Select Attributes: is used to manually compose a data domain. Through this Widget the user can select the attributes that are actually be going to be used in the data mining process. Widget Classification Tree: provides a graphical interface for the C4.5 decision tree learning algorithm, that allows the user to adjust the parameter values of the algorithm and execute it, thus creating a classification tree. Widget Classification Tree Viewer: displays the classification tree generated through the Classification Tree Widget in a hierarchical, textual format.
Figure 7. Example of decision rules generated by Orange Canvas. The rules created with Orange Canvas were subsequently structured in a semantic network in the InterIMAGE software (Figure 8).
Widget Classification Tree Graph: displays the classification tree as a graph and allows the user to edit/adjust the classification tree. Figure 5 shows the decision tree generated with Orange Canvas for this application, as displayed in the Classification Tree Graph Widget. This tree has 32 nodes, 16 leafs, and 16 rules. For the purposes of this study, we consider it a good decision tree, since rules have been attributed to all the specified classes. According to Tan, Steinback, and Kumar (2005), in a decision tree, a class is attributed to each leaf node. Non-terminal nodes, which include the root node and other internal nodes, contain attribute-test condition that divide entries that have different characteristics. For example, the root node, shown on Figure 5(b), uses the asbestos class and the div4_3 attribute (division of band 4 by band 3) to initiate the separation of classes, continued in descendant nodes, such as Figure 5(c). Figure 5(d) shows a leaf node, associated to the asbestos class.
Figure 5. Decision tree generated by the Orange Canvas data mining software. (b) Root node of the tree, represented by the asbestos class. (c) Example of subsequent node of the tree. (d) Example of leaf node. In this study, the criterion used to select attributes and classes was information gain, which is a measurement of the impurity of data.
Figure 8. Semantic network in InterIMAGE The decision rules originated from Orange Canvas were inserted as TopDown decision rules in the InterIMAGE semantic network (Figure 9). For the vegetation, shade, and urban roads classes, the TA_NDVI_Segmenter, TA_Arithmetic, and TA_ShapeFile_Import operators were used.
Figure 9. Integration of the Orange Canvas data mining software and InterIMAGE classification software.
There were difficulties in separating those classes because they have similar spectral characteristics.
4. RESULTS AND DISCUSSION After classification, a thematic map was generated, classification accuracy was assessed. Global accuracy and the TAU index were computed. The number of samples was defined using Equation 1, which determined 664 samples (CONGALTON; GREEN, 1999). (1) where
N = number of samples B = obtained from the chi-squared distribution table with (1-k) degrees of freedom = class with the biggest proportion on the map k = number of classes b = admissible error
To compose the confusion matrix, classification assessment of random points was carried out using the QuantumGIS software. The confusion matrix presented 563 (85%) true references and 101 (15%) false references. The result of the classification can be seen on Figure 10, in the form of a thematic map. Global accuracy was 85% and the TAU index of agreement was 83%.
5. CONCLUSION The results obtained allowed us to assess the integration of the Orange Canvas data mining software and the InterIMAGE classification software, aiming at analyzing urban occupation. This analysis was performed using and object-based analysis. The following aspects of the methodology and the particular application caried ou in this work can be stressed: a) The extendablility capacity of the open-source systems InterIMAGE and Orange Canvas are important features for implementing object-based applications. b) The way Orange Canvas structures classification tree provides for a better organization, exploration and visualization of results. c) Orange Canvas only provides the C4.5 decision-tree induction algorithm by default. Other algorithms may be implemented on the system, as long as the analyst is capable of programming in the Python language. d) The 85% and 83% obtained respectively for global accuracy and TAU agreement indexes, can be considered very good results. Antunes et al. (2015) classified the same dataset used in this work with the J48 algorithm in the WEKA data mining software, and obtained a global acuuracy of 85% and TAU agreement of 82% REFERENCES Antunes, R.R., Bias, E.S., Brites, R.S., Costa, G.A.O.P., 2015. Desenvolvimento de técnica para monitoramento do cadastro urbano baseado na classificação orientada a objetos. Estudo de caso: Município de Goianésia, Goiás. Revista Brasileira de Cartografia 67(2), pp. 357-372. Baatz, M., Schäpe, A., 2000. Multiresolution segmentation: an optimization approach for high quality multi-scale image segmentation. In: XII Angewandte Geographische Informations verarbeitung, AGIT Symposium. Proceedings... Karlsruhe, Germany: Herbert Wichmann Verlag, Salzburg – Austria, pp. 12-23. Bias, E.S., Antunes, R.R., Pereira, E., Costa, G.A.O.P, Brites, R.S., Rithter, M., 2014. Application of Imagery Analysis Based on Objects as a Tool for Monitoring the Urban Cadastre in Small Municipalities. International Geographic Object-Based Image Analysis Conference, Thessaloniki, 2014. Blaschke, T., Pekkarinen, A., Burnett, C., 2004. Image Segmentation Methods for Object-based Analysis and Classification. Remote Sensing Image Analysis: Including the Spatial Domain, 211–236. Kluwer Academic Publishers. 2004. Blaschke, T., 2013. Object Based Image Analysis: A new paradigm remote sensing?. ASPRS, Anual Conference. Baltimore, Maryland.
Figure 10. Thematic map of the classification. The biggest confusion in the classification was between ceramics roofing (dark and clear) and the exposed soil class.
Passo, D.P., Bias, E.S., Brites, R.S., Costa, G.A.O.P., 2014. Comparison of the accuracy of classifications generated by InterIMAGE and by InterIMAGE integrated with data mining.
International Geographic Object-Based Conference, Thessaloniki, 2014.
Image
Analysis
Congalton, R.G., Green, K., 1999. Assessing the accuracy of remotely sensed data: principles and practices. Boca RatonUSA: Lewis Publisher. Demsar, J., Curk, T., Erjayec, A. 2013. Orange: Data Mining Toolbox in Python. Journal of Machine Learning Research, 14, pp. 2349-2353. Orange Data Mining – Documentation, 2015. Available at http://orange.biolab.si/ Acessed 21 March 2016. QGIS BRASIL. Comunidade de usuários QGIS Brasil. 2015. Available at http://qgisbrasil.org/. Acessed 11 August 2015. INTERIMAGE – Manual do Usuário, 2010. Available at http://www.lvc.ele.puc-rio.br/projects/interimage/ptbr/documentacao/ Acessed 20 September 2014. Lang. S. Object-based image analysis for remote sensing applications: modeling reality – dealing with complexity. In: Blaschke, T., Lang, S., Hay G. Object-Based Image Analysis. Berlin, German. Springer, 2008. Nascimento, A.F. et al., 2013. Classificação da Cobertura da Terra, Utilizando os Programas Livres: InterIMAGE, WEKA e QuantumGIS. XVI Simpósio Brasileiro de Sensoriamento Remoto - SBSR, Foz do Iguaçu, Brazil. Tan, P.N., Steinbach, M., Kumar, V., 2005. Introduction to Data Mining. Addison-Wesley Longman Publishing, Boston, MA, USA. Witten, I., Frank, E., 2005. Data Mining: Practical Machine Learning Tools and Techniques. 2. ed. San Francisco, CA: Morgam Kaufmann Publishers.