KeywordsâArtificial neural networks; fuzzy systems; fuzzy neural systems ... the body's chemical balance is the liver, applying a few essential ... can work as the primary line direction. With an ... and an absence of early identification, it gave an inspiration to introduce a ... presented a medical prediction expert system utilizing.
(IJACSA) International Journal of Advanced Computer Science and Applications, Vol. 8, No. 12, 2017
Intelligent Classification of Liver Disorder using Fuzzy Neural System Mohammad Khaleel Sallam Ma’aitah1,*, Rahib Abiyev1, 2 and Idoko John Bush1, 2 1
Computer Engineering Department, Near East University, Lefkosa, Northern Cyprus, Mersin 10, Turkey Applied Artificial Intelligence Research Centre, Near East University, Lefkosa, Northern Cyprus, Mersin 10, Turkey
2
Abstract—In this study, designed an intelligent model for liver disorders based on Fuzzy Neural System (FNS) models is considered. For this purpose, fuzzy system and neural networks (FNS) are explored for the detection of liver disorders. The structure and learning algorithm of the FNS are described. In this study, we utilized dataset extracted from a renowned machine learning data base (UCI) repository. 10 folds crossvalidation approach was explored for the design of the system. The designed algorithm is accurate, reliable and faster as compared to other traditional diagnostic systems. We highly recommend this framework as a specialized training tool for medical practitioners.
finding causes and approaches to drastically limit liver disease. Also, specialists like medical experts are seriously endeavoring to enhance method of nursing.
Keywords—Artificial neural networks; fuzzy systems; fuzzy neural systems; liver disorders
I.
INTRODUCTION
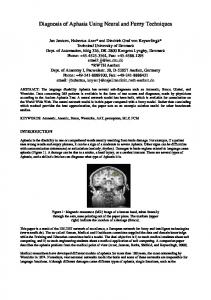
To reduce the overwhelming chaos of liver cancer, the most effective approach is to prevent it from occurring in the first place. A few researchers trust that inoculations and enhanced medications for hepatitis could avert the growth of liver cancer cases around the world. Scientists are contemplating approaches to forestall infections caused by hepatitis before resulting to liver illness. The major causes of this ailment are due to constant or excessive intake/utilization of alcohol, admission of sullied sustenance and medications, using shared needles to infuse drugs. Also, smoking, having low immunity, L-camtime deficiency and inherited liver diseases also leads to causing liver disorderliness. Fig. 1 shows computed tomographic (CT) image of the liver. Clinically, malevolent neoplasm which is also known as cancer is an extensive class of illnesses usually encounters uncontrolled growth of cell. Several cancer related researches depicts that, cells could subdivide and develop insanely, framing threatening tumors, and attack close-by parts inside the body. Such tumors can develop and ruin the nervous, digestive and circulatory frameworks and discharges hormones to modifying cells of the body. The human body has around 200 distinctive known malignancies that usually appear in cell. These malignancies are portrayed by the kind of cell firstly influenced. One of the major inward organs in the human body system which assumes a noteworthy part in the body's chemical balance is the liver, applying a few essential procedures helping every other body organs. Several studies have done over the world, taking a gander at approaches to constantly checking events of liver tumor. Since there are few powerful approaches to preventing the illness, currently, there are dependably a lot of researches currently in in view in the field. Researchers are seriously determined to
Fig. 1. Computed tomographic capture of the liver.
Fig. 2. Liver cancer causes and their damages.
Perseverance of a malignancy quiet depends vigorously on early identification, therefore, creating advancements appropriate for delicate and particular strategies is an inescapable assignment for this disease (cancer) analysts. Fig. 2 delineates the rates of different causes that develop or conceive this illness. The structured presentation demonstrates that, excessive utilization of Alcohol/Hepatitis C infection remains the real foundations for the development of liver cancer cell.
25 | P a g e www.ijacsa.thesai.org
(IJACSA) International Journal of Advanced Computer Science and Applications, Vol. 8, No. 12, 2017
Some of the screening strategies for cancer incorporate; endoscopy, colon cancer occult blood detection, women’s Papanicolau test to detect cervical cancer as well as mammography breast cancer detection, prostate-specific antigen (PSA) level detection in blood sample for men to detect prostate cancer, CT scans, X-ray, ultrasound imaging and MRI [1] for different cancer recognition. These customary indicative strategies however are not effective techniques with regards to malignancy discovery at beginning periods. Aside this, most of the screening techniques are very costly making it excessively expensive and inaccessible to the less privileged. Hence, with the development in innovation it has turned into an express significance to having a component that is particular and trustworthy for identifying malignancies at beginning periods and is effortlessly made an open source so it can work as the primary line direction. With an expansion in malignancy impact and the loss of life as a result of this illness and an absence of early identification, it gave an inspiration to introduce a thought exclusively considered not to be a novel method, less time complex, less computational complex, yet in addition, is accessible for all sort of the general population. Liver malignancy is usually diagnosed using three methods in particular biopsy, imaging test and blood test. For a PC assisted procedure, the concentration is for the most part given to the imaging examinations. Imaging screening utilized as a part of liver malignancy examination are CT, ultrasound, angiography and MRI. PC assisted liver tumor classification and recognition that depends on image examination methods gives more valuable data. Some traditional techniques for the classification of liver malignancy tissue comprise of three stages: the first step is liver and tumor segmentation [2], [3] from images of CT of inward stomach. The second step is feature extraction and the third step is classification using the appropriate models. Throughout the years the portrayal of liver images in light of texture investigation strategies is been applied. As demonstrated, scientists have proven that regardless the fact that the wavelet transforms are exceptionally successful for representation of disengaged objects having point singularities, however they are not that effective when considering line singularities. Several researchers have studied the curvelet transform, ridgelet transform and other transformation methods. Recently, Lale Ozyilmaz et al. explored a framework to examine hepatitis infections utilizing RBF Neural system and MLP in [4]. R. Jajoo et al. built forecasting hepatitis C framework utilizing rule base and artificial neural network in [5]. M. Neshat et al. in [6] developed fuzzy expert system for diagnosis of liver disorders. Laercio Brito Gonçalves et al. proposed a novel neuro-fuzzy model for Pattern rule extraction and classification in databases; a new neuro-fuzzy model that has been particularly made for rule extraction and record classification in databases. Thus, the hierarchical neuro-fuzzy binary depends on the HNFB space partitioning mode, which epitomizes an input data recursive apportioning, could consequently create structure of its own and permits a more noteworthy number of inputs as shown in [7]. H Fukuda et al designed a diagnosing framework of image utilizing ANN to analyzing the parenchymal echo pattern of chronic
hepatitis and cirrhotic liver [8]. In [9], Hideneo Abeet et al. built up an incorporated time-series data mining environment for data therapeutic mining. The data therapeutic time-series mining is essential problem to getting helpful clinical ideals from medicinal datasets. Doina Dragulescu et al. in [10] presented a medical prediction expert system utilizing statistical as well as logical inferences; utilized as a part of this framework so as to make predictions in regards to infected patient evolution and the hepatitis diagnosis. A procedure of recognition of an issue in a specific field by embracing any of the current systems or presenting new systems is known as research. This paper introduced a method for detecting liver disorders which is thought to be logical and novel. Some other scientists that have put forward their utmost effort regarding this subject include; Schemmer P et al. (2006) in [11], proposed a vascular territories liver surgery where hepatic vein and portal data were utilized for the examination. Hyun-Jung Jang, et al. (2009) [1] presented an enhancement method of image for ultra sound images, for example, shock filters, contrast stretching, et cetera in order to give a powerful clinical diagnostic approach. Vibhakar Shrimali, et al. (2010) [2] proposed an ultrasound liver images segmentation which is another non-iterative multidimensional filter and nonlinear filter to decrease noise. R. S. Moni et al. (2010) [12] presented a PC assisted scientific framework for diagnosing malignant and benign liver tumors from CT imaging utilizing multidimensional curvlet transform for texture feature extraction as well as neural system. Ekong V. E. et al. (2011) [3] built a fuzzy cluster means framework to help the examination of liver illness utilizing a group of clinical manifestations and LFTs signs. The exploratory outcomes demonstrated a quality upgraded liver infections analysis, yet having time complexity. In [13], Wu Qiu et al. (2011) utilized fuzzy procedure for image improvement by utilizing spatial domain and frequency space strategies. Alexandra Branzan Albu et al. (2002) [14] depicts a procedure that segments 2D dimensional liver tumors MR images for extracting the focused tumor with high reliability and accuracy. Katia Passera et al. (2013) [15] utilized radio frequency removal; hepatitis non-surgical treatment that set forward a reasonable framework for giving a more target for evaluating RFA scope. Kwang-Baek Kim et al. (2008) [16] presented a technique utilizing region based coding of images of liver malignancy encircled via computed tomography examination. Masayuki Matsuo et al. (2004) [17] set up an investigation which look at the perceptibility of malignancy in heptatic tumors on ferumoxides upgraded MRI utilizing five gradient-recalled echo groupings at various TEs. In [18], K. Mala et al. (2005) built up a framework for segmentation of tumor to create the necessary foundation for discovery. Here, textual features bi-orthogonal wavelet were separated for the training of the PNN for the liver tumor classification as cholangio carcinoma, hemagioma, hepatocellular belly and hepatocellular carcinoma with better execution backing the medical specialists and radiologists amid their medicinal prescription. In [19], Robin Martin, et al. (2004), actualized semi-automatic technique in light of regiongrowing to separate the liver part. The BUPA dataset is made up of 345 rows and 7columns where each row represents a record of a male being. The
26 | P a g e www.ijacsa.thesai.org
(IJACSA) International Journal of Advanced Computer Science and Applications, Vol. 8, No. 12, 2017
initial 5 attributes (x1-x5) represents integer valued corresponding to the results of different blood tests used for diagnosis of liver disorderliness induced by alcoholic intake. The 6th attribute, x6, represent real value corresponding to the quantity of alcoholic drinks consumed by the male being per day (self-reported). In the dataset, the last column x7 represents binary. Note that x7 is never meant to be seeing as either presence or absence of a liver disorder as claimed/stated by several researchers that implored the BUPA dataset. Rather, it is practically meant to divide the dataset into training and testing subsets [20]. It should be noted that x7 was created and not collected. There are 145 rows with x7 = 1 and 200 rows with x7 = 2. As mentioned, in the Liver dataset, x6 is a dependent variable representing number of drinks while x7 is a selector meant to divide the data into training and testing subsets. Unfortunately, many authors interpreted x6 as an independent variable and x7 as the target for classification. In most of the instances, the authors explicitly presented x7 as the presence or absence of a liver disorder which is absolutely wrong, as discovered by the original donor of the dataset; Richard S Forsyth in [20]. Based on the above misconception, Richard S Forsyth in [20] issued four actions for researchers intending to utilize the BUPA dataset. In this paper, we explored the second action for the implementation of the liver disorder detection problem. To correct the above stated misconception, in our study, we discarded column 7 (x7) and further implored a procedure that set a threshold on column 6 (x6). At first, we dichotomized at: x6 ≥ 3 = 1 (implying high content of alcoholic drinks in the body system which could possibly result to liver disorder). Also, we set the threshold to x 6 < 3 = 0 (indicating low or no alcoholic drinks content in the body system hence, healthy liver) as it was done in [21]. We explored the same procedure in our second experiment (experiment 2) by dichotomizing x6 using the relation: x6 > 5 as it was mentioned [20].
(sgot). The sixth variable denotes the number of half-point equivalents of alcoholic beverages consumed per day. Creating systematic algorithmic models encompasses many steps. The first step is data preprocessing; an essential phase of data mining. This filters and makes data ready for operations. Analyzing unfiltered data can generate inappropriate model or misleading results. Hence, the representation and quality of data is first and foremost before further analysis and classification. Here, for high performance accuracy to be obtained, the dataset were normalized/rescaled to the range of (0, 1). The second step as featured in this paper is feeding the processed data onto the classifier; FNS models. At this point, the training of the network is implemented using 10 fold cross validation. In this approach the original dataset is arbitrarily parceled into 10 subsets. Here, one subsample is held for validation and utilized for testing the FNS classifier and the other 9 subsets are utilized for the training phase. Amid training, every one of the 10 subsets is utilized precisely once for validation purposes. Hence the cross-validation process is iterated 10 times. Then all 10 outcomes resulting from the experiment are averaged in order to estimate the learning iteration. Conclusively our FNS algorithm classifies the entire data set into two classes; healthy cell and disordered cell. Fig. 3 presents the structure of our proposed algorithm. In this study, we explored FSN rule and knowledge based system using Takagi-Sugeno-Kang (TSK) type fuzzy rules. FNS focuses on knowledge base, which is made up of the ifthen fuzzy rules. Here, it is noted that the if-then expression is simply the if-then fuzzy rules which are specified by a continuous membership function as seen in [22]-[25]. In this section, the design stages of FNS are described and studied.
The paper is organized as follows. Section 2 briefly describes methodologies used for detection of liver disorder. Section 3 presents proposed fuzzy neural networks model used for the liver disorder’s detection, where the gradient descent algorithm used for learning of FNN is described. Section 4 presents experimental results obtained from the simulation. Section 5 gives conclusions of the paper. II. METHODOLOGY In this study, we used pattern classification type dataset taken from UCI repository. The dataset comprises of 345 records where a record consists of six variables. The first five variables represents inputs while the last (6th) attribute represent the classes (0 represent healthy cell and 1 represent high content of alcoholic drinks in the body system that could possibly result to liver disorder) as explicitly discussed above. The initial five attributes represents blood tests corresponding to the degree of sensitivity of liver disorders as a result of high consumption of alcohol. Basically, these attributes denotes the alkaline phosphotase (alkphos), alamine aminotransferase (sgpt), mean corpuscular volume (mcv), gamma-glutamyl transpeptidase (gammagt) and aspartate aminotransferase
Fig. 3. Flow chart of the methodology.
III. PROPOSED ALGORITHM Hence, this research work presents a fuzzy neural network capable of detecting liver disorderliness using a data set taken from UCI repository. Fuzzy logic proposed by L. A. Zadeh [26] resembles human reasoning process. They are widely used to solve different problems, such as control, classification, prediction, identification, etc. Fuzzy logic is an easy and convenient approach for mapping an input dimensional space to an output dimensional space which is
27 | P a g e www.ijacsa.thesai.org
(IJACSA) International Journal of Advanced Computer Science and Applications, Vol. 8, No. 12, 2017
practically executed using if-then rules that have an antecedent and consequent parts. The antecedent part includes input variables. Consequent part includes output variables of the system. Mapping inputs to their corresponding outputs is a basic function of pattern recognition system where the inputs represent the patterns and outputs are the classes. In a fuzzy rule base, values of attributes are basically described by fuzzy values or linguistic terms. Each fuzzy value is characterized by a membership function. Basically, we use the membership functions to quantifying linguistic terms. The design of fuzzy system includes the precise construction of the consequent and the antecedent sections of the rules. One of the effective technologies for construction of the ifthen rules is NNs. This is because the NNs have self-learning characteristics and generalization abilities, the parallelism of computation, nonlinear mapping and vitality. The self-learning capability allows the increase the neural networks performance accuracy based system. Here, fuzzy logic works by reducing the data complexity as well as handle imprecision and uncertainty. In order to design a system with fast learning capability that can describe nonlinear systems characterized with uncertainties, we combined fuzzy logic and neural networks. Here these two approaches are integrated basically to construct a fuzzy neural system (FNS) to solve pattern classification problem. The BUPA data set represent input signals of the FNS based classifier. The classifier based on the above features classifies the patterns into the healthy cell and disordered cell. The fuzzy neural systems (FNS) realize the fuzzy reasoning process through the structure of neural networks. The design of FNS includes the generation of the proper rules having the IF-THEN form. Apparently, it is necessary to determine the accurate description of the consequent and the premise sections of the fuzzy IF-THEN rules for the classifier using the training capability of NN [27], [28]. This is obtained through evaluation of the error response of the designed classification system. Mamdani [29] and Takagi-SugenoKanag type fuzzy rules [30] are basically utilized for designing the fuzzy systems. In the paper the second typeTSK fuzzy rules are used for system design. TSK fuzzy rules include fuzzy antecedent and crisp consequent parts. These fuzzy systems approximate nonlinear systems with linear ones and having the form shown below:
From the above, we have:
1 j ( xi ) e
( x i c ij ) 2
ij2
, i=1...m, j=1...r
(2)
Where number of input signals is denoted by m, and the number of fuzzy rules is represented by r (hidden neurons in the third layer). The centre and width of the Gaussian membership functions are denoted as c ij and ij respectively. And finally, the membership function of i-th input variable for j-th term is represented by 1j(xi) as shown in [28], [31], [32]. The rules are incorporated in the third layer hence termed the rule layer where number of rules equals the number of nodes. Here, the rules are denoted by R1, R2,…,Rr. To calculate the output signals of this layer, we explored the t-norm min (AND) operation given as:
j ( x) 1 j ( xi ) , i=1,..,m, j=1,...
(3)
i
Where the min operation is denoted by . Fifth layer input signals are represented as j(x) signals. The consequent layer is the fourth layer and this layer comprises the n linear systems where we determined the rules output values. m
y1 j b j aij xi
(4)
i 1
To calculate the j-th node output, we multiplied the third layer output signals j(x) by the fourth layer output signals. Thus:
y j j ( x) y1 j
If x1 is A11 and x2 is A21 and … and xm is Am1 Then ∑
We calculate the FNS output signals in the sixth layer using:
If x1 is A12 and x2 is A22 and … and xm is Am2 Then ∑
classification of liver disorders is depicted in Fig. 4. The FNS consists of six layers. Here, xi (i=1,…,m) input signals are distributed in the first layer. In the second layer, the membership functions that describe the linguistic terms are incorporated. This section calculates, the membership degree to which input value belongs in fuzzy set and for each input signal entering the system. We use Gaussian membership function to describe linguistic terms [31].
r
(1)
If x1 is A1n and x2 is A2n and … and xm is Amn Then ∑ Here input and output signals of the system are represented as xi and yj respectively, the number of input signals is represented as i=1,...,m, while the number of rules is represented as j=1…r. Aij denote input fuzzy sets, while bj and aij represents the coefficients. FNS structure utilized for the
uk
w j 1 r
jk
yj
( x) j 1
(5)
j
Where uk represents the FNSs output signals, (k=1,..,n). The training of the parameters of the network begins after the output signal is calculated.
28 | P a g e www.ijacsa.thesai.org
(IJACSA) International Journal of Advanced Computer Science and Applications, Vol. 8, No. 12, 2017
j=1,..,r, k=1,..,n) of network and membership function parameters c ij and ij (i=1,..,m, j=1,..,r) of FNS structure are modified and adjusted using the following formula as seen in [28], [32]-[35]:
w jk (t 1) w jk (t )
E ( w jk (t ) w jk (t 1)); w jk
a ij (t 1) a ij (t )
E (a ij (t ) a ij (t 1)); a ij
b j (t 1) b j (t )
E (b j (t ) b j (t 1)); b j
c ij (t 1) c ij (t )
ij (t 1) ij (t )
(7)
E (cij (t ) cij (t 1)); c ij E ( ij (t ) ij (t 1)); ij
i 1,..., n; j 1,..., r; k 1,..., n. With i=1,…,m; j=1,…,r; k=1,…,n. Here m represents the input signals number and the number of fuzzy rules is denoted by r, and represents learning and momentum rates, respectively. Fig. 4. Topology of the proposed FNS.
Derivative in (7) as depicted in [28] is computed as:
A. Parameter Learning Initially, the parameters of the FNS are generated randomly. These parameters are the membership functions parameters described in (2) of the fuzzy rules (1) in the second layer of Fig. 4 and the parameters of the linear functions of (4) in fourth and fifth layers. To design FNS classifier, the training of the membership functions parameters cij(t) and ij(t) (i=1,..,m, j=1,..,r) in the premise part and parameter values of the wjk(t), aij(t), bj(t) (i=1,..,m, j=1,..,r, k=1,..,n) in consequent part is carried out [28, 31]. In the paper, we applied fuzzy clustering and gradient algorithms for the update of FNS parameters [33]. Fuzzy c-means clustering is applied to find parameters of antecedent part; membership functions parameters. After clustering the training of parameters is performed using gradient descent learning algorithm with adaptive learning rate. The use of adaptive learning rate speeds up the learning and guarantees the convergence. Also, the momentum is used to additionally speed-up the learning processes. During learning on the network output, the error cost function value is determined thus:
E
n
1 (ukd uk )2 2 k 1
(6)
n
j 1
j
,
E (u k (t ) u kd (t )) wkj j xi aij k E (u k (t ) u kd (t )) wkj j b j k
n
j 1
j
, (12)
n
j 1
j
,
here i 1,.., m, j 1,.., r, k 1,..., n. Using (13) and (14), we determined the derivatives in (11) thus: y j uk 2( xi cij ) E (u k (t ) u kd (t )) n j ( xi ) cij ij2 k
j 1
(13)
j
y j uk 2( xi cij ) 2 E (u k (t ) u kd (t )) n j ( xi ) ij k ij3 j
(14)
j 1
The number of the network output signals is denoted by n, d uk and uk are desired and current network output values (k=1,..,n), respectively. Parameters
E (u k (t ) u kd (t )) y1 j w jk
w jk , a ij , b j , (i=1,..,m,
Here i=1,..,m, j=1,..,r, k=1,..,n. Using equations (8-12), derivatives in (7) are determined and the FNS parameters correction was performed.
29 | P a g e www.ijacsa.thesai.org
(IJACSA) International Journal of Advanced Computer Science and Applications, Vol. 8, No. 12, 2017
B. Experimental Result Analysis The structure of the FNS classification model is designed using 5 inputs and 2 output neurons. If we use traditional neuro-fuzzy structure as seen in [27], for 5 inputs and 2 cluster centers, pow(2,5) = 32 rules is generated. Here using all possible combinations of inputs and cluster centers the rules is designed, leading to the design of larger number of rules. In contrast to these researches, in the paper, the number of rules is selected according to the clustering results, equal to cluster centers. At first, the FNS based classifier shown in Fig. 4 is trained using back propagation learning algorithm and is utilized to classify the BUPA dataset. The number of inputs is five and the number of outputs is two; 0 represent healthy cell and 1 represent disordered cell. During simulation, different numbers of rules are used. The number of rules in FNS guarantees significant training while minimally keeping the time expense. After processing the maximum and minimum values of each used feature, both classes are accurately mapped or calculated [36]-[39]. During this learning stage, initial arbitrary values of weights are randomly initialized to values between 0 and 1. The learning and momentum rates were set through different investigations keeping in mind the end goal; attaining the required minimum error value. Here, we set the learning rate and the momentum coefficient to 0.01 and 0.002 respectively. With the implementation of (6), we were able to obtain RMSEs of 0.21 and 0.59 in experiment 1 and experiment 2, respectively.
The training of the FNSs based classifier were performed using gradient descent learning algorithm. As earlier discussed, the 10 fold cross validation method was utilized. Table I and Fig. 5 shows the results of the two experiments and RMSE plot of experiment 1, respectively. It is seen that the system learned well as the error tend to decrease after each epoch or iteration. The networks were able to reach RMSEs of 0.215 and 0.59 in experiment 1 and 2, respectively, which are good enough as applauded by a radiologist at the prestigious Near East University hospital. Moreover, it should be noted that the time taken for the FNSs (experiment 1 and 2) to learn and achieve the minimum square errors are 39 and 43 seconds, respectively. IV. CONCLUSION In this study, we present a fuzzy neural system with very high potentials to detecting liver disorders. The algorithm is capable of simulating human knowledge and experience from complex decision makings using approximate information and in environments with uncertainty. The explored FNS approach operates in accordance with particular characteristics for detecting liver disorders. From the input data, detection is categorized as very low, low, median, and high. Regarding the obtained results from the two experiments, total accuracies of 97.39% and 72% were obtained. It is glaring that experiment 1 outperformed experiment 2 with 25.39% margin. Comparison of these results with researches by other researchers exploring different machine learning approaches on the same data set show that our proposed algorithm is of high esteem and could be recommended for radiologists for proper diagnosis and treatment of liver disorderliness. Furthermore, we are of no claim that our proposed system has the best performance ever. To improve on the performance, future contributions to this problem would feature the repetition of the experiment using recent textual/image dataset of liver on other machine learning techniques such as autoencoders, stacked autoencoders and other deep learning techniques to obtaining more optimal results. [1]
[2]
[3] Fig. 5. RMSE curve. [4] TABLE I. Network data Feature vectors(model inputs) Number of fuzzy rules Learning rate (η) Momentum rate (α) Epochs Training time (secs) RMSE Recognition rate (%)
FNSs PERFORMANCE Experiment 1 (x6≥3)
Experiment 2 (x6>5)
5
5
32 0.01 0.002 1000 39 0.215 97.39
32 0.01 0.002 1000 43 0.59 72
[5]
[6]
[7]
REFERENCES H. J. Jang, Hojun Yu, and T. K. Kim, “Contrast-enhanced ultrasound in the detection and characterization of liver tumors,” International Cancer Imaging Society, 2009, DOI: 10.1102/1470-7330.2009.0015. V. Shrimali, R. S. Anand, and V. Kumar, “Comparing the performance of ultrasonic liver image enhancement techniques: a preference study,” IETE Journal of Research, 2010, Vol. 56, Issue 1. V. E. Ekong, E. A. Onibere, and A. A. Imianvan, “Fuzzy cluster means system for the diagnosis of liver diseases,” IJCST, 2011, Vol. 2, Issue 3. L. Ozyilmaz, and T. Yildrim, “Artificial neural networks for diagnosis of hepatitis disease,” Proceedings of the International Joint Conference on Neural Networks, 2003, pp. 20-24. R. Jajoo, D. Mital, S. Haque, and S. Srinivan, “Prediction of hepatitis C using artificial neural network,” ICARCV, 7th International Conference, 2002. M. Neshat, M. Yaghobi, M. B. Naghibi, and A. Esmaelzadeh, “Fuzzy expert system design for diagnosis of liver disorders,” International Symposium on Knowledge Acquisition and Modeling, 2008, pp. 252256. L. B. Gonçalves, M. M. Bernardes, and R. Vellasco, “Inverted hierarchical neuro-fuzzy bsp System: A novel neuro-fuzzy model for pattern classification and rule extraction in databases,” IEEE transactions on systems, man, and cybernetics, part c: applications and reviews, 2006, vol. 36, no. 2.
30 | P a g e www.ijacsa.thesai.org
(IJACSA) International Journal of Advanced Computer Science and Applications, Vol. 8, No. 12, 2017 [8]
[9] [10]
[11]
[12]
[13]
[14]
[15]
[16]
[17]
[18]
[19]
[20] [21]
[22]
H. Abe, H. Yokoi, M. Ohsaki, and T. Yamaguchi, “Developing an integrated time-series data mining environment for medical data mining,” 7th IEEE International Conference on Data Mining, 2007, pp. 127-132. D. Drăgulescu, and A. Albu, “expert system for medical predictions,” IEEE, 2007, pp. 123-128. K. Dong-Hoi, J. Kim, W. C. Sung, and J. Y. Cheong, “Chronic hepatitis classification using SNP data and data mining techniques,” FBIT, 2007, pp. 81-86. P. Schemmer, H. Friess, U. Hinz, A. Mehrabi, T. Kraus, K. Z'graggen, J. Schmidt, W. Uhl, and M. Büchler, “Liver transection using vascular stapler: a review,” World J Surg. 2006 Mar; 30(3):419-30. S. S. Kumar, and R. S. Moni, “Diagnosis of liver tumor from CT images using fast discrete curvelet transform,” IJCA,Special Issue on CASCT 2010, (1):1–6. W. Qiu, F. Xiao, X. Yang, X. Zhang, M. Yuchi, and M. Ding, “Research on fuzzy enhancement in the diagnosis of liver tumor from B-mode ultrasound images,” I.J. Image, Graphics and Signal Processing, 2011, 3, 10-16. A. Branzan-Albu, D. Laurendeau, and C. Moisan, “Tumour detection in MR liver images by integrating edge and region information,” Proc. of Modelling and Simulation for Computer aided Medicine and Surgery, INRIA, 2002. Rocquencourt, Nov. 12-15. P. K. Selvaggi, S. Scaramuzza, D. Garbagnati, F. Vergnaghi, and D. L. Mainardi, “Radiofrequency ablation of liver tumors: quantitative assessment of tumor coverage through CT image processing,” BMC Medical Imaging, 2013, http://doi.org/10.1186/1471-2342-13-3. K. Kim, C. W. Kim, and G. H. Kim, “Area extraction of the liver and hepatocellular carcinoma in CT scans,” J Digit Imaging. 2008 Oct; 21: 89–103. M. Matsuo, M. Kanematsu, K. Itoh, T. Murakami, Y. Maetani, H. Kondo, S. Goshima, N. Kako, H. Hoshi, J. Konishi, N. Moriyama, and H. Nakamura, “Detection of malignant Hepatic tumors with ferumoxidesenhanced MRI: comparison of five gradient-recalled echo sequences with different TEs,” American Journal of Roentgenology 2004 182:1, 235242. K. Mala and V. Sadasivam, “Automatic segmentation and classification of diffused liver diseases using wavelet based texture analysis and neural network,” 2005, pp. 216-219. doi: 10.1109/INDCON.2005.1590158. R. Martin, N. Bordes, T. Hugh, and B. Pailthorpe, “Semi-automatic feature delineation in medical images,” In Proceedings of the Australasian symposium on Information Visualisation, 2004 Vol. 35. Australian Computer Society, Inc., 127-131. J. McDermott, and R. S. Forsyth, “Diagnosing a disorder in a classification benchmark,” Pattern Recognition Letters 73 (2016) 41–43. P. D. Turney, “Cost-sensitive classification: Empirical evaluation of a hybrid genetic decision tree induction algorithm,” J. Artif. Intell. Res.2(1995)369–409. R. Abiyev, N. Akkaya, E. Aytac, I. Günsel, and A. Çağman, “Braincomputer interface for control of wheelchair using fuzzy neural networks,” BioMed research international (2016).
[23] R. Abiyev, V. .H. Abiyev, and C. Ardil, “Electricity consumption prediction model using neuro-fuzzy system,” 149 (2005): 1653. [24] A. Helwan, J. B. Idoko, and R. H. Abiyev, “Machine Learning Techniques for Classification of Breast Tissue,” 9th International Conference on Theory and Application of Soft Computing, Computing with Words and Perception, ICSCCW 2017, Book Series: Procedia Computer Science. [25] A. Helwan, D. Uzun Ozsahin, R. Abiyev, and I. John Bush, “One-year survival prediction of myocardial infarction,” International Journal of Advanced Computer Science and Applications (IJACSA), 2017, 8(6). [26] L. A. Zadeh, “Information and control,” 1965, Volume 8, Issue 3, pp. 338-353. [27] R. Jang, C. T. Sun, and E. Mizutani, “Neuro-fuzzy and soft computing,” New Jersey: Prentice-Hall (1997). [28] R. H. Abiyev, and S. Abizade, “Diagnosing parkinson's diseases using fuzzy neural system,” Computational and Mathematical Methods in Medicine. Volume 2016 (2016), Article ID 1267919. [29] E. H. Mamdani, and S. Assilian, “An experiment in linguistic synthesis with a fuzzy logic controller,” Int J Man Mach Stud., 1997, 7,1–3. [30] T. Takagi, and M. Sugeno, “Fuzzy Identification of Systems and Its Applications to Modeling and Control,” IEEE Syst., Man, Cybern., 1985, 15, 116- 132. [31] R. Abiyev, and O. Kaynak, “Fuzzy wavelet neural networks for identification and control of dynamic plants – a novel structure and a comparative study,” IEEE T IND ELECTRON, 2008, 55, 3133-3140. [32] R. H. Abiyev, N. Akkaya, E. Aytac, I. Günsel, and A. Çağman, “Braincomputer interface for control of wheelchair using fuzzy neural networks,” Biomed Research International, 2016, Volume 2016. [33] R. Abiyev, “Fuzzy wavelet neural network based on fuzzy clustering and gradient techniques for time series prediction,” Neural Comput Appl, 2011, 20, 249-259. [34] R. H. Abiyev, “Time Series Prediction Using Fuzzy Wavelet Neural Network Model,” ICANN-2006, Lecture Notes in Computer Sciences, Springer-Verlag, Berlin Heidelberg, 2006, pp.191-200. [35] R. H. Abiyev, “Fuzzy Wavelet Neural Network for Control of Dynamic Plants,” International Journal on Computational Intelligence, 2004, Vol. 1, Number 2, pp.163-167. [36] K. Dimililer, and I. J. Bush, “Automated classification of fruits: pawpaw fruit as a case study,” International conference on man–machine interactions, 2017, pp. 365-374, Springer, Cham. [37] I. J. Bush, R. H. Abiyev, and M. K. Ma’aitah, “Intelligent machine learning algorithms for colour segmentation,” WSEAS Transactions on Signal Processing, 2018. [38] I. J. Bush, R. Abiyev, M. K. S. Ma’aitah, and H. Altıparmak, “Integrated artificial intelligence algorithm for skin detection,” International Conference Applied Mathematics, Computational Science and Systems Engineering (AMCSE 2017), ITM Web of conferences, 2018. [39] I. J. Bush, and K. Dimililer, “Static and dynamic pedestrian detection algorithm for visual based driver assistive system,” ITM Web of Conferences, 2017, Volume 9, Pages 03002.
31 | P a g e www.ijacsa.thesai.org