new query mode which is the intelligent generic statistical query mode for any ... application to execute the query with only the criteria fields he filled, and then the .... exist, it starts from the logical schema and converts it into lists of concepts and ...
International Journal of Applied Information Systems (IJAIS) – ISSN : 2249-0868 Foundation of Computer Science FCS, New York, USA Volume 5– No.2, January 2013 – www.ijais.org
Intelligent Generic Statistical Query Mode Ali El-Matarawy Faculty of Computers and Information, Cairo University
ABSTRACT This research presents a new generic approach for defining a new query mode which is the intelligent generic statistical query mode for any database application. It is combined with the optimized intelligent generic query mode (IGSQM) for relational database applications. Since it is generic then it can be used in developing any database application without rewriting any source code. It is intelligent in the sense that it submits to user an enormous amount of statistical reports without the need or support of the application developer, actually the total number of those statistical reports depends on the database schema. The Interface of the new approach is very simple in use. The new approach saves time for developing the required statistical reports by the user. The developed applications which exploit the proposed intelligent generic statistical query mode will empower users and improve the quality and efficiency of service provided by those applications. IGSQM can be used widely in scientific statistical researches. It has been implemented using PowerBuilder (release 11.5) as a front end tool and Adaptive Server Anywhere (one of Sybase products) as a database engine. This research describes the design of the optimized intelligent generic query mode and its interface.
Keywords Query mode, entry mode, update mode, statistical query mode, relational database applications, optimizing query mode, generic query mode, intelligent query mode, database field, computed field.
1. INTRODUCTION Scientists sometimes use statistics to describe the results of an experiment or an investigation. This process is referred to as data analysis or descriptive statistics. Scientists also use statistics another way; if the entire population of interest is not accessible to them for some reasons; they often observe only a portion of the population (a sample) and use statistics to answer questions about the whole population [1]. Statistics is important and scientists use it widely but at the same time up till now there is no statistical query mode is applied to display for them any simple statistical report they require in their research without the need of asking the developer of the application they use to build it. This was the motivation for this research to develop the new intelligent generic statistical query mode (IGSQM). In this section we will introduce a brief history for all query modes, and then we will introduce a definition for IGSQM. A query is a question or task a user asks of a database [2]. Query mode is the mode in which the user can ask the database some questions to get answers for them while data entry mode is the mode in which the user creates or edits records [3] in the underlying tables in the database. The basic steps involved in performing a query are [4]:
Entering query criteria The information defining the query is entered into the Query datawindow (form).
Performing the query The query is performed and all records in the database which match the information defining the query and which the user is privileged to view are retrieved.
Displaying the retrieved records The matching records are displayed and can now be stored, copied, edited, re-ordered, reported on and deleted. According to the history of developing database applications and its query mode, those query modes can be classified into four types. The first query mode was so simple and very poor either in its efficiency in replying to many queries that the user may need at sometimes, or in its interface, its idea was based on displaying a menu (called query menu) to the user contains the available or allowed criteria to retrieve data. The main two disadvantages for using this type is first you can't get an answer for any question is not included in the query menu, and if you want that you should call the application developer and asking him to develop the new query you want, second is for its interface, it always needs from the user to read the query menu and sometimes it is too long to know the location of required query in the query menu, this will be sometimes so difficult. The second query mode is too much better than the first one. Its interface depends on the data entry menu itself. When the user enters this query mode, the application clears all of previous data and asks the user to write criteria for only some or all of the displayed fields, and after that the user asks the application to execute the query with only the criteria fields he filled, and then the matched records will be displayed to him. The main advantages of this technique are first, you can ask the application for any query you want related to the displayed fields, second it is easier in use since it omitted the long query menu, third it allowed answering many queries to the user that may he needs, so it decreases the calling back to the developer. The disadvantages for this query mode are first, the user can't constitute a query containing fields outside the entry menu and are found in other tables with a direct or indirect relation to the updated table in the entry menu, second, its interface needs from the user to know some SQL syntax such as logic relational words, logic operators, some symbols such as "*" or "%" to express some characters he doesn't know in the criteria field, third there is a great ambiguous of using many criteria fields in the mind of the user because all of the criteria fields is ANDED together or ORED together and in most of applications he should first specify the type of the logic relation among all fields and can't specify an OR relation for some fields and an AND relation for other fields.
30
International Journal of Applied Information Systems (IJAIS) – ISSN : 2249-0868 Foundation of Computer Science FCS, New York, USA Volume 5– No.2, January 2013 – www.ijais.org
The third query mode is a new query mode submitted in [4], it is called "Intelligent Generic Query Mode" (IGQM). It is a combined mode between the first one and the second one, this is because the second query mode is applied only to the entry menu the user is using and the user would like to get some data is related to the updated table in the entry menu but at the same time is in a relation with other tables that has some fields the user may be would like to specify a criteria values for them, the third query mode is the most common used in any relational database application. The fourth query mode is submitted in [5] and it is an optimization to the intelligent generic query mode (OIGQM) simply it enabled the user to deal with computed fields as if is exactly like a database field. It submits to the user trillions of queries in a simple interface [5]. After introducing all query modes, a definition to the new intelligent generic statistical query mode (IGSQM) can be introduced; it is a new generic query mode that may be combined with OIGQM to enable the user to preview or print a statistical report according to some criteria defined by the user in a very simple interface. IGSQM can be widely used in all database applications especially for scientific statistical researches fields such as medical, engineering, marketing, etc. For example, in hospital system in which all patients data are saved and a doctor who is one of the users of the system wants to know if there is a relation between the age of the patient and a specific disease, by only one click the statistical reports will be displayed, and the doctor from it can induce if there is a relation or not. IGSQM enable the user to display a histogram statistical report according to query criteria defined by the user. The rest of this paper is organized as following: Some related work is introduced in section 2. The interface design of the new approach is presented in sections 3. The description of the new approach is introduced in section 4. Section 5 presents the benefits of combining OIGQM and IGSQM. Section 6 presents the advantages of using IGSQM while Section 7 introduces the conclusion and future work. Section 8 and section 9 are the acknowledgements and references for this research.
Instead of starting from a conceptual diagram that may not exist, it starts from the logical schema and converts it into lists of concepts and relations. Intelligent Generic Query Mode (IGQM) is a new query mode submitted in [4] titled IGQM which has omitted all the disadvantages of the previous query modes mentioned in section 1. Optimizing Intelligent Generic Query Mode (OIGQM) is a the same as IGQM but it deals with the computed fields ad if is a database field, this raise the possible generated query to trillions of queries instead of billions of queries as explained in [5]. None of all of these query modes submit to the user any statistical queries. The normal one used so far is for any required statistical query by the user the developer builds a screen for it to specify the statistical query criteria and hence the total number of those queries in the application is so limited. Also, after building the application and if a specific statistical report is required by the user and it is not exist in the application, the developer should takes time in developing it, this cycle doesn't support the user decision since sometimes the user should know the required information at once to take a decision.
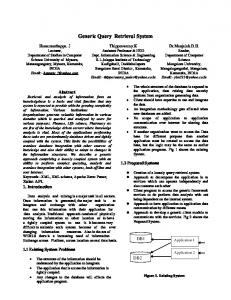
3. THE INTERFACE OF IGSQM To understand the design ideas of IGSQM it is better to explain its interface first rather than its design. The interface of IGSQM as shown in Fig.(1) consists of five buttons, the generate statistical report (GSR) button, defining Y axis value (YV) button, the x axis data range (XDR) button, defining X axis data sets (XDS) button and defining range sets for a data field (RSD) button. Those five buttons are responsible of executing the five statistical functions of the IGSQM Notice that IGSQM is available at any time whenever the entry or update mode is available. Range Data Filed Set Button Nationality Field The GSR Button
The Y value Button
2. RELATED WORK As mentioned in [4, 6] there are different approaches to query formulation, focusing on the usability of these approaches for non-IT people. Query-by-form is an old practice; users can fill in and submit a form, where all fields in this form are seen as query variables. Query-by-example allows users to formulate their queries as filling a table [7]. The names of the queried relations and fields are selected first; then users can enter their keywords. Conceptual query languages are an alternative approach to query formulation. As many databases are modeled conceptually using EER or ORM diagrams, one can also query these databases starting from those diagrams. Users can select some concepts from a given conceptual diagram, and their selection is automatically translated into SQL queries. This scenario was implemented by several EER-based [8, 9] and ORM-based [10, 11] approaches. ConQuer [12] is another ORM-based language, but it has some nice features indeed.
The X Data Range Button
The X Data Set Button
Fig. (1) Statistical query mode Interface
31
International Journal of Applied Information Systems (IJAIS) – ISSN : 2249-0868 Foundation of Computer Science FCS, New York, USA Volume 5– No.2, January 2013 – www.ijais.org
Fig. (1) shows a student entry datawindow/form of a school application , it shows the five buttons o IGSQM interface, also it shows that nationality field has the focus.
3.1 THE GENERATE STATISTICAL REPORT BUTTON In any screen of a database application there is a field has the focus, when the user click the generate statistical report (GSR) button a histogram statistical report is displayed as shown in Fig. (2) to the user in which the x axis is the all possible values for the field which has the focus and the y axis is the corresponding count of each value of the x axis (this value can be changed as described in later in section 4.3). in this example a nationalities statistical report for the whole students in the school.
3.5 Defining X Axis Range Sets Data Field Button IGSQM divides all field controls in any screen into two groups, a combo or list box field control group or other field's control group. When a combo box field control has the focus, the X axis values will be the titles for actual field saved in this control. For example the nationality combo field control displays the nationality titles but actually it contains the nationality ID field, so when displaying the statistical report for that field control the X axis values will be the titles for those IDs either displayed or not in the combo or list box field control. For other's field controls the user should define sets for dividing the data contained by that field controls into ranges. For example suppose that a date field control has the focus such as student birth date control when the user can define sets for the data displayed and assign names to those sets, these sets names will be the values of X axis in the statistical report. The X range sets data field button is responsible for defining those rang sets for controls that are not combo or list box.
4. THE NEW APPROACH DESCRIPTION A statistical report depends on many factors, the most important ones are X axis values and Y axis values, so we save this values in a special table which should be added to the database of the application called "statistical". Mainly the table contains two fields represents the X axis value as string field and the Y axis value as numeric field. Another table its name is "statistical information" contains all information that appear once in the statistical report such as its main header tile, sub titles, graph control information, etc. Fig. (2) Students Nationality Statistical Report
3.2 Defining X Axis Range Button Now suppose for any reasons the user wants to neglect some X values and instead of not displaying them he wants to group them in "others" group. The X range (XR) button is responsible for applying this feature. Once the user clicks this button all fields titles will be displayed and the user has the ability to apply some conditions in the native language of the application over those fields.
3.3 Defining X Axis Data Sets BUTTON Another question arises what about if the user wants to compare two or more groups against nationalities. The responsible for this feature is the X data grouping (XDG) button. Once the user clicks this button all fields titles for this screen only is displayed and again the user has the ability to define his groups from them.
3.4 Defining Y Axis Value Button Finally what about if the user doesn't like that the Y axis values will be the corresponding count of the X values, suppose for example in the example here, he wants that the Y axis value will be the remaining or not paid fees for each nationality. The responsible for this feature is the Y value (YV) button. Once the user click this button all numeric fields either in the updated table of the displayed screen or other numeric fields in all tables that in a one to many relation or in many to one relation with the updated table of that screen are displayed for selecting any of them to be its value is the Y value of the statistical report.
As mentioned in [4] intelligent generic query mode (IGQM) saves most of the information of the database schema in some special tables that should be added too to the database of the application. According to the requirement of the algorithm of IGSQM extra database fields added to those tables to define all information that appear only once so the developer of the application for each field will fill and save them, also those criteria the user define for each button except for the button of generating the statistical report since it has no criteria definition by the user, its function is not like the other buttons, its function is displaying the statistical report. All IGSQM buttons except the GSR button have a function is written in the click event of that button to define the user statistical criteria during the running of application. Theese criteria are saved in those specail tables mention in [3]. Again some extra database fields is added to save those critera defined by the used during the running of the application. According to the three paragraphs mentioned above this means all data required by the algorithm of IGSQM are available for the field control which has the focus for displaying its corresponding statistical report. Those information are the corresponding database field name, the table name it is contained in, its data type, table names of those tables that are in a relationship with the updated table of that screen, all criteria defined by the user through the use of the four buttons during the running of application, …., etc. A function "fill_statistical_tables" is called in the event click of the "generate statistical report" button. it is responsible for filling the statistical table in the database by X axis values and their corresponding Y values. First it uses the SQL delete to
32
International Journal of Applied Information Systems (IJAIS) – ISSN : 2249-0868 Foundation of Computer Science FCS, New York, USA Volume 5– No.2, January 2013 – www.ijais.org
clear the statistical and statistical information tables that might have data from a previous report generation process, second it builds the required SQL insert combined with select statements and storing them in string variables for later executed by the SQL execute statement to fill the statistical and statistical information tables. Once the statistical and statistical information tables have been built, a statistical report window is opened and displayed. This window has a datawindow/form based on a select statement contains the two statistical tables. There is a graph control inside the datawindow/form gets all of its data from the statistical table fields in the select statement, all other information in the report is got from the statistical information table fields in the select statement.
5. COMBINING IGSQM WITH OIGQM OIGQM as proved in [5] submits in general for most of databases trillions of reports. OIGQM is like any query mode, it brings to memory a subset of the whole data set which the user defined its criteria before running or executing the query. A very wonderful and important note should be mentioned that IGSQM applies only over the set of those data got by executing a query. For example assume the same screen of students in the students application which is presented in section 3, also suppose two things, first no query has been executed so the user see or display all students of the school, second the nationality field has the focus; then when the user clicks the generate statistical button, the statistical report shown in Fig.(2) will be displayed, it will contain all nationalities for all students in the school as X axis values with their corresponding count (or according to the user defined by using the YV button) as Y axis values. But if the user used the feature of OIGQM and h created an executed a query to get or display only those students in the school in the first grade, again now if the user clicks the generate statistical button, then a statistical report as shown in Fig.(2) will be displayed, but it will contain only all nationalities for the first grade students in the school as X axis values with their corresponding count (or according to the user defined by using the YV button) as Y axis values. Since OIGQM submits trillions of reports to the user n most databases then this combination introduces to the user for most of databases trillions of statistical reports.
6. ADVANTAGES OF IGSQM
IGSQM is generic so it can be used in any database application to generate statistical reports with no need of writing any other code for different database that have different design and schema. IGSQM is intelligent in the sense that it submits to the user an enormous amount of statistical reports, in most databases it submits trillions statistical reports. IGSQM Interface is very simple, only it uses five buttons for defining its interface. IGSQM Interface is available at any time of the entry or update mode is used. IGSQM saves time for developing the required statistical reports by the user. IGSQM empowers users and improve the quality and efficiency of service provided by those applications that use it.
A brief comparison between the new technique (IGSQM) and the current statistical query used is presented in the following table (1). Table (1): Comparison between the new query mode and "Query by Form" query mode Seq. IGSQM Normal statistical query 1 Trillions of statistical A limited number of reports can be statistical reports are generated available 2 Has a very simple Each statistical query interface for all should have a criteria statistical queries screen 3 No time is required The developer should take for generating new his time for developing statistical reports this new statistical report 4 The user can control The user can't control the the X-axis and Y-axis X-axis and Y-axis values values
7. CONCLUSIONS & FUTURE WORK The intelligent generic statistical query mode (IGSQM) is a new generic query mode submits to the user trillions of statistical reports for most of databases in a very simple interface. Simply the interface of IGSQM depends only on five generic buttons. IGSQM is available whenever the data entry or update mode is available. IGQSM is useful for any database application especially those are related to scientific research. it supports the user decision. Our future work is enhancing IGSQM by adding another button for it to let the user select the statistical diagram for his statistical report since up till now histogram is the only one available.
8. ACKNOWLEDGMENTS Thanks to Dr. Reem Bahgat for her constant support.
9. REFERENCES [1] Shirley Dowdy, Stanley Weardon, Daniel Chilko, Statistics For Research, Third Edition, John Wiley & Sons, Inc. Publication. [2] Albert K.W. Yeung, G. Brent Hall, Spatial Database Systems, Design, Implementation and Project Management, Published by Springer [3] Turban E., & Aronson J., (1998), Decision Support Systems and Intelligent Systems, 5th Edition, Prentice Hall, New Jersey, ISBN 0-13-740937-0 [4] Ali El-Matarwy, Improving the Query Mode and its Interface for Relational Database Applications, First National Symposium on Information Technology, journal 2005, King Saud University faculty of Computer Science Information System. [5] Ali El-Matarwy, “Optimizing the Intelligent Generic Query Mode and its Interface for Relational Database Applications”, published in IJAIS journal, December 2012. [6] Mustafa J., Marios D. Dikaiakos, MashQL: A Query-byDiagram Topping SPARQL Towards Semantic Data Mashups, University of Cyprus mjarrar. [7] Zloof, M.: Query-by-Example: A Data Base Language. IBM Systems Journal, 16(4). 1977.
33
International Journal of Applied Information Systems (IJAIS) – ISSN : 2249-0868 Foundation of Computer Science FCS, New York, USA Volume 5– No.2, January 2013 – www.ijais.org
[8] Czejdo, B., Elmasri, R., Rusinkiewicz, M., and Embley, D.:An algebraic language for graphical query formulation using an EER model. In Proceedings of the ACM Conference on Computer Science. 1987. [9] Parent, C., and Spaccapietra, S.: About Complex Entities, Complex Objects and Object-Oriented Data Models. In Proceedings of the IFIP 8.1 conference. 1989.
[10] De Troyer, O., Meersman, R., and Verlinden, P.: RIDL on the CRIS Case: A Workbench for NIAM. In Proceedings of the IFIP.8.1 Conference. 1988. [11] Hofstede, A., Proper, H., and van der Weide, T.: Computer Supported Query Formulation in an Evolving Context. In Proceedings of the ADC. 1995. [12] Bloesch, A. and Halpin, T.: Conceptual Queries usingConQuer–II. In Proceedings of the ER. LNCS, Springer. 1997.
34