Intelligent Network Design: User Layer Architecture and its Application Yu Lu
Mehul Motani and Wai-Choong Wong
Graduate School for Integrative Science and Engineering National University of Singapore, Singapore Email:
[email protected]
Department of Electrical and Computer Engineering National University of Singapore, Singapore Email: {motani, wong_lawrence}@nus.edu.sg
Abstract— This paper addresses building networks that emphasizes on user-centric human computer interaction and context awareness. To achieve this user-centric intelligent network goal, we propose to explicitly take the end-user into account by defining a new layer called the User Layer above the traditional application layer. By exposing some lower layer information to the end-user, the new User Layer establishes a feedback loop between the end-user and the underlying network infrastructure, empowering the end-user to control and influence network performance based on his own behavior and preferences. A cross-layer design approach using a shared database between the different lower layers is adopted. To illustrate the User Layer in action, we present an exemplary implementation of the User Layer, which can dynamically allocate network resources by leveraging on the TCP flow control mechanism. We evaluated network performance via simulation and show that such a design improves the user perceived quality of service (QoS). Keywords— user centered design, cross layer design, user modeling, dynamic resource allocation
I.
INTRODUCTION
It is well-known that the traditional seven-layer OSI reference model and the five-layer Internet protocol stack have played prominent roles in the success of modern computer networks. They partition complicated network related tasks into different layers, and each layer has specific features and functionalities with peer interactions at equivalent layers across a network. Sometimes, neither of these existing layered architectures can be highly adaptive and quality of service (QoS) efficient by sharing state information among different layers. Thus researchers propose cross-layer design approaches which refer to the protocol designs that actively exploit the dependence between protocol layers to obtain performance gains. There are many cross-layer design proposals summarized in [1] and they typically follow some basic approaches including vertical calibration across layers [2] and merging of adjacent layers. With the fast evolving Internet technologies, building networks with Ambient Intelligence (AmI) has emerged as the new requirement for network architecture design. The new network architecture with Ambient Intelligence emphasizes user-centric and personalized design principles, where the enduser occupies the most crucial position. The end-user refers to
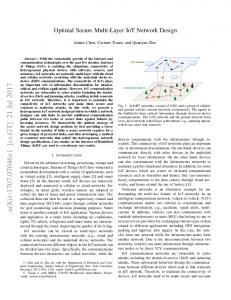
the individual who employs networked applications on a network host. Unfortunately, neither the seven-layer OSI reference model nor the five-layer Internet protocol stack takes end-user, a critical and key element, into consideration in the their architecture design. Therefore, we propose to explicitly define a new layer, which is called the User Layer, above the traditional application layer as shown in Fig. 1. The proposed User Layer aims to empower the end-user to control and influence network performance, which eventually improves end-user satisfaction and meets the end-user’s dynamic requirements. To achieve this user-centric intelligent network goal, we adopt a cross-layer design approach using a shared database to gather relevant and useful information from both the lower layers and the end-user. Based on the collected information, the User Layer generates the control signals for the different layers and adjusts different network parameters in real-time. The augmentation of this new User Layer to the existing network architecture aims to provide intelligent, personalized and adaptive network services to the end-user. In order to illustrate the proposed User Layer framework in action, we also build an exemplary User Layer. The User Layer implementation can make intelligent decision to dynamically allocate the network resource at the end-user side. To achieve this goal, the User Layer establishes a feedback loop between the end-user and the underlying traditional Transport Layer. Finally, the exemplary User Layer shows that it can effectively improve the end-user perceived quality of service (QoS) and achieve the goal of a user-centric intelligent network. The rest of this paper is organized as follows. In section II, we propose the architecture of the User Layer and introduce each of its main components. In section III, we present an exemplary User Layer implementation and give a detailed description of the three sub-systems, together with an Internet experiment and simulation results. We discuss the future work and conclude in section IV.
II.
SYSTEM OVERVIEW
A system block-diagram with our proposed User Layer is illustrated in Fig. 2, and there are three main components: User Interface, User Model Generation sub-system, and Control sub-system.
• The User Interface provides end-users a direct way to interact with the network and influence network performance. For example, end-users can express their own individual perception about current network performance by simply pressing the corresponding button on the User Interface or through other efficient ways. The User Interface will automatically record such end-user interaction information together with the relevant real-time information from the operating system and context environment. Subsequently, the User Interface delivers those significant and crucial interaction data to the User Model Generation sub-system. • The main task of the User Model Generation sub-system is to build the User Model for each specific end-user, given enough online interaction data gathered by the User Interface. The User Model helps the User Layer to ascertain each end-user’s stable behavior pattern, preference or intention. The User Model Generation subsystem may adopt some data mining and machine learning methods to generate an accurate and effective User Model. Based on the User Model, the User Layer can predict the end-user’s future behavior and generate the corresponding control rules for the Control sub-system. • The Control sub-system establishes a control feedback loop between the User Layer and the lower layers through the shared database. It mainly controls the parameters of different layers in accordance with the control rules derived from the User Model Generation sub-system. The Control sub-system aims to improve the end-user’s satisfaction and enhance the perceived network performance by adjusting the parameters in the corresponding layers and protocols. The above three sub-systems compose the entire new User Layer, which empowers the end-user to control and influence the network performance based on their own needs and intention. The new User Layer architecture incorporates the end-user into the network architecture design with the prime emphasis on the user-centric intelligent network design.
III.
EXEMPLARY USER LAYER IMPLEMENTATION
In order to show the proposed User Layer in action, we build an intelligent network system with an exemplary User Layer. This User Layer implementation aims to improve enduser perceived quality of service (QoS) by empowering the end-user to influence the bandwidth consumption of each running application. We design an effective User Interface for collecting the user’s perception about network performance as well as the operating system information in real-time. We introduce the decision tree as the data mining algorithm for building the User Model. We enable the Control sub-system to establish a feedback control loop between the User Layer and the Transport Layer as shown in Fig.2. It mainly controls the sending rate of each application by means of adjusting the relevant transmission protocol parameters.
Fig. 1. User Layer above application layer.
The whole intelligent network system can dynamically allocate the network resource at the end-user side to improve the end-user’s perceived QoS. The details of each sub-system in the User Layer implementation are described in the following sub-sections from III-A to III-C. A. The User Interface and Online Data Collection As mentioned in section II, the User Interface in the User Layer aims to provide the end-user a direct and efficient way to interact with the underlying network. In this application, our User Interface provides the end-user a simple and friendly button-based binary choice to capture the end-user’s general perception of network performance. As shown in Fig. 3, the “smile face” button means that the end-user is satisfied with the current network performance and the “sad face” button means otherwise. Therefore, what the end-user needs to do is just to press either button, which represents his real-time feeling: satisfied or dissatisfied about the current network performance. The second main function of the User Interface is to monitor and record relevant system information in real-time. The system information includes all the active processes in the operating system, real-time bandwidth consumption of each networked application and other important data. When the end-user presses either button on the User Interface, all the corresponding real-time system information and user’s perception will be automatically recorded into a dataset. Then it will be used for the further analysis by the User Model Generation sub-system. To calculate bandwidth consumption of each networked application in real-time, we need to intercept the packet flowing through the network adapter without any further processing from the kernel. Thus we implement a third party driver packet called WinPcap [3] to fulfill this function on the Win32 operating system platform. We use Microsoft Office Access to store the real-time data from both the end-user and the network system. Our User Interface is developed using C++ under Microsoft Visual Studio 2008 within the Microsoft .NET framework.
User Layer { Arrival Rate} { Advertised Wnd}
Fig. 2. System block diagram with User Layer.
In our experiment, we limit the overall incoming throughput to 56Kbps to model the bottleneck existing at the end-user’s access link. The sample experiment dataset collected by the User Interface is shown in Fig. 4, where we can see that three networked applications always work on the end-user’s host including QQQTV, CuteFTP and Windows MSN. QQQTV is an online IPTV software product for watching live sports programs and it has gained popularity among the younger generation. CuteFTP is a FTP client program for downloading files using the FTP protocol, and MSN is a prevalent text-based instant message (IM) application. In Fig. 4, we can also see that the end-user’s realtime perceptions of network performance and the corresponding bandwidth consumption of each networked application are all recorded to the dataset. B. The User Model Generation Sub-system After the User Interface collects sufficient online interaction data, the User Model Generation sub-system starts to extract hidden patterns and build the User Model based on those data. We tested several data mining methods with the intention of uncovering hidden user behavior patterns, and the methods include Bayesian Network, Support Vector Machine and Decision Trees. Finally, we employ Decision Tree C4.5 in this User Layer application to build the User Model. It is mainly because of the readability of the Decision Tree, which means that the results can be interpreted as a series of IFTHEN statements. These statements can represent the enduser’s personal preference and thus can be further translated into the control rules for the Control sub-system. Moreover, the decision tree C4.5 can efficiently deal with both numeric and nominal attributes, and it is quite suitable for the collected data in our experiment. As one of the most extensively researched methods of supervised learning algorithm used in data mining, the Decision Tree is a tree-structured classifier with high dimensionality and a detailed description including C4.5 algorithm can be found in [4] [5].
Fig. 3. Binary User Interface.
As mentioned earlier, whenever the end-user presses the button on the User Interface, one instance data is automatically recorded to the dataset. Each instance contains several attributes including Process Name, Number of Threads, Bandwidth Consumption, User Feeling and Update Time, as illustrated in Fig. 4. User Feeling is the class label and it actually defines two classes for constructing the decision tree: satisfied or dissatisfied (about the network performance). Most of the other attributes are numeric attributes and independent of each other. With the help of the data mining tool Weka [4], we construct the decision tree using the following procedure: 1) Preprocessing dataset: In order to avoid overfitting and poor predictive performance, we use an attribute filter to remove some redundant attributes, such as Update Time and Process ID. Moreover, we convert the dataset files from MDB format to CSV format. 2) Building the tree: We employ the Decision Tree C4.5 algorithm (Revision 8) to construct the multi-way branches tree based on the experimental data described in III-A, and the sample data are shown in Fig. 4. We set 0.3 as the confidence threshold for pruning and 2 as the minimum number of instance permissible at each leaf. We select the stratified 10fold cross-validation which is a standard way of predicting the training error rate of a decision tree.
Process1 QQQTV.exe QQQTV.exe QQQTV.exe QQQTV.exe QQQTV.exe QQQTV.exe QQQTV.exe QQQTV.exe QQQTV.exe QQQTV.exe QQQTV.exe QQQTV.exe
Process2 ftpte.exe ftpte.exe ftpte.exe ftpte.exe ftpte.exe ftpte.exe ftpte.exe ftpte.exe ftpte.exe ftpte.exe ftpte.exe ftpte.exe
Process3 msnmsgr.exe msnmsgr.exe msnmsgr.exe msnmsgr.exe msnmsgr.exe msnmsgr.exe msnmsgr.exe msnmsgr.exe msnmsgr.exe msnmsgr.exe msnmsgr.exe msnmsgr.exe
Thread number 56 56 57 56 66 68 66 67 60 61 61 60
QQQTV Bandwidth 39941 39332 41945 29931 29946 22641 0 0 0 0 41541 39656
CuteFTP Bandwidth 2006 1886 206 22006 22506 28006 18036 436 32436 32298 0 0
MSN Bandwidth 485 0 235 356 0 125 0 1054 302 0 357 126
User Feeling satisfied satisfied satisfied dissatisfied dissatisfied dissatisfied satisfied satisfied satisfied satisfied satisfied satisfied
Update Time 2009/8/3 10:12 2009/8/3 11:23 2009/8/3 19:15 2009/8/3 20:02 2009/8/4 9:16 2009/8/4 10:07 2009/8/4 10:16 2009/8/4 11:27 2009/8/5 12:08 2009/8/5 13:18 2009/8/5 21:29 2009/8/5 21:32
Fig. 4. Sample of the experimental dataset.
3) Constructing the User Model: The final pruned decision tree is shown in Fig. 5 and the proportion of correctly classified instance is 75% under the 10-fold cross-validation test mode. The generated decision tree is quite interesting and meaningful, and it gives the following User Model: a) If the bandwidth consumption of CuteFTP is below 18036 bps, then the end-user will be always satisfied with the network performance. b) If the bandwidth consumption of CuteFTP is above 18036 bps and the bandwidth consumption of QQQTV is above 0, then the end-user will be dissatisfied with the network performance. c) If the bandwidth consumption of CuteFTP is above 18036 bps and the bandwidth consumption of QQQTV is equal to 0, then the end-user will be also satisfied. From the above User Model, we can easily see that the end-user is much more sensitive to the bandwidth consumption of QQQTV than CuteFTP. Meanwhile, we also note that the bandwidth consumption of MSN almost has little influence on end-user perception of network performance. So we can infer that the end-user shows personal preference for QQQTV over the other two applications when they all running simultaneously. Therefore, we can derive the following effective control rules for the Control sub-system of the User Layer: 1) When CuteFTP bandwidth consumption is below 18036 bps, no action is taken by the Control sub-system. 2) When QQQTV is active and CuteFTP bandwidth consumption is above 18036 bps, the Control sub-system should decrease CuteFTP bandwidth consumption to 18036 bps or smaller. QQQTV should be given priority to obtain the extra bandwidth. 3) The Control sub-system does not need to adjust and control the bandwidth consumption of MSN.
Fig. 5. Pruned Decision Tree for UM
C. The Control sub-system According to the derived control rules and the User Model, the Control sub-system adjusts the appropriate parameters in the corresponding layers through the shared database. In this case, the Control sub-system needs to dynamically allocate the bandwidth for each application at the end-user side. To realize this goal, the Control sub-system establishes the control feedback loop between the User Layer and the Transport Layer as shown in Fig. 2. The Control sub-system leverages on the flow control mechanism of Transmission Control Protocol (TCP) [6] to limit the receiver’s advertised window size of each TCP connection. The advertised window can limit the maximum number of bytes a sender is allowed to transmit before receiving the next acknowledgment from the receiver side. By manipulating the receiver socket buffer size, we can limit the receiver advertised window, which is included in each acknowledgement returned to the TCP sender. There has been some good prior work on adjusting the advertised window size in [7] [8]. Most prior works follow a similar mathematical model for the sending rate V of a TCP connection given by:
60000 QQQTV CuteFTP MSN
50000
Bandwidth(Bits/s)
40000
Fig. 6. Network topology in NS-2.
V=
W rec RTT
30000
20000
(1) 10000
rec
where W is the receiver advertised window size in bits. RTT is the average round trip time for the corresponding flow. The above mathematical model sufficiently describes the TCP flow control process although it simplifies the complicated TCP mechanism and congestion control dynamics [9]. The assumptions for the above model are:
0
iv. Only TCP-based applications are considered since a majority of network traffic is TCP-based. From Eqn. (1), we can see that adjusting the advertised window size at the end-user side can directly control the sending rate at the server side and thus we can redistribute the bandwidth among different networked applications by controlling their advertised window size. Implementing such a new control algorithm for adjusting the advertised window size does not require any changes to the existing TCP protocol. Furthermore, Eqn. (1) also shows that the sending rate V is inversely proportional to the RTT and we can either employ the TCP Timestamp option [10] or the method proposed in [11] to calculate RTT. In short, with the control rules derived from the User Model, we can adjust the receiver advertised window size and thus prioritize networked applications according to the enduser’s personal preference. We employ the discrete PI (Proportional and Integral) control algorithm to adjust the advertised window size, which can eliminate the residual steady-state error: k W krec = K P ( r − Vk ) + K I ∑ ( r − V j ) RTT j =0
(2)
where the controller output is the advertised window size at the sampling time. r is the target bandwidth which
400
600
800 Time(sec)
1000
1200
1400
1600
60000 QQQTV CuteFTP MSN
50000
40000 Bandwidth(Bits/s)
iii. Only the long-term bulk-transfer networked applications are considered. This is because short-term small-sessions are likely to have completed before they can influence the end-user’s perception.
200
Fig. 7. Resource allocation without User Layer.
i. The last hop link or the access link is the bottleneck of the whole network. ii. The packet loss probability is small and thus we neglect the effect of the slow start and time-out mechanism of TCP.
0
30000
20000
10000
0
0
200
400
600
800 Time(sec)
1000
1200
1400
1600
Fig. 8. Resource allocation with User Layer.
is obtained from the generated User Model and is the sampling time. KP and practical allocated bandwidth at the KI are the tuning parameters in the PI control algorithm. To illustrate the feasibility and effectiveness of the Control sub-system, we implement the whole Control sub-system in the NS-2 simulator [12]. We modify the source code in NS-2 (Version 2.33) to realize the entire TCP flow control mechanism and add the new function module to calculate the bandwidth consumption of each application in real-time. We also implement the proposed PI control algorithm, which is based on the User Model built in the experiment, at the TCP sink side in NS-2. According to the experiment made in sub-section III-A, the simulation topology is depicted in Fig. 6. It consists of three TCP senders which represent the QQQTV server, the CuteFTP server and the Windows MSN server, respectively. We attach the Application/FTP class to the nodes of S0 and S1, which simulates bulk data transfer of QQQTV and CuteFTP.
TABLE1 UPQS VALUE WITH DIFFERENT BANDWIDTH 1 – 20 kbps
20 – 40 kbps
Above 40 kbps
QQQTV
0
1
5
CuteFTP
3
3
4
MSN
5
5
5
We attach Application/Telnet to node S2 to simulate the MSN dynamic behavior, where the inter-packet times are chosen from an exponential distribution with a fixed average interval. We set this parameter to 0.1 in our simulations. Similar to the previous experiment, we limit the access link capacity of each receiver to 56kbps and thus the bottleneck of the whole network exists only at the access links. R1 and R2 are two receivers (end-users), where R1 is running with the proposed User Layer and R2 is a regular one. For the TCP sender S2, the start time of sending the data and the end time of terminating the data stream are selected from a Gaussian distribution, which simulates the QQQTV application being opened and closed randomly by the two end-users. Fig.7 shows the system bandwidth allocation for the three applications without the User Layer. We see that when QQQTV and CuteFTP run simultaneously, they receive an almost equal share of the access link bandwidth. The reason is that QQQTV and CuteFTP have similar RTT and initial advertised window sizes. MSN only consumes a small portion of network resource, which explains why it does not influence the end-user’s perceived QoS much. Fig. 8 illustrates the system bandwidth allocation for the three applications with the proposed User Layer. We see that when the end-user opens QQQTV while CuteFTP is still running, the User Layer automatically decreases the bandwidth consumption of CuteFTP to a proper level based on the given User Model and the control rules. Thus QQQTV can receive the extra bandwidth to guarantee the end-user’s satisfaction. When the end-user closes QQQTV, the User Layer can also detect it and quickly increases the advertised window size of CuteFTP. Then the bandwidth consumption of CuteFTP can return to the initial level, which guarantees that applications always utilize the entire access link capacity. In order to accurately evaluate the end-user’s perception of network performance, we define a simple quality metric called the User Perceived Quality of Service (UPQS). The quality rating is scaled from 1 to 5, which is always used for subjective testing [13]. The five states are: Excellent (5), Good (4), Average (3), Poor (2) and Bad (1), where the corresponding impairment are Imperceptible, Perceptible but not annoying, Slightly annoying, Annoying and Very Annoying. Based on the above quality metric and related subjective assessment work [14][15], we assign the UPQS value to each application in terms of bandwidth consumption as illustrated in Table 1.
Avg. User Perceived Quality of Service(UPQS)
Application
5 With User Layer Without User Layer 4.5
4
3.5
3
2.5
2
0
200
400
600
800 Time(sec)
1000
1200
1400
1600
Fig. 9. Average User Perceived Quality of Service (UPQS).
During NS-2 simulations, we periodically sample the realtime bandwidth consumption of each application. Then we obtain the corresponding UPQS values for each application during the simulation process based on the Table 1. Finally we calculate the arithmetic mean of the total three applications’ UPQS and then get the result of the average User Perceived QoS (UPQS) during the simulation as shown in Fig. 9. Clearly, we can see that the network with the User Layer has much greater average UPQS value than the one without the User Layer. These results confirm our initial claims that the proposed User can improve the user perception of network QoS and achieve our goal of building an intelligent network system. Moreover, the User Layer empowers end-user to control and influence network performance based on his interaction activities and behavior.
IV.
CONCLUSION AND FUTURE WORK
In this paper, we first propose the User Layer framework for building an Ambient Intelligence network. The User Layer consists of the User Interface, User Model Generation subsystem and Control sub-system, and these three sub-systems work together as a coherent entity. Then we build a User Layer application, which illustrates the feasibility and effectiveness of the proposed User Layer architecture. The User Layer application can be implemented entirely at the enduser (client) side and requires no change to any existing layers or network protocols. The simulation results show that the intelligent network system with the User Layer can effectively improve user perceived quality of service (UPQS) and empowers the end-user to enhance network performance according to personal requirements and intentions. The following issues call for our future work. Firstly, through exposing more protocol stack information and parameters to the existing User Layer, we will introduce more functions into the proposed User Layer and expand the scope of the user-centric Ambient Intelligence network design. Secondly, we intend to explore the unsupervised learning approach to further improve on the User Model Generation sub-system, which means the end-user does not need to input
his feelings through the User Interface. Thus the User Model Generation sub-system can infer end-user’s intention and preference without any manual input. Moreover, while we have limited the scope of dynamic adaptation to network resources, the underlying concept of User Layer can be applied generically to a host of other resources.
ACKNOWLEDGMENT This research work is partially supported by the National Research Foundation – Interactive and Digital Media (NRFIDM) project grant NRF2007IDM-IDM002-069 on “Live Spaces: Place Oriented Embodied Media (POEM)”.
[4] [5] [6] [7] [8] [9] [10] [11] [12]
REFERENCES [1] [2] [3]
V. Kawadia and P. R. Kumar, “A Cautionary Perspective on Cross Layer Design,” IEEE Wireless Commun., vol. 12, no. 1, pp. 3-11, 2005. V. Srivastava and M. Motani, “Cross-Layer design: a survey and the road ahead,” IEEE Commun. Mag., vol. 43, no.12, pp.112-119, 2005. F. Risso and L. Degioanni, “An architecture for high performance network analysis,” in Proc. IEEE ISCC, Hammamet, TunisiaJ, 2001.
[13] [14] [15]
J. R. Quinlan, C4.5: Programs for machine learning. San Francisco: Morgan Kaufmann, 1993. I. H. Witten and E. Frank, Data Mining: Practical machine learning tools and techniques (2nd Edition). San Francisco: Morgan Kaufmann, 2005. J. B. Postel, “Transmission Control Protocol,” Information Science Institute, RFC 793, 1981. P. Mehra, C. D. Vleeschouwer and A. Zakhor, “Receiver-Driven Bandwidth sharing for TCP and its Applications to Video Streaming,” IEEE Trans. Multimedia, vol. 7, no.4, pp. 740-752, 2005. P. Mehra, C. D. Vleeschouwer, and A. Zakhor, “Receiver-driven bandwidth sharing for TCP,” in Proc. IEEE INFOCOM , San Francisco, USA, March 2003. J. Padhye, V. Firoiu, D. Towsley, and J. Kurose, “Modeling TCP Reno performance: a simple model and its empirical validation,” IEEE/ACM Trans. Netw., vol. 8, no. 2, pp. 133–145, 2000. V. Jacobson, R.Braden, and D. Borman, “TCP Extensions for High Performance,” Information Sciences Institute, RFC 1323, 1992. Berzosa et al., “Receiver-based RTT Measurement in TCP (Patent style),” U.S. Patent 7330426 B2, Feb. 12, 2008. UCB/LBNL/VINT. The Network Simulator Version 2, ns-2 [online] Available: http://www.isi.edu/nsnam/ns O. Verscheure, P. Frossard, M. Hamdi, “User-Oriented QoS Analysis in MPEG-2 Video Delivery”, Journal of Real-Time Imaging, vol. 5, no. 5, pp. 305-314, 1999. ITU-T Recommendation P.800, “Methods for Subjective Determination of Transmission Quality”, Aug. 1996. G. Ghinea, J. P. Thomas, “QoS Impact on User Perception and Understanding of Multimedia Video Clips”, in Proc. ACM Multimedia, Bristol, UK, 1998.