Dr. Kin Fun Li, (Department of Electrical and Computer Engineering) ...... would be the amount of money in the customer'
Intelligent Online Risk-Based Authentication using Bayesian Network Model by Dao Yu Lai B.Sc., University Of Victoria, 2008 A Thesis Submitted in Partial Fulfillment of the Requirements for the Degree of MASTER OF APPLIED SCIENCE in the Electrical and Computer Engineering
Dao Yu Lai, 2011 University of Victoria All rights reserved. This thesis may not be reproduced in whole or in part, by photocopy or other means, without the permission of the author.
ii
Supervisory Committee
Intelligent Online Risk-Based Authentication using Bayesian Network Model by Dao Yu Lai B.Sc., University of Victoria, 2008
Supervisory Committee Dr. Issa Traore, (Department of Electrical and Computer Engineering) Supervisor
Dr. Kin Fun Li, (Department of Electrical and Computer Engineering) Departmental Member
Dr. Hausi A. Muller, (Department of Computer Science) Outside Member
iii
Abstract Supervisory Committee Dr. Issa Traore, (Department of Electrical and Computer Engineering) Supervisor
Dr. Kin Fun Li, (Department of Electrical and Computer Engineering) Departmental Member
Dr. Hausi A. Muller, (Department of Computer Science) Outside Member
ABSTRACT Risk-based authentication is an increasingly popular component in the security architecture deployed by many organizations in mitigating online identity threat. Riskbased authentication uses contextual and historical information extracted from online communications to build a risk profile for the user that can be used to make accordingly authentication and authorization decisions. Existing risk-based authentication systems rely on basic web communication information such as the source IP address or the velocity of transactions performed by a specific account, or originating from a certain IP address. Such information can easily be spoofed and as such put in question the robustness and reliability of the proposed systems. In this thesis, we propose in this work an online risk-based authentication system which provides more robust user identity information by combining mouse dynamics, keystroke dynamics biometrics, and user site actions in a multimodal framework. We propose a Bayesian network model for analyzing free keystrokes and mouse movements involved in web sessions. Experimental evaluation of our proposed model with 24 participants yields an Equal Error Rate of 6.91%. This is encouraging considering that we are dealing with free text and mouse movements and the fact that many web sessions tend to be short.
iv
Table of Contents Supervisory Committee ...................................................................................................... ii Abstract .............................................................................................................................. iii Table of Contents ............................................................................................................... iv List of Tables ..................................................................................................................... vi List of Figures ................................................................................................................... vii Acknowledgments............................................................................................................ viii Dedication .......................................................................................................................... ix Chapter 1 Introduction ..................................................................................................... 1 1.1 Context ................................................................................................................ 1 1.2 Problem Statement .............................................................................................. 3 1.3 Proposed Approach ............................................................................................. 5 1.4 Summary of Contributions .................................................................................. 8 1.5 Thesis Outline ..................................................................................................... 9 Chapter 2 Related Work ................................................................................................ 10 2.1 Risk Analysis .................................................................................................... 10 2.2 Risk-Based Authentication ............................................................................... 15 2.3 Keystroke Dynamics ......................................................................................... 18 2.4 Mouse Dynamics .............................................................................................. 22 2.5 Discussions ....................................................................................................... 28 Chapter 3 Background on Bayesian Network Model .................................................... 30 3.1 Background on Bayesian Theories ................................................................... 30 3.2 Bayesian Network Learning ............................................................................. 33 3.2.1 Parameter Learning ....................................................................................... 34 3.2.2 Structure Learning ........................................................................................ 37 3.3 Summary ........................................................................................................... 39 Chapter 4 Risk-Based Authentication Model ................................................................ 40 4.1 General Approach ............................................................................................. 40 4.2 Types of Data .................................................................................................... 41 4.2.1 Keystroke Dynamics ..................................................................................... 41 4.2.2 Mouse Dynamics .......................................................................................... 45 4.2.3 User Site Action ............................................................................................ 47 4.3 Data Analysis .................................................................................................... 48 4.3.1 Feature Extraction ......................................................................................... 49 4.3.2 Noise Reduction ............................................................................................ 49 4.3.3 Data Discretization........................................................................................ 53 4.3.4 Bayesian Network Classifier......................................................................... 54 4.3.5 Fusion Method .............................................................................................. 56 4.4 Summary ........................................................................................................... 57 Chapter 5 Experimental Evaluation ............................................................................... 58 5.1 Description of the Website................................................................................ 58 5.2 Instructions for Users ........................................................................................ 60 5.2.1 Logging In as Genuine User ......................................................................... 60
v 5.2.2 Logging In as Intruder .................................................................................. 61 5.3 Experiment Set Up ............................................................................................ 61 5.4 Collected Data ................................................................................................... 61 5.5 Evaluation Method ............................................................................................ 64 5.6 User Enrolment ................................................................................................. 66 5.6.1 Training Strategy .......................................................................................... 67 5.6.2 Keystroke Dynamics Profile ......................................................................... 67 5.6.3 Mouse Dynamics Profile............................................................................... 70 5.6.4 User Site Actions Profile .............................................................................. 74 5.7 Testing Results .................................................................................................. 75 5.7.1 Individual Results ......................................................................................... 76 5.7.2 Mouse and Keystroke Fusion........................................................................ 79 5.7.3 Combining All Three Modalities .................................................................. 80 5.7.4 Discussions ................................................................................................... 82 5.8 Summary ........................................................................................................... 83 Chapter 6 Conclusion .................................................................................................... 84 6.1 Summary ........................................................................................................... 84 6.2 Future Work ...................................................................................................... 85 Bibliography ..................................................................................................................... 86
vi
List of Tables Table 4.1. Upper Case Keystroke characters .................................................................... 43 Table 4.2. Keystroke dynamics biometric features ........................................................... 44 Table 4.3. Mouse dynamics biometric features ................................................................ 47 Table 4.4. User site actions ............................................................................................... 48 Table 4.5. User site action factors ..................................................................................... 48 Table 5.1. Numbers of collected samples ......................................................................... 62 Table 5.2. Bayesian network training records and validation results for legal users........ 66 Table 5.3. Examples of keystroke records for two different users: User 2 and User 7 .... 69 Table 5.4. Examples of mouse dynamics records for two different users: User 2 and User 7......................................................................................................................................... 73 Table 5.5. Examples of site action records for two different users: User 2 and User 7.... 75 Table 5.6. FRR/FAR results for keystroke dynamics while varying the threshold .......... 76 Table 5.7. FRR/FAR results for mouse dynamics while varying the threshold ............... 76 Table 5.8. FRR/FAR results for user site action while varying the threshold .................. 76 Table 5.9. FRR/FAR results by combining keystroke dynamics and mouse dynamics ... 79 Table 5.10. Average margin of errors for combining keystroke dynamics and mouse dynamics at threshold 5.95% ............................................................................................ 80 Table 5.11. FRR/FAR obtained by combining all three modalities ................................. 81 Table 5.12. Average margin of errors for combining all three modalities at threshold 0.28% ................................................................................................................................ 81
vii
List of Figures Figure 1.1. Enrolment phase ............................................................................................... 8 Figure 1.2. Verification phase ............................................................................................. 8 Figure 2.1. The GUI for the Mouse-lock system [4] ........................................................ 24 Figure 2.2. The GUI for the mouse maze [22] .................................................................. 26 Figure 2.3. The GUI for the mouse dynamics authentication system proposed by Aksari and Artuner [24] ................................................................................................................ 27 Figure 3.1. A is the parent of B in a directed acyclic graph ............................................. 30 Figure 3.2. An example Bayesian network for detecting heart disease and heartburn ..... 31 Figure 3.3. An augmented Bayesian network considering relative frequencies of variable X........................................................................................................................................ 34 Figure 4.1. Identity verification process ........................................................................... 41 Figure 4.2. Flight time variations ...................................................................................... 42 Figure 4.3. Mouse movement angles and directions......................................................... 46 Figure 4.4. Noise reduction on keystroke flight time (down-down) feature .................... 50 Figure 4.5. Noise reduction on mouse dynamics data ...................................................... 52 Figure 4.6. A trained Bayesian network example ............................................................. 55 Figure 5.1. Experimental website log on page .................................................................. 58 Figure 5.2. Numbers of samples contributed by test users ............................................... 63 Figure 5.3. Keystroke Bayesian networks for two different users: User 2 and User 7 ..... 68 Figure 5.4. Mouse Bayesian networks for two different users: User 2 and User 7 .......... 72 Figure 5.5. User site action Bayesian networks for two different users: User 2 and User 7 ........................................................................................................................................... 74 Figure 5.6. ROC curves for each of the three types of data .............................................. 77 Figure 5.7. ROC curve for keystroke dynamics and mouse dynamics fusion .................. 79 Figure 5.8. ROC curve obtained by combining all three modalities ................................ 81
viii
Acknowledgments I would like to thank my supervisor Dr. Issa Traore for his support throughout the formation of this thesis. His kind advice and guidance helped me greatly in establishing my research skills. I would like to thank many people who participated in my experiment, in particular my friends, my colleagues, and my supervisor. I would also like to thank the staff and faculty of the department of Electrical and Computer Engineering for their efforts and assistance. I deeply appreciate everyone who supported me with my thesis. Lastly, I am most grateful to my parents who raised me and love me. To whom, I dedicate this thesis.
ix
Dedication
To my loving parents, who raised me and always love me.
Chapter 1
1.1
Introduction
Context
Online systems are increasingly facing a wide variety of threats. Commonly known threats include phishing attack, DNS attack, denial of services attack, masquerade attack, and so on. For example, attackers attack web servers and break into server machines, they attack network connections between servers and client computers, or they attack the client computers and disclose client’s credential information. One of the attacks most difficult to detect is the masquerade attack, in which attackers use legitimate users’ credential information to log on to systems and pretend they are the legitimate users. The traditional authentication method based on combining user name and password offers a fertile ground for masquerade attacks, because they are based on piece of knowledge which can be shared or can be found using hacking tools such as password cracker. More and more online systems are carrying valuable information from privacy or monetary perspective for the various stakeholders involved (e.g., customers, managers). Examples of such systems include online paid subscriptions sites, web mails, web banks, social network websites, instant message systems, online biding systems, online stores, public libraries, and online tax systems. For these kinds of systems, traditional authentication schemes based solely on user name / password combination are not strong enough. Alternative schemes replacing or reinforcing the above schemes are needed.
2 There are several types of authentication mechanisms, each of them using different information from users to verify users’ identities including the following [1]:
What the entity knows What the entity has What the entity is Where the entity is
There are advantages and disadvantages with each of the above authentication schemes. User name and password fall under the category of what the user knows. An example of what the user has is a dongle token. In this case, in order to use a software application, the user will need a dongle to be authenticated every time he/she accesses the software. The disadvantage is that the dongle can be stolen or reused by other people. Biometric is a prime example of what the user is. With most biometric technologies (e.g., fingerprint), a special purpose hardware device is needed in the authentication process. This is inconvenient and costly for applications such as online systems. A combination of several of the above schemes into what is called multifactor authentication is considered as a stronger alternative. Risk-based authentication (RBA) is an emerging form of multifactor authentication which adapts the level, type and strength of the authentication scheme to the risk associated with the individual being authenticated. In this work, we propose a three factor authentication mechanism, which involves keystroke dynamics, mouse dynamics, and user site action behavioural patterns. Two main reasons of choosing these three factors are as follows:
these three user behavioural data can be collected unobtrusively through data interception programs embedded in web applications these three user behavioural patterns have limited impact on each others’ performance. For instance, a user’s keystroke behavioural pattern is less likely
3 changed when his/her mouse behavioural patterns changed. Similarly, the user’s web behaviours are less likely changed when either or both keystroke behavioural patterns and mouse behavioural patterns change. According to the definition for commercial systems, risk-based authentication is a security mechanism that uses both contextual and historical user information, along with data provided during Internet communications to determine the probability of whether a user interaction is genuine [37]. The implementation of a risk-based authentication system consists of first assigning a risk score to each user profile and then deciding the appropriate level, form, or combination of authentication credentials needed. Risk assessment uses contextual and historical user profile information. The historical user data is based on user behaviour patterns. Risk-based authentication is a multifactor authentication mechanism, in which the user name and password is the first authentication factor, other historical and contextual data are the secondary authentication factors. 1.2
Problem Statement
We develop in this work an intelligent risk-based authentication system which combines basic historical web information with behavioural biometrics such as keystroke dynamics and mouse dynamics. Keystroke dynamics biometric extracts unique user behavioural patterns based on how a user types on a keyboard. Mouse dynamics biometric is another type of unique behavioural characteristics based on a user’s mouse actions which consist of mouse movements and mouse clicks. To the best of our knowledge, most of the existing RBA systems are based only on basic contextual and historical web information. The foundation of these systems is
4 flawed because most of the contextual and historical web information used is subject to attacks such as spoofing. In contrast, mouse dynamics and keystroke dynamics provide reliable user identity information which can be used as robust alternative data sources. Although keystroke dynamics biometric has been studied extensively and used for authentication since the early 1980’s, most of the existing proposals have focused primarily on fixed text recognition [6]. Fixed text recognition consists of enrolling the user using a predefined text or phrase, and performing the detection by asking the user to type exactly the same string. While fixed text recognition maybe used in static authentication (i.e., login), it is not appropriate in risk-based authentication, where the user must be authenticated in a non-intrusive way throughout a computing session. Under such a scenario, the user must be authenticated based on text freely typed, which does not necessarily match the enrolment sample. This is referred to as free text detection [46]. Free text detection in web environments is very challenging because of the limited amount of keystrokes involved in many web sessions (i.e., online banking.) Similar challenges are involved in mouse dynamics biometric analysis. Most of the existing mouse dynamics analysis systems target primarily static authentication. However, mouse dynamics can conveniently be applied for risk-based authentication, because the data capture can be done unobtrusively using a standard mouse device readily available in many computing environments [3]. However, the small amount of mouse actions generated in many web sessions, may limit the performance of risk-based authentication in web environments severely. In this work, we tackle the above challenges by developing an online risk-based authentication scheme using Bayesian network model that integrates mouse dynamics
5 and free text analysis, along with the characteristics of user site actions while addressing the underlying performance issues. While risk-based authentication has generated a lot of buzz in industry, we are not aware of any rigorous study on the performance of the many products currently available on the market. Furthermore, limited information is available on the specific model and approaches underlying these products. The performance of the proposed scheme is computed using the following standard biometric performance metrics:
False Acceptance Rate (FAR): measures the likelihood that an impostor may be falsely accepted by the system as genuine; False Rejection Rate (FRR): measures the likelihood that a genuine user may be rejected by the system as an impostor; Equal Error Rate (ERR): corresponds to the operating point where FAR and FRR have the same value.
We conduct an experimental evaluation of our proposed system by embedding it in a prototype social networking site designed for this purpose and involving 24 participants. The obtained performance is encouraging and indicates overall an equal error rate (EER) of 6.91%. 1.3
Proposed Approach
From a security perspective, risk is evaluated by determining how an attacker compromises the system and the effort required to conduct the attack. Risk can be evaluated quantitatively or qualitatively. Quantitative risk assessment is to represent risk in numerical scores by using mathematical and statistical methods. Qualitative risk
6 assessment is to represent risk in the form of descriptive categories or levels, such as high, medium, or low. In this work, we use a quantitative method to assess risk. The quantified risk value will be evaluated as follows: Risk = (probability of successful masquerade attack)
(value of loss)
Since there is only one main threat for web access control systems – the masquerade attack, the negative event will be masquerade attack. About the value of loss, an example would be the amount of money in the customer’s account in online banking systems. Our goal in this work is to assess the probability of a successful masquerade attack rigorously by collecting and analyzing basic web user session data as well as corresponding mouse and keystroke dynamics data. Initially, sample data is collected to build a reference profile for legal users during the enrolment process. Later when a user accesses the site by claiming a specific identity, the reference profile corresponding to the claimed identity will be compared against monitored data from ongoing session. The outcome of the comparison will provide a measure of the likeness of the reference and monitored profiles, which in our case is a probability score. Various statistical learning techniques may be used to build and process the user profiles. We use Bayesian Networks (BN) [42] for this purpose. Our proposed risk-based authentication process is triggered as soon as the user accesses the website. For example, when a user opens the web page, the mouse movement information, such as the position of the cursor on the web browser and the mouse move time are detected by the client side program and stored in local machine’s cache. Once
7 the user logs in, for example, by submitting the Log In request, and the system grants the access to the user, the collected data will be sent to the server to verify the user’s identity. The authentication mechanism will keep running throughout the whole session while the user is staying on the web site. For example, the system will continuously collect user’s keystrokes and mouse actions data while user is visiting the web pages. At the same time, the system will perform the verifications repeatedly or wait until the end of the session to compute a global risk score. In case of malicious activity, in the first scenario an immediate response can be generated during the session, while in the second scenario, the response may consist of rolling back the transaction outcome (if possible). Following standard biometric authentication process, our approach has two phases: enrolment phase and verification phase illustrated in Figures 1.1 and 1.2, respectively. In the enrolment phase, raw data, such as keystrokes and mouse actions are intercepted. The user’s Bayesian network biometric profile is built on the extracted biometric features and then stored. In the verification phase, the stored user profile is retrieved and then used as the reference profile. The server retrieves the reference profile from the database and verifies the current user’s claimed identity based on the monitored data. In the verification phase, user’s raw data is processed in the same way as in the enrolment phase. The processed samples are applied to the Bayesian Network profile corresponding to the claimed identity, yielding a similarity ratio or biometric score. In the decision making process, the similarity ratio is compared to a threshold to decide whether the user is genuine or an impostor.
8 Legends Software Models Web Page Database Data Interception Program
Raw Data Server Feature Extraction
Noise Reduction and Data Discretization
Bayesian Network Training
Reference Profiles
Figure 1.1. Enrolment phase
Web Page Data Interception Program Raw Data Server Feature Extraction
Noise Reduction and Data Discretization Verification Reference Profiles
Figure 1.2. Verification phase
1.4
Summary of Contributions
The main contribution of this work is the development of a risk-based authentication framework that integrates biometrics, such as keystroke dynamics and mouse dynamics, and the user behaviour factor – user site actions. The proposed authentication scheme is a dynamic RBA system in which security risk is evaluated for active web sessions.
9 Another contribution of the thesis is the development of a Bayesian network model for analyzing short free-style keystroke dynamics and mouse dynamics sessions without impacting while achieving performance results. By using free-style biometrics, the proposed RBA scheme has no restrictions regarding specific hardware devices or software environments. Due to the high EER at 6.91% in the performance evaluation, the proposed system is more appropriate to be used in detecting high risk user behaviours in a free web environment. 1.5
Thesis Outline
The rest of the thesis is organized as follows: Chapter 2 summarizes and discusses related work on risk-based authentication as well as mouse dynamics and keystroke dynamics biometrics technologies. Chapter 3 provides background knowledge on Bayesian theories as well as common approaches of using Bayesian networks in machine learning, which include parameter learning approaches and structure learning approaches. Chapter 4 describes the proposed risk based authentication system by focusing on the types of data involved. This chapter discusses in detail how features are extracted for each type of data and the data analysis processes including noise reduction and discretization. Chapter 5 presents the experimental evaluation and results. This chapter describes the details of the experimental website, the test instructions, and the evaluation results. Chapter 6 summarizes our work and discusses future work.
10
Chapter 2
Related Work
In this chapter, we discuss related work on risk analysis, risk based authentication, keystroke dynamics, and mouse dynamics. 2.1
Risk Analysis
Wawrzyniak proposed a security risk assessment model based on three different methods namely Annual Loss Expected (ALE), Return on Investment for a security investment (ROSI), and Information Security Risk Analysis (ISRAM) methods [15]. In the proposed model, four main elements are quantitatively represented, which include security threats, business impact, security measures and costs. Three matrices are used to represent relationships among the above four elements. The authors further analyze the matrices at different levels, characterized as Basic analysis level and Complex analysis level. For example, at the Basic analysis level, the matrixes values are compared with the historical data. The Complex analysis level consists of a series of steps to compute risk values, security measures effectiveness, with considering business impact and costs to form the basis of risk management process. Rot presented a study on quantitative and qualitative approaches for IT risk assessment [16]. The quantitative methods considered include Annual Loss Expected (ALE) method, Courtney method, Fisher’s method, and ISRAM Method. The qualitative methods involved Failure Mode and Effects Analysis (FMEA) and Failure Mode and Effects Criticality Analysis (FMECA), NIST SP 800-30 method and CCTA’s Risk Analysis and Management Methodology (CRAMM).
11 Kim et al. proposed an integrated quantitative security risk analysis model for information systems [26]. The proposed risk analysis model consists of analyzing risk based on three major elements that are assets, threats, vulnerabilities. The calculation of risk values follows the identification and evaluation process of the above three elements. In addition, the proposed model includes risk mitigation process that provides risk minimizing solutions for decision makers, as well as a damage estimation process. The authors implemented a risk analysis program as an illustration. Hussain et al. proposed a risk based decision making system using fuzzy logic in a peer-to-peer financial interaction environment [27]. In such environment, a trusting agent evaluates the risks in an interaction in order to determine whether to interact with the probable trusted agent or choose an agent. The risk evaluation involves evaluating the pre-interaction and post-interaction possibilities of failure and the consequences of failure which is financial loss. The fuzzy logic system is used in making a decision which evaluates the possibility of failure and the consequences of failure based on a set of predefined rules. The fuzzy method used is called the Root-Sum-Square (RSS) method, and the output of the decision making system is labelled as “Proceed” or “Don’t Proceed”. Wang et al. proposed a fuzzy risk assessment model to evaluate risk of web services [28]. The proposed model involves a ranking scheme that the set of alternatives are assigned individual ratings based on a set of criteria. The decision makers evaluate the preference relations between alternatives according to their ratings. The proposed model extends the Pseudo-Order Preference Model (POPM) [23] that two new models are proposed to improve the preference model by considering relative importance, namely Semi-Order Preference Model (SOPM) and Complete-Preorder Preference Model
12 (CPPM). Resolution Method for Group Decision Problems (RMGDP) [29] is also used in the proposed model to obtain group preferences. A case study was conducted in risk analysis of web services as an illustration that the model can be used when security information is imprecise and incomplete. Jin et al. proposed a risk-sensitive intrusion detection model [30]. The proposed system contains two built-in profile databases: NSCS (normal system calls sequences) database is used for misuse detection, and ISCS (intrusion system calls sequences) database is used for anomaly detection. Risk values are computed for each system calls sequence, and later the conditional risk values are calculated by using the Bayesian theorem. The optimal decision is the one with lowest conditional risk value among decisions under different state of nature. The authors also extended the above model using similarity measures that measures the difference between observed system calls sequences and predefined profile sequences. An experiment was conducted using the process Sendmail with root privilege and detection rates with different sequences length and different cost ratio are studied. Aime et al. proposed a risk analysis model in which security measures are automatically chosen [31]. General risk analysis steps include perimeter definition, asset identification and characterization, threat identification, vulnerability identification, risk evaluation, countermeasure definition and application, and risk analysis approval. An automated risk analysis process was proposed that included threat classifier, patterns constructor, patterns locator, threat scorer, and risk evaluator. In the approach, two types of data sources were used as inputs which are vulnerability database and best practices definitions. Security metrics and metrics extraction process were also investigated.
13 Dimitrakos et al. presented an overview of the European project CORAS which is a model-based risk assessment system specialized used in e-business and e-government systems [33]. The CORAS risk assessment methodology is integrated in an iterative and incremental software development process. The risk assessment in iteration consists of a combination of existing risk assessment methods among HAZard and OPerability study (HAZOP), Fault Tree Analysis (FTA), Failure Mode and Effect Criticality Analysis (FMECA), Markov analysis methods, and CCTA Risk Analysis and Management Methodology (CRAMM). The CORAS framework also covers other concerns such as risk analysis propagations and messages passing between risk assessment and the system development. A case study conducted on e-commerce trails shown an improvement in risk analysis. Jin and Cheng discussed the risks involved in online banking system and corresponding risk management approaches [34]. In the discussion, online banking risks were grouped into four categories: strategic risk, operation / security risk, legal risk, reputation risk, and credit risk. In the point of views of authors, risk management has a life cycle that involves planning, risk identification, risk analysis, and risk monitoring. An overview of different strategies to manage risks was presented from different aspects, which included customer protection, human resource management, technology methods, and regulatory developments. Mo et al. proposed a quantitative security risk assessment model using hierarchical Bayesian Network [35]. In the proposed Bayesian network, risk scores were calculated as the highest level score based on the lower level nodes which were composed of vulnerabilities variables and threats arcs. The built Bayesian network was represented as
14 the firm’s risk profile, and the risk score was represented as the readiness of the firm in the market. Arnes et al. proposed a real time risk assessment system based on hidden Markov models [36]. The proposed system consists of an upper level module built on top of network monitoring and intrusion detection systems. The target network is a generic network that is monitored by intrusion detection sensors. The sensors gather information about the objects’ security states. Different sensors have different weights assigned to indicate their trustworthiness. Agents receive data from the sensors and perform a real time risk assessment. The risk assessment model is built by using a discrete-time Markov chains model, in which the observed data are represented as a series of data with discrete time intervals. The risk is measured by using parameters consequences and likelihood. During the measure, the cost for each monitored object is calculated. In order to measure the risk in real time, the object’s security state probability needs to be updated dynamically. Brændeland and Stølen discussed about how to use an asset-oriented risk analysis approach to analyze user trust [39]. The e-commerce trust model and the factors that affect trust and trustworthiness are discussed in details. It is claimed that user trust is an asset to the banks. Therefore, CORAS risk analysis model was used to identify factors that can affect trust, such as threats, vulnerabilities and unwanted incidents. The risk analysis is a five step process, which includes establishing the context, identifying risk, analysing risk, evaluating risk, and treating risks.
15 2.2
Risk-Based Authentication
Some risk-based authentication schemes were discussed in related work as a module in access control system. This is because the purpose of an authentication system is to grant access rights to users based on users’ identities. The following discusses related approaches in risk based authorisation systems or risk based access control systems. Tuptuk and Lupu proposed a risk based authorisation model for mobile ad hoc networks (MANETs) [19]. The proposed system makes authorisation decisions based on authentication trust and reliability trust. The parameters of the authorisation system include authentication tokens, the environment, and the behaviour history. Permission would be granted if the trust is higher than the risk threshold. The risk in this approach is defined as “the possible loss due to security violations caused by misbehaving nodes”, and the risk threshold is dynamically determined depending on the given context. The model of authentication trust was Bayesian Belief Networks (BBN), while the models for reliability trust were Bayesian models. Diep et al. proposed a contextual risk-based access control system [20], in which the risk values are computed using a quantitative multifactor evaluation process (MFEP). The final risk value was a weighted mean of three security risk factors namely availability, confidentiality, and integrity. The authors conducted a case study on managing access of patient’s records in a hospital to illustrate the proposed approach. Teo et al. proposed a dynamic risk-aware network access control system which is called Authorization Enforcement Facility (AEF) [17], which monitors network connections between a packet-filtering firewall and the internal network. AEF grants or
16 1
denies the sources passing through the firewall by assessing the associated risks. The risk is dynamically measured as threat level. The AEF initially loads static and dynamic policies. The associated threat level will be increased if suspicious actions defined in policy file are detected, or the threat level will be decreased if good connections have been occurring for a while. Once the threat level increases over the pre-set threshold, the access will be denied. Cheng et al. proposed an adaptive risk-based access control model [18] called Fuzzy Multi-Level Security (MLS) access control model. The Fuzzy MLS model applies fuzzy logic in measuring the probabilities that were described in the Bell-LaPadula model [57]. It quantifies risks not only into binary values, but also it adds a temptation index to measure the probability of attempted leaking sensitive of information. Ma et al. proposed an approach called Role Based Access Control Model with Risk (RBACR) [40]. The proposed approach is concerned with the risk of assigning a role or delegating a role to a user. Risk analysis functions were developed for role assignments and delegations respectively. Further results were presented in [40] where logical inference rules were used to implement the risk assessment in RBACR system. Ahmed and Zhang proposed a Context-Risk-Aware Access Control (CRAAC) model for Ubiquitous Computing (UbiComp) environments [49]. CRAAC was built on RoleBased Access Control (RBAC) system that it aimed to overcome the disadvantages such as the traditional access control system was based on static context and could not adjust itself to make decision in dynamic contexts environments. In the CRAAC approach, an object of resources/services was assessed based on its risk values and was associated to
1
A source refers to a generic input, such as a packet, a connection, or a stream.
17 an Object Level of Assurance (OLoA). For every request, the Requester’s Level of Assurance (RLoA) was evaluated based on its real-time contextual information. The access was granted if and only if RLoA exceeds OLoA. The contextual attributes involved in the risk assessment included authentication token types (eToken), the access locations (ALoc), the channel security (CS), and the ability to respond to intrusion attacks (IR). The authors conducted a case study of applying CRAAC model on a real-life context-aware authorisation for a Smart Hospital. Clark et al. proposed a risk based access control system [51]. The authors proposed a risk assessment model that involved uncertainty in time-varied security labels and reliability of individuals. The model was based on the Fuzzy MLS model discussed in [18]. Instead of using the temptation index in [18], the new system applied time-variant sensitivity template in calculating the new temptation index. Therefore, the risk value was adapted using the new temptation index. The same template was also applied on individual clearances. The authors also discussed the time-varying contextual risk in the approach. Krautsevich et al. proposed risk-based approach for Usage Control (UCON) used in service oriented architecture (SOA) [52]. In the service oriented architecture, the data providers provide data for data consumers. A data provider computed quantified risk value based on the ranks of policy statements and compared risk levels of risk consumers. The data provider chose the data consumer which had the lowest risk values. During the data usage by the data consumer, the risk levels were re-evaluated by data provider.
18 2.3
Keystroke Dynamics
Keystroke dynamics biometric is a type of behavioural biometrics that represents the way users type on computer keyboards. Keystroke dynamics biometric is widely studied in user identification and verification [6, 7, 8, 9, 10, 12, 13, 14]. Authentication based on keystroke dynamics is appealing, because it does not require additional hardware. But there are some limitations. The first limitation is keystroke dynamics usually has high false acceptance rate and false rejection rate. This affects the accuracy of authentications. The second limitation is that the system usually needs to collect a large number of keystrokes in order to generate a good signature. The third limitation is that some approaches become ineffective if the number of users increase. Recent research has been focusing on improving the accuracy of the system. The authentication scheme proposed by Bergadano et al. is based on the array degree of disorder distance metric [6]. Experimental evaluation of the approach with 154 users achieved an average False Alarm Rate (FAR) at 4% and Impostor Pass Rate (IPR) lower than 0.01%. Hu and Gingrich proposed a similar approach but used k-nearest neighbour classification algorithm [14]. The user’s individual profile was built based on the distance measures of n-graphs vectors, and associated with a cluster. The user would be authenticated if the test sample is classified correctly. Experimental evaluation with 19 users yielded a performance of False Rejection Rate at 0% and False Acceptance Rate at 4.5%. Araújo and colleagues proposed another approach based on keystroke latency features including keystroke down-down, down-up, and up-down time features [9]. The approach was based on statistical measures such as means, standard deviations, and
19 distance used to classify users. The approach’s best performance is a False Rejection Rate (FRR) of 1.45% and a False Acceptance Rate (FAR) of 1.89% with 30 users. In some studies, keystroke dynamics biometric authentication schemes were based on different clustering techniques and classification methods. Mandujano and Soto proposed a fuzzy clustering technique for user authentication [7], especially using the c-Means algorithm to build clusters and compute the cluster centroids based on keystroke latencies. Evaluation of the approach with 15 test users gave a success rate between 89% and 98% and a failure rate of detecting imposters between 4% and 32%. Lee et al. proposed to represent a user’s keystroke timing vector’s p-norm distances in Ellipsoidal Hypothesis space based on the extended p-norm definitions [12]. The extended p-norm was defined by adding scaling parameters to the p-norm. Each user’s profile was built and classified in the hypothesis space. The authors used techniques such as eliminating outliers and adaptation mechanism to improve the performance. The evaluation experiments were conducted with 16 participants as legitimate users and imposters. After applying adaptation, the authors obtained the average FRR and FAR at 4.33% and 4.36%, respectively. Jiang and colleagues proposed a web based keystroke dynamics authentication scheme using Hidden Markov Model (HMM) and Gaussian Model [13]. The authors assumed that the distribution of keystroke n-graph timing duration fits a Gaussian distribution model. The approach involves using a modified Forward Algorithm to calculate the probabilities of how well a sequence of keystrokes fits the pre-trained HMM. The parameters include the statistical measures of n-graph timing duration such as means and standard deviations. In the verification, a probability threshold is used to decide whether
20 the user was valid or not. In the experiments, 58 users provided 870 test samples, while 257 other anonymous users provided 3528 imposter test samples. The best Equal Error Rate (ERR) obtained was 2.54%. Hocquet et al. used three different methods to analyze keystroke striking times and then applied a fusion on these three methods [8]. The first method is a statistical approach based on the average time and standard deviations. The authors made some adjustments such as adding weights and using the last ten valid logins to update the profile. The second method consists of extracting rhythm2 feature from key striking and using this as a measurement to distinguish different users. The third method involves classifying ranks of times also called measure of disorder in [6]. A fusion method on the outcomes of the three methods is conducted and used for decision making. Experimental evaluation based on 15 users yielded the best Equal Error Rate (EER) at 1.8%. Hwang and colleagues studied the hypothesis that inserting artificial rhythms such as pauses and cues in typing could improve the performance of keystroke dynamics based authentications, especially when users were not familiar with the passwords [10]. The authors compared performances by classifying keystroke timing vectors using five authenticators, namely Gaussian classifier, Parzen window density estimators, k-nearest neighbour classifier, k-means clustering, and one-class support vector machine. The experimental evaluation involved 25 test users. Data was collected under 4 different scenarios: users typed in familiar passwords; users typed in unfamiliar passwords; users inserted pauses in unfamiliar passwords; and users inserted pauses and cues in unfamiliar
2
The rhythm refers to musical rhythm which is a time movement element in music.
21 passwords. The authors claimed that using pause and cues improve the system performance with the best Equal Error Rate (EER) close to 0%. Chang proposed an approach that uses resampling techniques to produce more keystrokes in authentication [11]. The approach expands keystroke timing vector (KTV) in time domain and wavelet domain, and uses hierarchical tree-based classification. An existing dataset was used to evaluate the proposed approach. The dataset consisted of data provided by 12 users, providing between 150 and 400 enrolment samples and 75 test samples, and 15 imposters providing 5 samples for each password. The author compared the AFR (average false rate which is average FAR and FRR) before and after using the artificial samples and found out that the AFR decreased for all passwords. The studies discussed above were based on fixed text keystroke dynamics, in which, users type in known texts during the authentication. The following discussions are based on free text keystroke dynamics approaches, in which users type in non-predefined sample texts. Gunetti and Picardi conducted a study on free text keystroke dynamics using “R” measures and “A” measures on n-graph features [46]. The idea was to measure distances of similar texts and combine different measurements to achieve a better performance. Evaluation based on 205 test users yielded a False Alarm Rate less than 5% and an Impostor Pass Rate of less than 0.005%. Dowland and Furnell proposed to use digraph, trigraph, and keyword keystroke latencies in user identity verifications [43]. The method calculates statistical values such as means and standard deviations for digraph, trigraph, and words respectively. In the approach, filters are applied on the data such as removing outliers when standard deviation value is greater than the mean value. The experimental data was collected from 35 test users in a three months period. The
22 experimental result achieved the best performance at a False Acceptance Rate at 4.9% and a False Rejection Rate at 0%. 2.4
Mouse Dynamics
Mouse dynamics is a recently developed behavioural biometric. Different mouse action definitions were proposed according to related studies. Some studies investigate mouse actions including Mouse-Move (MM), Drag-and-Drop (DD), and Point-and-Click (PC) as suggested in [3]. Other studies investigate different set of mouse events such as mouse wheel movements, single clicks, double clicks, and nonclient area3 mouse movements as shown in [21]. Different mouse dynamic features are proposed in related studies. Ahmed and Traore proposed to use 39 features grouped as seven factors which include Movement Speed compared to traveled Distance (MSD), Average Movement speed per movement Direction (MDA), Movement Direction Histogram (MDH), Average movement speed per Types of Actions (ATA), Action Type Histogram (ATH), Traveled Distance Histogram (TDH), and Movement elapsed Time Histogram (MTH). Raj and Santhosh divided mouse dynamics features into seven categories, which include Movement speed compared to traveled distance (MSD), Direction of movement (DOM), Direction of movement Occurrence (DOM Occur), Types of actions (TOA), Types of actions Occurrence (TOA Occur), Movement elapsed time (MET), and Movement elapsed time (MET Occur) [2]. Examples of other mouse dynamics features include the time between selecting images and the duration of selecting all images in the work of Revett,
3
The nonclient area refers to the areas of menus and toolbars.
23 Jahankhani, and Magalhães [4]. Pusara and Brodley proposed to use mouse dynamics features such as means, standard deviations, and third moment values of mouse movement distance, angle, and speed [21]. Shen et al. proposed two categories of mouse dynamic features: schematic features and motor-skill features. Schematic features include mouse action histogram, percentage of silence periods, distribution of cursor positions on the screen, and distribution of movement distances/directions. Motor-skill features include elapsed time of single click, elapsed times of double click, average movement speed compared to directions, average movement speed and acceleration compared to traveled distance, and transition time of actions [5]. Aksarı and Artuner suggested using similar features such as speed, deviation, angle, and acceleration and their statistical measures such as average, standard deviation, maximum, and minimum [24]. The following discussion compares different approaches and their performance evaluations. Ahmed and Traore proposed a mouse dynamics biometric recognition approach in which, mouse dynamics features were analyzed using neural networks [3]. A neural network was built during the enrolment procedure for each user and used in the verification process. 22 test users participated in the experiment and provided 998 sessions of test data. An overall FAR of 2.4649% and FRR of 2.4614% were obtained in the first experiment, in which tests were conducted on various hardware and software systems. 7 test users participated in a second experiment providing 49 sessions. In this experiment, the same hardware and software applications were used. The test results consisted of FAR and FRR at 1.25% and 6.25%, respectively. A third experiment was limited to the same machine and while the previous 7 participants were asked to use the
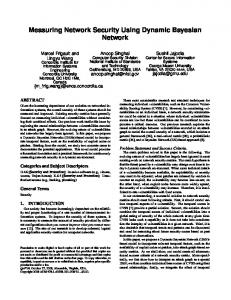
24 same application. The FAR and FRR at 2.245% and 0.898%, respectively, were obtained in this experiment. Raj and Santhosh claimed that behaviour standardization process improved mouse dynamics signature identification for varied screen resolutions [2]. The authors proposed a solution of combining keystroke dynamics and mouse dynamics. The user profile was built using neural networks. Revett et al. proposed a mouse dynamics authentication system called Mouse-lock that uses a series of images displayed in circle as shown in Figure 2.1 [4]. A password in Mouse-lock consists of 5 images; entering a password involves dragging the images to the top dial position.
Figure 2.1. The GUI for the Mouse-lock system [4]
Timing features were measured and analyzed in the approach. The experiments involved six students providing each 100 normal log-ins samples and 20 attacks samples. The performance evaluations yielded FAR and FRR between 2% to 5%.
25 Shen et al. investigated mouse dynamics variability [5]. The authors studied mouse dynamics feature variations and proposed to use dimensionality reduction techniques such as PCA and manifold learning (ISOMAP) to reduce noise, while neural network was used as classification method. The experimental evaluation involved 10 users providing data over a period of 2 months. The original FAR and FRR were 10.36% and 7.18%. The performance improved when using PCA with FAR at 1.48% and FRR at 5.33%, while with ISOMAP in manifold learning the FAR was 0.55% and FRR was 3.00%. Pusara and Brodley proposed a user re-authentication system based on mouse dynamics [21]. Mouse dynamics features consisting of the mean, standard deviations, and third moment values were calculated for a number of mouse points. Decision tree technique was used for classification. Experimental data was collected from 18 test users during an average two hours period. Users were restricted to use the Internet Explorer on a Windows operating system. Data from 7 users was considered invalid due to low entries. The test results showed a false positive rate at 0.43% and a false negative rate at 1.75%. Bours and Fullu proposed a login system using mouse dynamics [22]. The proposed system uses a specially designed graphical interface which looks like a maze shown in Figure 2.2. Users were asked to move their cursor to follow the paths when they log in. Experimental evaluation involved 28 participants. Each participant was required to perform the task 5 times per session, with a maximum of 1 session per day, and 6 sessions in total. The participants were asked to use the same external mouse device consistently during the whole experiment time. The velocity as the derivative on position data was computed, and a Moving Average (MA) filter was used to filter out noise. The
26 authors tried several runs of their algorithm. The first one considered only horizontal mouse move paths or only vertical mouse move paths or the combination of the above. The second attempt involved splitting paths into 18 tracks and measuring the difference between tracks. The first attempt yielded an EER between 26.8% and 29.0%. The second attempt had a higher EER at 40%.
Figure 2.2. The GUI for the mouse maze [22]
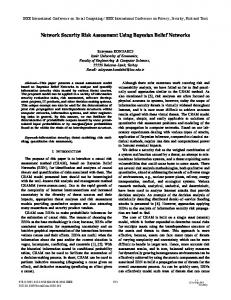
Aksari and Artuner proposed a mouse dynamics authentication scheme, in which users were required to log in by clicking randomly displayed squares for ten times on computer screen as shown in Figure 2.3 [24]. The experimental evaluation involved 10 users who produced in total 111 sessions using the same mouse device. One session was used in enrolment, and 5 sessions were used in training. The rest was used in verification. The obtained performance consisted of an EER of 5.9%.
27
Figure 2.3. The GUI for the mouse dynamics authentication system proposed by Aksari and Artuner [24]
Gamboa and Fred proposed an online user authentication system called Web Interaction Display and Monitoring (WIDAM) system [47]. The WIDAM system was described in details in [48]. The WIDAM system, implemented using Java Applet and Javascript, provides four services including Synchronous Monitoring Service, Synchronous Display Service, Recording Service, and Playback Service. A memory game was designed to collect mouse movement data and mouse click data. The extracted features include spatial features, such as angle and curvature, and temporal features, such as duration, position, velocity, and acceleration. A statistical sequential classifier is used. The experimental data was collected from 25 volunteers while they were playing the memory games for about 10 to 15 minutes. The results showed that the EER vary from 48.9% to 0.5% while varying the number of strokes between 1 and 100. Strokes were defined as successive mouse clicks in this approach.
28 2.5
Discussions
This chapter summarizes related work on security risk analysis (in general), risk-based authentication, mouse dynamics biometrics, and keystroke dynamics biometrics. It appears from our review of the literature that although a significant amount of work has been done on mouse dynamics and keystroke biometric analysis, most of these proposals have focused on static authentication. In this case the user is enrolled using a predefined set of actions, and during authentication he/she must reproduce the same actions to be granted access. As discussed earlier, static authentication is not enough to detect and protect session hijacking which represents a significant threat in online environment. An emerging approach to deal with session hijacking consists of authenticating the user continuously or dynamically throughout the session. For this process to be practical, it must be conducted unobtrusively. As mentioned earlier free keystroke dynamics and mouse dynamics analysis can be used adequately to implement this process. A remarkable finding from our literature review is that a limited amount of work has been done on free keystroke dynamics analysis; the same remark applies for free mouse dynamics analysis. Furthermore most of the existing approaches require a minimum amount of data sample for accurate decision making which may not be available in typical web sessions. Web sessions tend to be short with limited amount of mouse actions and keystrokes. The performances of the existing systems degrade significantly with such limited data. We propose in this work a new framework for analyzing free mouse movements and keystroke dynamics in web environments using Bayesian networks models. Our approach achieves encouraging performance results considering the spare
29 and limited amount of data available in web environments. Furthermore, we notice an improvement in the results when the model is augmented with user site actions information. The proposed framework is intended to be used as a risk scoring scheme in risk-based authentication.
30
Chapter 3
Background on Bayesian Network Model
Since our proposed risk-based authentication scheme is based on Bayesian network, we provide in this chapter an overview of this field. We start by introducing Bayesian theories first and then discuss artificial learning approaches using Bayesian networks. 3.1
Background on Bayesian Theories
A Bayesian Network (also known as Bayesian Belief Network) consists of a directed acyclic graph (DAG) which represents conditional probability relationships among a set of variables [42]. In the DAG, every node represents a variable and each arc represents a dependency relationship between nodes. Furthermore, there is a conditional probability distribution (CPD) table associated with each node that contains conditional probabilities of this node with regard to its immediate parent nodes. Let A and B represent occurrences of events. A directed arc from A to B depicted in Figure 3.1 denotes parent-child relationship between A and B: A is the parent of B, and B is the child of A. A
B
Figure 3.1. A is the parent of B in a directed acyclic graph
The probability of A given B denoted P(A|B) is obtained by the Bayesian Theorem as follows: P( A | B)
P ( B | A) P ( A) P( B)
(1)
31 The conditional probability P(A|B) is also known as the posterior probability for A. P(A) and P(B) denote the prior probability of events A and B, respectively. From the Bayesian network, we can obtain the posterior probability P(A|B) if the prior probability P(A) is known, and evidence of B is observed. This feature of Bayesian network is used to model causality in the real world. To illustrate Bayesian Network model, let us consider the heart disease detection and heartburn example depicted by Figure 3.2 [42]. Let E, D, HD, Hb, BP, and CP be variables representing exercise, diet, heart disease, heartburn, blood pressure, and chest pain, respectively. As shown in the relationships, exercise and diet are the factors of heart disease and heartburn, and blood pressure and chest pain are the symptoms of the disease. For example, the combination of no exercise and unhealthy diet is more likely causing heart disease. In addition, having heart disease most likely causes high blood pressure and chest pain. The relations among variables { E, D, HD, Hb, BP, CP } and examples of the probability distribution tables are shown in Figure 3.2.
Yes No
70% 30%
Healthy Unhealthy Exercise (E)
E D HD = Yes HD = No Yes Healthy 25% 75% Yes Unhealthy 45% 55% No Healthy 55% 45% No Unhealthy 75% 25%
HD BP = high BP = low Yes 85% 15% No 20% 80%
Heart Disease (HD)
Blood Pressure (BP)
25% 75%
Diet (D)
Heartburn (Hb)
Chest Pain (CP)
D Hb = Yes Hb = No Healthy 57% 43% Unhealthy 32% 68%
HD Yes Yes No No
Hb CP = Yes CP = No Yes 80% 20% No 60% 40% Yes 40% 60% No 10% 90%
Figure 3.2. An example Bayesian network for detecting heart disease and heartburn
32 If we are given an observation that a person has high blood pressure, could we know if heart disease is the cause? The problem is to compute the posterior probability . By Bayesian Theorem, we have
(2) Since heart disease has two parent relationships with exercise and diet, and exercise and diet are independent from each other, we have
where α
{ yes, no } and β
{ healthy, unhealthy }.
Also, because blood pressure is related directly to heart disease, we can write
where γ
{ yes, no },
Therefore, equation (2) can be rewritten as
(3)
33 The probability that this person does not have heart disease is . Therefore, it is highly probable that the person has heart disease. The process of obtaining the posterior probability of heart disease given high blood pressure is also called inference in Bayesian network. Inference in large scale Bayesian network or given incomplete evidences is hard. In this work, we construct simple Bayesian networks and compute posterior probability given a complete set of evidences. 3.2
Bayesian Network Learning
In our proposed approach, each user has a unique profile corresponding to each type of data (i.e., mouse, keystroke, user site action) which is represented as a trained Bayesian network. Training Bayesian network is part of the enrolment process, which involves building an optimal Bayesian network given a training set. The following assumptions are made in our Bayesian network learning approach:
the Bayesian network variables are discrete finite variables;
there is no missing value in the given data set.
As explained earlier, a Bayesian network is a directed acyclic graph in which each node is associated with a probability distribution table. In general, there are two types of Bayesian network learning approaches, namely, structure learning and parameter learning. The structure is the acyclic graph structure, while the parameters are the probability distributions. According to the different learning approaches, different measures are used to evaluate the Bayesian network. For example, the Maximum Likelihood (ML) estimator is used in parameter learning while the Minimum Description
34 Length (MDL) criterion is used in structure learning. We describe in detail each of the above mentioned learning approaches as follows. 3.2.1
Parameter Learning
Parameter learning is based on using the Bayesian theory to learn the probability distributions of a DAG. Parameter learning involves obtaining updated posterior probability distributions given prior probability knowledge and observations. According to the principle of indifference, if an event occurred multiple times, and the outcomes have n possibilities, the probability assigned to each possibility is . We define a random variable F to represent our belief about relative frequencies of an event X. Based on the principle, the probability of every possibility
is . A Bayesian
network containing such variable F for event variable X, or a set of variables Fis for event variables Xis, is called augmented Bayesian network. A simple augmented Bayesian network is shown in Figure 3.3. F
X
P(f) = ,
Figure 3.3. An augmented Bayesian network considering relative frequencies of variable X
The probability distribution of variable X depends on the probability distributions of variable F. Therefore, learning Bayesian network parameters is to learn the probability distributions of an augmented Bayesian network. In mathematics, the Gamma function [25] is defined as follows: (4)
35 The Gamma function extends the factorial function
which describes
factorial on real and complex numbers. We consider binomial Bayesian networks in our examples. Assume the states of X are binary 1 and 2, and the variable F has beta density function. Let F be a random variable whose values are in the interval [0,1], and f denotes an instance of F. Let N be the total number of trials, a the number of outcomes of X being 1, and b the number of outcomes of X being 2. Then the prior beta density function of F is expressed as (5) where ≤ f ≤ is referred to as
a > 0, b > 0, N = a + b.
.
Suppose we have a set of data samples d = {x(1), x(2), ..., x(M)}, where M stand for the sample size. We assume x(i) value is binomial which is either 1 or 2. Let s be the number of samples whose values are 1s, and t be the number of samples with values 2s. The posterior density function is
Since X conditionally depends on F, we have , where f represents the relative frequency when the value of x(i) is 1, and its values are continuous in the interval [0,1] according to the relative frequency definition in [25], we have
36
Thus,
The posterior relative frequency is also a beta density function. After learning the relative frequency, the estimated probability of sample
whose value is 1 is shown
as below. (6) Therefore, we have learned the variable probability distributions. In the cases where samples contain missing data, Expectation Maximization (EM) algorithm can be used to learn a Bayesian network. In the implementation, the posterior density distribution is iteratively calculated and determined if it reaches the point of maximum posterior probability (MAP) or maximum likelihood (ML). The examples above are based on binomial Bayesian network and the assumption that relative frequency has beta density functions. To represent multinomial augmented
37 Bayesian network, we assume X has r states. The generalization of density distribution called Dirichlet distribution is shown below. (7) where 0 ≤ fk ≤ 1, a1, a2, ...ar are relative frequency parameters, , and a1, a2, ...ar are integers ≥ 1. Assume the relative frequency has Dirichlet density function. By considering multinomial augmented Bayesian network, the estimated probability of sample
is (8)
where M is the size of samples, is the number of outcomes of X being k, , is the number of samples of X being k. Further discussion on Bayesian network parameter learning is available in [25]. 3.2.2
Structure Learning
Structure learning involves learning the DAG structure of a Bayesian network given some observations. It is known that given n random variables, finding the optimal DAG structure is a NP hard problem. This is because the number of DAGs increases exponentially with the number of variables. For this reason, heuristic search algorithms are developed to approximate DAG searching. Different approaches of structure learning include model selection and model averaging. The model selection approach uses a scoring criterion to find the most
38 probable DAG structure (i.e. the one with the highest probability score) within the set of all possible DAGs. In this approach, it is assumed that there is only one optimal DAG. The Model averaging approach is also using a scoring criterion. It is used when the number of variables is small, and scores of multiple DAGs are close to each other. In this case, the inference is done by averaging posterior probabilities of the DAGs. As discussed in parameter learning section, we use Dirichlet distribution as the parameter density distribution in a multinomial Bayesian network. Then the Bayesian scoring criterion can be written as (9) where
.
This can be used as a scoring criterion in the model selection approach. For each possible DAG, there is a Bayesian score associated with it. Since it is not practical to search all possible DAGs, heuristic search algorithms, such as greedy search and MonteCarlo methods are developed to approximate the search of optimal DAG. For instance, the K2 algorithm [41] uses greedy search approach. In this algorithm, nodes are visited in order. The parents of the visiting node are incrementally added to maximize the probability score. The Augmented Naive Bayes (TAN) [44] is another algorithm that uses a greedy approach which, in this case, is based on minimum description length (MDL) scoring criterion. MDL approach is based on minimum description length principle. In data compression, we use regularity to compress the data. This is similar to using symbols to describe strings. The fewer symbols are needed to describe the data set the better the compression of the data. In the model selection approach, the optimal model is the one with shortest encodings. MDL score is composed of two terms. One term defines
39 the number of bits to encode a Bayesian network. The other term is the log likelihood of the data. The search starts from an empty network and looks for probable naive Bayesian network to which it incrementally adds or removes arcs until achieving the maximum local scores. Both the K2 algorithm and TAN algorithm can find the optimal network in polynomial time. In our proposed system, we use TAN algorithm [56] implemented in Weka4 to learn a Bayesian network structure in enrolment stage. In this approach, Bayesian network structures are based on Naïve Bayesian networks with augmented relationships between child nodes. Examples of Bayesian network profiles will be discussed in Chapter 5. The learning algorithm uses a local scoring approach based on the Bayesian score as shown in equation (9). Once the Bayesian network structure is learned, the conditional probability distribution can be calculated according to the given training set. 3.3
Summary
This chapter introduced background knowledge on Bayesian theories and Bayesian network learning approaches. We described how to represent probability relations by using a directed acyclic graph and probability distribution tables. We also discussed the approaches used to learn a Bayesian network given a set of observations.
4
Weka is an open source data mining software developed by the University of Waikato. It provides various machine learning algorithms.
40
Chapter 4
Risk-Based Authentication Model
This chapter introduces our proposed risk-based authentication approach. The general approach is based on web site activity characteristics and behavioural biometrics such as keystroke dynamics and mouse dynamics biometrics. The proposed authentication system is composed of multiple Bayesian networks and a biometrics fusion engine. The discussion in this chapter covers behavioural biometrics and fusion method, and it is followed by a section discussing data analysis. 4.1
General Approach
Our proposed risk-based authentication mechanism is a continuous authentication system based on behavioural biometrics and user web site behaviour patterns. The system is expected to be built on browser/server architecture. The browser side runs a data interception program which collects user’s historical data, and transmits the collected data to the server. The server side performs the enrolment and identity verification processes as monitored samples are captured. The proposed system monitors three types of user behaviours: keystrokes, mouse actions, and user site actions. User enrolment involves building for each type of data a separate Bayesian network which is saved as user’s profile. During the identity verification process, the sample data is applied to the Bayesian networks representing the profile for the claimed identity. The output of the Bayesian networks model is the probability that the sample matches the profile. As shown in Figure 4.1, The fusion of the
41 three Bayesian network outputs (corresponding to the different types of data) is used to make a decision about whether the user is genuine or imposter. Keystroke Sample Data
Keystroke Bayesian Network
Mouse Action Sample Data
Mouse Bayesian Network
User Site Action Sample Data
Site Action Bayesian Network
Fusion
Decision
Figure 4.1. Identity verification process
4.2
Types of Data
Three types of behavioural data are collected: keystroke dynamics, mouse dynamics, and user site action data. Keystroke data includes key code, key press time, and key release time. We monitor two types of mouse actions which are mouse movements and mouse clicks. For mouse movements, the raw data include cursor position information such as pixel coordinates on computer window screen and mouse move time. For mouse clicks, the raw data include the mouse button press time and release time. User site action data include specific action performed and action occurrence time. Biometric features and user web site behaviour features are extracted from raw data. The feature extraction processes for the three types of data are discussed in the following sections. 4.2.1
Keystroke Dynamics
Keystroke dynamics biometric consists of extracting unique behavioural patterns from how a user types on a keyboard. Two main types of information are usually extracted
42 from the keystrokes, namely, the dwell time and the flight time. The dwell time is the time between pressing a key and releasing it. The flight time is the time between pressing two consecutive keys. The dwell and flight times can be used to compute times associated with monograph (i.e. dwell time), digraph (i.e. flight time) or n-gram (in general). An n-gram is a sequence of n consecutive keys. The time associated with an ngram k1… kn is computed as the sum of the dwell times for monographs ki and flight times for digraphs ki ki+1, where
≤ ≤
. For instance, trigraph time corresponds
to the time between releasing the first key and pressing the third key in which keys are pressed consecutively. Since there are two time points related to a keystroke – key press time and key release time, the time between two consecutive keystrokes has four variations, as depicted by Figure 4.2:
0
Dwell time 1
Dwell time 2
Key1
Key2
Press time 1
Release time 1
Press time 2
Release time 2
Time
Flight time (RD) Flight time (DD) Flight time (RR) Flight time (DR)
Figure 4.2. Flight time variations
Flight time release – down (RD): the time between releasing the first key and pressing the second key. Flight time down – down (DD): the flight time between pressing the first key and pressing the second key.
43
Flight time release – release (RR): the flight time between releasing the first key and releasing the second key. Flight time down – release (DR): the flight time between pressing the first key and releasing the second key.
In this work, keystrokes are divided into four categories based on the character ASCII codes and the mechanical keyboard layout5: Upper Case Keystrokes, Lower Case Keystrokes, Control Keystrokes, and Other Keystrokes. Keystrokes prints characters such as “%”, “&” and capitalized letters are categorized as Upper Case Keystrokes. The reason is that users must either press Caps lock key ahead or press Shift key at the same time to print these characters. All Upper Case Keystroke characters are listed in Table 4.1. Table 4.1. Upper Case Keystroke characters A
B
C
D
E
F
G
H
I
J
K
L
M
N
O
P
Q
R
S
T
U
V
W
X
Y
Z
!
“
#
$
%
&
(
)
*
+
:
?
@
^
_
{
}
|
~
Lower Case Keystrokes allow printing lower case letters on computer screen; characters from “a” to “z” fall under this category. Control Keystrokes do not result in printing characters. Examples of Control Keystrokes are tab key, back space key, and delete keys. The remaining keystrokes are grouped into the Other Keystrokes category. For each category of keystrokes, we calculate the mean and standard deviation of the dwell times as well as the distribution of each type of keystrokes within a sequence of keystrokes. The extracted keystroke dynamics features are listed in Table 4.2. 5
In this work, we consider the most popular keyboard layout which is the United States keyboard layout for Windows, Mac OS, and Linux.
44
Table 4.2. Keystroke dynamics biometric features Factor Mean of dwell time Mean of flight time
Acronym
Unit
Number of Features
M_DT
Second
1
The mean of dwell time of a sequence of keystrokes.
Description
M_FT
Second
2
The mean flight time of a sequence of keystrokes.
Mean of trigraph Time
M_TRIT
Second
1
The mean trigraph time of a sequence of keystrokes.
Standard deviation of dwell time
SD_DT
Second
1
The standard deviation of dwell time of a sequence of keystrokes.
Standard deviation of flight time
SD_FT
Second
2
The standard deviation of flight time of a sequence of keystrokes.
Standard deviation of trigraph time
SD_TRIT
Second
1
The standard deviation of trigraph time of a sequence of keystrokes.
Mean of dwell time per category
M_DTTP
Second
4
The mean of dwell time for each keystroke category in a sequence of keystrokes.
Percentage of occurrences per category
PER_TP
%
4
The distribution of each keystroke category in a sequence of keystrokes.
Percentage of occurrences of holding multiple keys
PER_MUL
%
1
The percentage of occurrences of holding multiple keys in a sequence of keystrokes.
ATS
Character / Second
1
The average typing speed of a sequence of keystrokes.
M_FTTP
Second
2
The mean of flight time for each type of user keystroke behaviour.
Average Typing Speed Mean of flight times per type of user behaviour
We extract keystroke dynamics features by processing batches of consecutive keystrokes. By default we consider batches of size n = 10. From each batch we extract a feature vector consisting of 20 features organized under 11 keystroke dynamics factors listed in Table 4.2. Each factor is represented by one or several features. Hence, each factor can be considered as a separate feature vector; the concatenation of these individual feature vectors yields our global feature space for keystroke dynamics. Every session consists of a number of keystroke dynamics feature vectors or records. Every record corresponds to a sequence of (n = 10) consecutive keystrokes. For the mean and standard deviation of flight time feature vectors M_FT and SD_FT in Table 4.2, we only consider the down – down (DD) flight times and release – down (RD) flight times. Each of these categories yields a separate feature.
45 For the percentage of occurrences per keystroke category PER_TP feature vector, we consider the all four categories: Upper Case Keystrokes, Lower Case Keystrokes, Control Keystrokes, and Other Keystrokes. When a user is typing a capitalized letter, he/she might be holding Shift key and the letter key at the same time. For this type of behaviour where the user is holding multiple keys, we calculate the percentage of occurrences within a sequence of keystrokes. This is shown as PER_MUL feature. We compute the means for two different types of flight times based on the mechanical keyboard layout and the user behaviour in typing consecutive keys. The first type of flight time is the flight time corresponding to when both consecutive keys belong to Upper Case Keystrokes category, or neither of the consecutive keys is from Upper Case Keystrokes category. The second type of flight time is when one and only one of the two keys belongs to the Upper Case Keystrokes category (i.e. while the other keystroke does not). These two types of means are represented by two feature values in the M_FTTP feature vector in Table 4.2. 4.2.2
Mouse Dynamics
Mouse dynamics biometric consists of extracting unique behavioural characteristics for a user based on his mouse actions which consist of mouse movements and mouse clicks. The raw mouse data consist of mouse movement coordinate, movement angle, the time to move the mouse from one location to the other, and the time of mouse clicks. Mouse movement angle is the angle of mouse movement curve which is measured as shown in Figure 4.3 (a). The mouse movement angle is defined as the angle between the
46 mouse movement curve and the positive x-axis as suggested in [3]. As proposed in [3], the mouse movement directions can be divided into eight areas of 45° each as shown in Figure 4.3 (b).
y
(X2, Y2)
Angle (X1, Y1)
(a) Mouse movement angle
x
(b) Mouse movement directions
Figure 4.3. Mouse movement angles and directions
Mouse features are extracted from batches of consecutive mouse actions; by default we consider batches of size n = 30. We extract 66 features from the raw data organized under 10 factors listed in Table 4.3. Each factor is represented by a separate feature vector consisting of 1 or several features. The concatenation of these individual feature vectors correspond to a 66-dimentional mouse feature vector or record. Likewise each session consists of several mouse records, each corresponding to (n = 30) consecutive mouse actions. In Table 4.3, factors PER_MAD, PER_DD, PER_MTD, ADD, ASD, AVXD, AVYD, and ATVD are calculated for each of the 8 movement directions (identified above.) As a result, each of these factors is represented by eight feature values, each corresponding to a separate direction.
47 Table 4.3 depicts the mouse dynamics features. Table 4.3. Mouse dynamics biometric features Acronym
Unit
Number of Features
Average click time
ACT
Second
1
The average of mouse clicks time.
Silence ratio
SR
%
1
The percentage of silence occurrence of a sequence of mouse actions.
PER_MAD
%
8
The percentage of mouse action occurrence of a sequence of mouse actions in each mouse move direction.
PER_DD
%
8
The percentage of mouse move distance of a sequence of mouse actions in each mouse move direction.
PER_MTD
%
8
The percentage of mouse move time of a sequence of mouse actions in each mouse move direction.
Average distance per mouse movement direction
ADD
Pixel
8
The average distance in each mouse movement direction.
Average speed per mouse movement direction
ASD
Pixel / Second
8
The average speed in each mouse movement direction.
Average velocity in X axis per mouse movement direction
AVXD
Pixel / Second
8
The average velocity in X axis in each mouse movement direction.
Average velocity in Y axis per mouse movement direction
AVYD
Pixel / Second
8
The average velocity in Y axis in each mouse movement direction.
Average tangential velocity per mouse movement direction
ATVD
Pixel / Second
8
The average tangential velocity in each mouse movement direction.
Factor
Percentage of mouse action per mouse movement direction Percentage of distance per mouse movement direction Percentage of mouse move time per mouse movement direction
Description
A silence occurrence is identified when the mouse move distance is 0. The percentage of silence occurrence in a sequence of mouse actions is represented by the feature SR. 4.2.3
User Site Action
User site actions refer to the user activities on the website, such as log in, browsing webpage, posting messages, and uploading pictures. User site actions are used to extract characteristics of user behaviour patterns on the website. Various features can be extracted such as how much time was spent in performing an action and how frequently an action was performed.
48 Table 4.4 lists some examples of types of user site actions in a prototype social networking site used in our experiments described in the next chapter. We extract from the raw data 12 features organized under 4 different factors listed in Table 4.5.
Table 4.4. User site actions User Site Action
Description
Log In
The action of logging in by using user account and password information.
Add Status Comments
The action of posting comments on user’s status.
Add Picture Comments
The action of posting comments on user’s pictures.
Add Status
The action of adding status.
Upload Picture
The action of uploading pictures.
Table 4.5. User site action factors Factor
Acronym
Unit
Number of Features
Description
Frequency of action types
ATF
/ Second
1
The frequency of performing different action types.
Average action gap
AAG
Second
1
The average time period between two consecutive actions.
Average action time per type
AAT
Second
5
The average time of performing each type of action.
Average action frequency per type
AAF
/ Second
5
The average frequency of performing each type of action.
For user site actions, features are extracted from actions performed in every session. Features such as action gap are computed for each pair of consecutive actions. The type of site action refers to the categories of actions offered by the site. In this work, we consider the 5 categories listed in Table 4.4; as such factors AAT and AAF are represented by 5 feature values. 4.3
Data Analysis
As discussed in Chapter 1, the collected raw data is transmitted to the server from web browsers. On the server side, a series of procedures are performed to process the data in either enrolment stage or verification stage. The processes include feature extraction,
49 noise reduction, and data discretization. This section discusses each of these processes in detail. 4.3.1
Feature Extraction
The feature extraction refers to the process of extracting biometric features or behavioural pattern features from raw data. The features are extracted from each of the different types of data as described in the previous sections. 4.3.2
Noise Reduction
After feature extraction process, noise reduction is performed on keystroke dynamics biometric features and mouse dynamics biometric features. Noise reduction, in our framework, involves applying filters on extracted feature vectors. We first discuss the noise reduction process on keystroke dynamics features. As mentioned in section 4.2.1, flight time is defined as the time between two consecutive keystrokes. For instance, the flight time (down-down) is the time between pressing the first key and pressing the second key. First, the flight time value must be positive, since the keys are pressed consecutively. Second, in our collected raw data set, the maximum keystroke flight time (down-down) is 111.58 minutes. This is considered as noise data. Actually only a small amount of samples involve flight times beyond 3 seconds. The percentage of records with flight time (down-down) greater than 3 seconds is 5.34% in the keystroke data set. As a result, we applied a filter by removing data which is outside the range [0, 3] seconds.
50 The probability distribution of keystroke flight time (down-down) feature is shown in Figure 4.4. Figure 4.4 (a) displays the probability distribution before filtering, and Figure 4.4 (b) displays the probability distribution after filtering.
(a) Probability distribution before filtering
(b) Probability distribution after filtering
Figure 4.4. Noise reduction on keystroke flight time (down-down) feature
One of the main sources of noise in the mouse movement data is the mouse input device. For instance, an optical mouse might have problems detecting surface information and input wrong mouse movement data, such as wrong mouse coordinate information. We believe this is the cause of high mouse move speed value, which is considered as noise data. Another possibility is that a user might use a touching screen handheld computer, on which the detected mouse movement is different than the data collected from commonly used computer mouse device. When a user is using a touch screen, the mouse movement curve might show a sudden change, because the user is able to move his finger from one touching point to another without a trace of mouse
51 movement on the way through. If the same mouse movement curve happened on a regular computer, the mouse move curve would be captured as a smooth curve. By applying suitable filters, we expect to remove noise data and generate mouse dynamics signatures for individual users. For mouse dynamics data, we apply two types of filters. First, we applied moving average filter on the captured mouse move position data (computer screen x-y coordinates) to remove noise data. Using moving average, we take the means of 5 points as the new values of the center point. We apply the moving average filter on x-coordinates and y-coordinates separately. The second filter applied on mouse dynamics data is similar to the filter applied on keystroke dynamics. The mouse dynamics data considered are mouse move time and speed. In the mouse dynamics data set collected in our experiment, the maximum mouse move time is 1275.53 minutes. This is considered as noise data. Also, the maximum speed is 841,010 pixels per second. It is impossible in real world that a user can move a computer mouse by that speed. The percentage of data with mouse move time less than 1.5 seconds and mouse move speed less than 5,000 pixels per second is 97.44% over the mouse dynamics data set. Therefore, we filter out as noise mouse move time and mouse move speed falling out of the range [0, 1.5 seconds] and [0, 5,000 pixels], respectively. The data probability distributions before and after applying the filter are shown in Figure 4.5.
52
(a)
(b)
(c)
(d)
Figure 4.5. Noise reduction on mouse dynamics data (a) Speed probability distribution before filtering. (b) Speed probability distribution after filtering. (c) Mouse move time probability distribution before filtering. (d) Mouse move time probability distribution after filtering.
53 4.3.3
Data Discretization
As discussed previously, we learn a Bayesian network to build the user profile and then use it to classify monitored samples. In Bayesian network learning, it is assumed that variables are discrete and finite. Since most of the features extracted from keystrokes and mouse actions are continuous, we convert them into nominal features using a discretization technique. For instance, keystroke dynamics dwell time is a continuous feature. Assume the dwell time variable has the range [30.0, 120.0]. A discretization method is to partition the range into three bins [30.0, 50.0], (50.0, 100.0], and (100.0, 120.0]. This method is called binning discretization. There are two types of discretization approaches: unsupervised discretization and supervised discretization. Unsupervised discretization does not consider the class attribute in the training set. An example of unsupervised discretization is the binning method given above. Binning method is to partition a range into k equal interval bins or k equal frequency bins where each bin contains equal number of values. In this method, k is an input parameter. In supervised discretization approach, we consider the impact of class attribute. For example, the entropy based discretization method developed by Fayyad and Irani [45] is a supervised discretization approach. In this method, let A be an attribute in a data set S. After sorting the sequence, we partition the set S into two subsets S1 and S2 by finding a threshold value T, where S1 and S2 are sets of attribute values of A1 ≤ T and A2 > T, respectively. The class entropy of the set S is defined as
54
where k is the number of classes and Pi is the probability of the ith class. The entropy of the partition is defined as
For the attribute A, we do binary partition on A, and the cut point TA is decided when E(A,TA;S) is the minimum of all possible partitions. Kononenko proposed a MDL based method to measure attribute quality [53]. The MDL value can be used as a criterion in data discretization in such a way that the smaller the MDL value the better quality of the attribute. In our work, we use Kononenko’s MDL based method in mouse dynamics data discretization and Fayyad and Irani’s method in keystroke dynamics data discretization. For the user site action data discretization, we use unsupervised frequency binning discretization method. 4.3.4
Bayesian Network Classifier
In our approach, after learning a Bayesian network, we use the trained network as a classifier to classify sample data. This allows us to determine whether corresponding sample belongs to an authorized user or an unauthorized user. This is equivalent to classifying the user as genuine or imposter. For example, suppose we want to verify if the user who contributed keystrokes is the claimed user U. Assume that in the enrolment stage, we have built a keystroke dynamics
55 Bayesian network for user U by using training set with three variables { IsAuthorized, Dwell Time, Flight Time }. Since Dwell Time is a continuous variable, we assume its nominal values are {[100, 110], (120, 130], (130, 140]}. Similarly, the nominal values for Flight Time are assumed to be {[200, 210], (210, 220], (220, 230]}. After learning the Bayesian network, we obtain the Bayesian network profile for user U shown in Figure 4.6. This type of Bayesian network is a Naïve Bayesian network. Yes No
DT = DT = DT = [100, 110] (120, 130] (130, 140] Yes 23% 56% 21% No 3% 26% 71%
38% 62%
IsAuthorized (A)
A
FT = FT = FT = [200,210] (210, 220] (220, 230] Yes 75% 15% 10% No 18% 45% 37%
A
Dwell Time (DT)
Flight Time (FT)
Figure 4.6. A trained Bayesian network example
Using a Bayesian network as a classifier involves computing the posterior probability for the class variables and determining its class according to a threshold. For example, if a given evidence is {DT = (120, 130], FT = (220,230]}, we would like to verify whether the sample belongs to user U. First, we compute and
.
where Similarly,
.
56
Since
We have α=12.3579. Therefore,
The probability of the observed keystrokes belonging to user U is 26.3%, which is lower than the probability of the user being an imposter – 73.7%. If the threshold is 50%, the user will be classified as an imposter. 4.3.5
Fusion Method
After obtaining output probabilities from three models – keystroke dynamics Bayesian network model, mouse dynamics Bayesian network model, and user site action Bayesian network model, a fusion method is applied to obtain the overall probability. The output of the fusion function is the output of our model. After that, a threshold is applied to decide if the user is genuine or an imposter. Given the score Ei (1 ≤ i ≤ n) obtained from the different modalities, we compute the Bayesian fusion score as follows:
57
where n is the number of data types, E is the fused score. For example, if the outputs obtained from the three models are: 0.24, 0.56, and 0.61. The fused score is
. Therefore, the
probability of this user to be genuine is 38.6%. 4.4
Summary
In this chapter, we presented our risk-based authentication approach in detail. First, we described how to extract features for three types of data – keystroke dynamics, mouse dynamics, and user site actions. After that, we explained our data analysis methods, including noise reduction, data discretization, and classification using Bayesian network model. In the next chapter, we discuss the experiment conducted to evaluate the proposed approach.
58
Chapter 5
Experimental Evaluation
In this chapter, we present the experimental evaluation of our proposed framework. The experimental evaluation was conducted on a simulated social network website. A social network website is an online application through which users share personal information such as family events or photos with friends. The experimental website was designed to collect user data when they visit the website. The experiment period spanned about two months. 5.1
Description of the Website
The experimental website is a simpler version of a social network website. The main page is a normal user log on page using user name and password authentication as shown in Figure 5.1.
Figure 5.1. Experimental website log on page
59 After accessing an account, the website allows a user to perform the following actions:
Post status Post pictures Add comments on account owner’s pictures Browse friends list Add comments on friends’ status Add comments on friends’ pictures
The experimental website has embedded data interception program which collects keystrokes, mouse actions, and user site actions. The interception program was unobtrusive to test users. The user behaviour on the experimental website might be different from the actual websites such as: 1. users usually spend more time (e.g., more than 5 minutes) on social network websites and less time on banking websites (e.g., less than 5 minutes). 2. users usually type more text on social network websites compared to the banking websites. 3. users usually perform more mouse actions, such as mouse clicking and drag and drops, on online game websites compared to other commercial websites. 4. user site actions could be different on the actual websites depending on the website contents. Since keystroke dynamics and mouse dynamics are unique user behaviour patterns, the website content would not be a major factor affecting user biometrics. On the other hand, the experimental website might not allow collecting as much data as what could be possible with an actual commercial website because of the limited experiment timeline and the limited number of test users. The impact on the experiment would be discussed in the Test Results in section 5.7.
60 5.2
Instructions for Users
This section describes the instructions for test users. The purpose of giving the instructions was to give test users a brief idea about what they would do on the experimental website. Another purpose was to allow us to collect enough data for analysis. As expected, test users did not always follow the instructions. Therefore, we have limited number of users who contributed enough data for the testing. The details will be discussed in the Test Results in section 5.7. The detailed instructions are described as follow. Each user was required to log in the web site as themselves (genuine user) or other users (intruder). For each login session, the logging type will be recorded. Users have access to the user names and passwords of other users, in order to allow impersonation attacks. Users are required to browse the web pages and type some text per visit. The web pages continuously collect user data, such as IP address, web browser information, keystroke dynamics, and mouse dynamics, and transfer the data to the server. The server side has a database that stores all the data collected. 5.2.1
Logging In as Genuine User
When logging in as a genuine user, users were asked to maintain consistent behaviour in the first week. For example, the user might log in the website twice a day, once in the morning, and the other time in the evening. The user would decide which computer to use to log in the experimental website. It would be preferred that the user uses different
61 computers to log in the system. Each user was asked to log in as genuine user for at least a number of times, with each visit lasting at least 5 minutes. 5.2.2
Logging In as Intruder
When logging in as an intruder, each user will log in using another user’s name and password. Each user was asked to choose at least 5 other different user accounts to be experimented with over the length of the experiment, and to log in at least 5 times for each of the selected user accounts over the length of the experiment. Users were free to decide when to log in by themselves. They would perform casual browsing or post messages on the website. Each intrusive visit was expected to last at least 5 minutes. 5.3
Experiment Set Up
The architecture of the website consists of a web server and a database server. The web server and the database server were set up on a computer with Dual CPU 3.2GHz and memory 2.00 GB RAM in the Information Security and Object Technology (ISOT) Research Lab. The server was Windows Server 2008. The database server was MySQL server. Users used their own desktops, laptops or handheld devices (i.e. iPhone) to access the website. Requests originated from four different geographic locations, including Victoria (BC, Canada), Toronto (ON, Canada), Oslo (Norway), and Shanghai (China). 5.4
Collected Data
In total, 24 users with different background and computer skills participated in the experiment. The experiment lasted from March 16, 2010 to May 13, 2010.
62 In total, 193 legitimate visits and 101 intrusive visits were contributed by the test users. A total number of 35,519 keystrokes, as well as 489,051 mouse actions and 982 user site actions records were collected. A small portion of the original data was saved incorrectly due to the presence of bugs in the experimental website. These data had to be removed. The analysis was based on the set of samples after removing the incorrect data. Table 5.1 shows the numbers of samples before and after the correction.
Table 5.1. Numbers of collected samples Keystrokes
Total Number of Samples Number of Samples (per user, after correction)
Mouse Actions
User Site Actions
Genuine Data
Attack Data
Genuine Data
Attack Data
Genuine Data
Attack Data
All
26,886
8,633
379,094
109,957
718
264
After Correction
22,585
6,696
344,005
103,620
718
264
Minimum
11
42
303
371
1
1
Maximum
6,337
1,268
84,503
22,093
154
47
Average
1,264
417
19,007
6,205
29
13
The data collected under each of the three different modalities (keystroke, mouse actions, user site actions) were grouped by sessions. A session, here, corresponds to a regular login session which spans from the time the user logs in to when he/she logs out. The samples collected within one session were grouped by a unique session ID. In the experiment, every test user contributed different numbers of sessions. The average numbers of samples are different as shown in Table 5.1; the highest entries are related to mouse actions, while the lowest entries correspond to user site actions. Figure 5.2 shows the histograms for each type of data collected from test users. We can see that the test users contributed varying numbers of samples. About half of the test
63 users contributed significant amount of genuine keystrokes and mouse actions data in total.
(a) Keystrokes (genuine data)
(b) Keystrokes (attack data)
(c) Mouse actions (genuine data)
(d) Mouse actions (attack data)
(a) User site actions (genuine data)
(b) User site actions (attack data)
Figure 5.2. Numbers of samples contributed by test users
64
Although, the total numbers of samples provided by test users are high, the number of samples for each session is low. For example, over all genuine keystroke sessions, 62.6% of them contain less than 100 keystrokes. Since we used JavaScript function to collect mouse actions, we collect more mouse action samples. The user site actions samples involved the lowest entries in that the percentage of genuine sessions containing less than five samples is 71.3%. 5.5
Evaluation Method
For each user, a reference profile was generated for each type of data based on a training set consisting of positive and negative records. Only genuine records were used in the training sets. Genuine data is divided into enrolment data and test data based on the timeline; the earliest data (received in time) was used for enrolment while data collected subsequently was used for testing. For each of the legal users, the positive records in the training set consisted of genuine enrolment samples for that user, while the negative training records consisted of enrolment data from other randomly selected legal users. The numbers of selected users varied for each modality. For instance, the number of selected legal users for keystroke dynamics is 8, while the number of selected users for mouse dynamics is 4 and 10 for site action data. By analyzing sample data, we found that the minimum number of positive records required to effectively train the Bayesian network for each of the different modalities varies. For example, the minimum number of keystroke dynamics records is 200, while
65 2,500 for mouse dynamics and 24 for user site actions. If the total number of genuine records for a specific user is lower than the minimum requirements, we use all of their records to create the training set. To evaluate the system performance, we calculate False Rejection Rate (FRR) and False Acceptance Rate (FAR). A false rejection occurs when a genuine user is incorrectly rejected by the system as an imposter. A false acceptance occurs when the system fails to detect an imposter; in other words, the imposter is able to impersonate a genuine user. To test for false rejection, for each of the genuine users, we compare one-by-one the rest of their genuine sessions (not involved in building their profile) against their profile. The FRR for each of the genuine users is obtained as the ratio between the number of false rejections and the total number of trials. The overall FRR is obtained as the average of the individual FRRs obtained for all the genuine users. To test for false acceptance, for each genuine user, we compare one-by-one against their profile the attack sessions generated for this user. The individual FAR is computed for each user as the ratio between the number of false acceptances and the number of test trials. The overall FAR is computed as the average of the individual FAR over all the genuine users.
66 5.6
User Enrolment
The experimental enrolment is a simulation of real enrolment process. In a real enrolment stage, all samples collected in this stage are assumed to be genuine and used to build user profiles. The samples collected later are suspected and used in verification.
Table 5.2. Bayesian network training records and validation results for legal users
User 2
User 3
User 5
User 7
User 10
User 11
User 12
User 18
User 20
User21
User22
User 24
Keystroke Dynamics Mouse Dynamics Site Actions Keystroke Dynamics Mouse Dynamics Site Actions Keystroke Dynamics Mouse Dynamics Site Actions Keystroke Dynamics Mouse Dynamics Site Actions Keystroke Dynamics Mouse Dynamics Site Actions Keystroke Dynamics Mouse Dynamics Site Actions Keystroke Dynamics Mouse Dynamics Site Actions Keystroke Dynamics Mouse Dynamics Site Actions Keystroke Dynamics Mouse Dynamics Site Actions Keystroke Dynamics Mouse Dynamics Site Actions Keystroke Dynamics Mouse Dynamics Site Actions Keystroke Dynamics Mouse Dynamics Site Actions
Positive Training Number of Number of Sessions Records 2 579 3 8,407 4 37 3 597 4 9,632 5 22 8 395 3 4,900 11 28 2 671 3 6,809 5 34 11 369 10 2,794 13 25 2 474 2 6,761 6 23 3 237 5 3,963 8 19 2 215 3 7,772 5 24 11 199 3 6,128 8 31 4 271 5 6,096 5 16 3 512 2 9,853 4 24 4 44 4 5,155 8 13
Negative Training Number of Number of Sessions Records 32 2,235 14 35,889 44 117 34 1,711 28 28,985 63 181 29 1,470 12 32,682 61 172 17 1,785 11 32,222 52 173 26 1,876 7 20,893 51 176 45 2,611 12 33,066 52 185 26 2,570 20 26,294 60 193 30 2,331 12 21,004 43 153 21 1,845 21 23,703 67 196 30 2217 23 33,313 43 170 34 2,771 21 24,178 47 143 33 2,382 14 29,220 53 213
* PCCR stands for the Percentage of Correctly Classified Records.
PCCR (%) 91.61 95.70 79.22 97.44 92.57 88.18 93.03 97.85 85.00 90.35 98.91 83.09 92.69 98.43 87.56 97.21 96.42 89.90 95.48 98.41 91.04 96.11 98.83 85.88 94.23 94.27 87.22 95.70 98.64 90.86 94.15 93.60 85.03 99.22 96.84 94.25
67 5.6.1
Training Strategy
We used stratified 10-fold cross validation to train the Bayesian network corresponding to a user profile. The validation steps are the following. First, randomize the records and divide them into 10 equal size subsets (or 10 folds). Each fold has similar class distribution. This type of validation is called stratified validation. Second, repeat the run tests for 10 times. In each round i (1 ≤ i ≤ 10), the ith subset is removed from the training set and is used as a test set. We then obtain correctly classified records for 10 tests. The correctly classified records are the records whose predicted class probability is over 50%. The total number of correctly classified records is the sum for 10 tests. The percentage of correctly classified records (PCCR) is the total number of correctly classified records divided by the total number of records divided by 10. Table 5.2 lists the numbers of sessions and records in each training set and the PCCR corresponding to legal users’ profiles. In the following sections, we will present the profiles obtained for each of three types of data. 5.6.2
Keystroke Dynamics Profile
In keystroke dynamics biometric enrolment process, a keystroke Bayesian network is built for each user. As a result, every user has a unique keystroke Bayesian network, which is saved as the user’s profile. Figure 5.3 displays the trained keystroke Bayesian Networks for two different users: User 2 and User 7.
68 In the verification stage, we apply sample keystroke dynamics records on the Bayesian network profile of a given user to compute the probability that the records were generated by the user. Obviously the probability is expected to be high if the records belong to the user and low, otherwise. IsAuthorized
M_FT1 PER_TP1 M_TRIT
SD_FT1
M_FT2
SD_FT2
M_FTTP1
SD_TRIT
SD_DT M_DTTP2
M_DT
PER_TP3
M_DTTP3
ATS
M_DTTP4
M_DTTP1
M_FTTP2
PER_TP4
PER_TP2
PER_MUL
(a) User 2 IsAuthorized
M_DTTP1
PER_TP1
PER_TP2 M_FT1
SD_DT PER_TP4
ATS SD_FT2
M_FT2
SD_FT1
PER_MUL
M_FTTP1 M_DTTP2
M_DT
M_DTTP3
PER_TP3
M_TRIT M_DTTP4
SD_TRIT
M_FTTP2
(b) User 7
Figure 5.3. Keystroke Bayesian networks for two different users: User 2 and User 7
Table 5.3 shows examples keystroke dynamics records for User 2 and User 7. The records are consecutive in time and are selected from a genuine session for each of the users. The Prob. (%) column in Table 5.3 is the class probability of the record. The column of Other Prob. (%) is the class probability obtained by applying the given record on the other user’s profile network. For example, by applying the record No. 1 of User 2
69 on User 7’s Bayesian network profile, the class probability is 0.14%, while the class probability of applying the same record on User 2’s own network is 98.94%.
Table 5.3. Examples of keystroke records for two different users: User 2 and User 7
User 2
User 7
No.
SD_DT
1
SD_TRIT
M_DT
0.104128
0.150589
0.099873
0.098411
0.032093
0.097302
4
0.026215
5
0.026572
6
2
0.039956
0.099961
2
0.032755
3
M_FT 1
2
0.0849
0.1191
0.0342
0.137492
0.0781
0.1193
0.093934
0.132825
0.0772
0.098131
0.08989
0.135317
0.088267
0.079932
0.139159
0.024306
0.087728
0.084767
7
0.008588
0.083881
8
0.010111
0.085277
9
0.011252
10
M_TRIT
2
3
4
0.1788
0
0.084889
0.085
0
0.0412
0.1901
0
0.077333
0.085
0
0.1236
0.0464
0.1939
0
0.076333
0.085
0.0716
0.1222
0.0506
0.1856
0
0.070111
0.085
0
0.0725
0.1097
0.0372
0.1728
0
0.069125
0.085
0.087
0.131967
0.0788
0.1103
0.0315
0.181
0
0.077
0.085
0.087
0.084966
0.13217
0.0882
0.1242
0.036
0.1804
0
0.08875
0.085
0.087
0.085236
0.112897
0.0874
0.1191
0.0317
0.1644
0
0.08775
0.085
0.087
0.055687
0.05843
0.177971
0.086
0.1074
0.0214
0.1938
0
0.085889
0
0.087
0.016706
0.125797
0.116139
0.190079
0.0899
0.1471
0.0572
0.2231
0
0.085625
0
0.107
1
0.050926
0.034017
0.047274
0.412757
0.2494
0.0848
-0.1646
0.0533
0
0.2494
0
0
2
0.051139
0.3958
0.415266
0.548219
0.2492
0.2179
-0.0313
0.1862
0
0.2492
0
0
3
0.051428
0.395951
0.415302
0.549435
0.249
0.2175
-0.0315
0.1833
0
0.249
0
0
4
0.052935
0.397011
0.418432
0.551459
0.2539
0.2148
-0.0391
0.1792
0
0.2539
0
0
5
0.04818
0.396128
0.415551
0.54908
0.2499
0.2183
-0.0316
0.1841
0
0.2499
0
0
6
0.046413
0.396829
0.415518
0.547756
0.2472
0.2157
-0.0315
0.1867
0.266
0.245111
0
0
7
0.046371
0.395937
0.41904
0.550498
0.2601
0.2182
-0.0419
0.1817
0.292
0.252125
0
0
8
0.063524
0.394407
0.415421
0.543795
0.2475
0.2218
-0.0257
0.1969
0.233333
0.253571
0
0
9
0.080408
0.394777
0.413249
0.542432
0.2326
0.2208
-0.0118
0.2561
0.233333
0.232286
0
0
10
0.089118
0.400932
0.427231
0.538673
0.2077
0.2661
0.0584
0.3244
0.1915
0.2185
0
0
1
2
3
4
PER_MUL
ATS
1
0
90
10
0
40
2
0
90
10
0
40
3
0
90
10
0
40
4
0
90
10
0
40
5
0
80
10
10
6
0
80
10
7
0
80
8
0
9 10
PER_TP
M_FTTP
Prob. (%)
Other Prob. (%)
0
98.94364
0.141929
0
95.52419
0.253472
0.193
0
95.52419
0.253472
0.1925
0
99.86999
0.999164
0.1863
0
99.91925
0.174863
9.87393
0.1963
0
99.60287
0.834865
40
9.56358
0.2094
0
99.12065
0.260601
10
40
9.72261
0.2029
0
99.12065
0.202846
0
10
40
9.4924
0.1951
0
16.94235
52.26201
0
20
40
8.90837
0.197222
0.649
7.256421
18.44556
1
2
10.996
0.195
11.0521
0.1943
10.7915 11.0159
40
11.1142
10
40
10
10
80
10
0
90
0
80
Average:
User 7
M_DTTP 1
No.
User 2
SD_FT 1
81.18
7.38
1
0
100
0
0
100
6.67098
0.334
0
94.24533
1.94E-07
2
0
100
0
0
90
6.06019
0.4669
0
8.223747
2.10E-05
3
0
100
0
0
90
6.17017
0.4714
0
8.223747
2.10E-05
4
0
100
0
0
90
6.19754
0.4647
0
80.78504
2.10E-05
5
0
100
0
0
90
6.01406
0.472778
0.4
8.223747
4.82E-06
6
10
90
0
0
90
5.88674
0.484222
0.4
0.381316
1.98E-04
7
20
80
0
0
90
5.66572
0.506625
0.413
5.297715
1.98E-04
8
30
70
0
0
90
6.42273
0.540857
0.326667
99.95875
7.40E-06
9
30
70
0
0
90
6.1902
0.565167
0.279
96.99214
7.40E-06
10
40
60
0
0
80
5.89522
0.609
0.3364
98.82046
4.03E-06
50.12
4.83E-05
Average:
0
For instance, column M_DT refers to the keystroke dynamics feature Mean of Dwell Time which is discussed in section 4.2.1. Column names correspond to the feature acronyms in Table 2.
A trained Bayesian network is used as a user’s profile. It is not only because the probability causal relationship signatures are different, but also because the probability distribution signatures are different. For example, if one user’s record is applied on the Bayesian network corresponding to the profile of another user, the classification results should yield significant differences. This is demonstrated in Table 5.3.
70 In the verification, we use the average of the records’ class probabilities as the session class probability. For instance, in Table 5.3, the average class probability for User 2 is 81.18%. This is the session class probability. If we set the threshold as 50%, this session will be classified as genuine session for the claimed user. 5.6.3
Mouse Dynamics Profile
Mouse dynamics features, such as mouse move speed and mouse move distance, are used in building the user profile as a Bayesian network. Similarly, we build for each user a unique mouse Bayesian Network profile. Figure 5.4 shows the mouse Bayesian networks for User 2 and User 7. Table 5.4 lists example mouse records from genuine sessions for User 2 and User 7. The class probability values from mouse data records obtained by applying the data on trained Bayesian networks are shown as well. In Table 5.4, the Other Prob. (%) column shows the class probability of applying records on the other user’s profile network. The Other Prob. (%) values are lower than the class probabilities. For example, if we apply User 2’s records on User 7’s profile, the session probability is 11.72%, which is much lower than the probability of applying records on User 2’s own profile (67.51%). This illustrates that the probability for User 2 successfully masquerade User 7’s identity is low based on their mouse dynamics signatures.
Figure 5.4.
(a) User 2
71
Figure 5.4. Mouse Bayesian networks for two different users: User 2 and User 7
(b) User 7
72
73
Table 5.4. Examples of mouse dynamics records for two different users: User 2 and User 7 No. ACT SR User 2
User 7
3
4
5
6
7
0
0
0
6.66667
0
0
3
4
5
6
7
0
0
0
44.7434
0
0
0 93.3333
0
0
0
6.66667
0
0
0
54.292
0
0
0
45.708
0
0
0
0
0 93.3333
0
0
0
6.66667
0
0
0
53.4335
0
0
0
46.5665
0
0
4
0
0 93.3333
0
0
0
6.66667
0
0
0
53.1572
0
0
0
46.8428
0
5
0
0 93.3333
0
0
0
6.66667
0
0
0
53.1401
0
0
0
46.8599
6
0
0 96.6667
0
0
0
3.33333
0
0
0
63.1086
0
0
0
7
0
0
100
0
0
0
0
0
0
0
100
0
0
8
0
0
100
0
0
0
0
0
0
0
100
0
9
0
0
80
0
0
0
6.66667
0
0
10
0
0 83.3333
0
0
0
6.66667
0
0
1
0
0 13.3333
0
30
26.6667
0
3.33333
0
2
0
0 13.3333
0
30
26.6667
0
0
0
30
3
0
0 13.3333
0
26.6667 26.6667
0
3.33333
0
30
4
0
0 13.3333
0
23.3333 26.6667
0
6.66667
0
30
6.4369
5
0
0 13.3333
0
26.6667
0
10
0
30
6
0
0 13.3333
0
16.6667 26.6667
0
13.3333
0
30
7
0
0 13.3333
0
13.3333 26.6667
0
16.6667
0
8
0
0 13.3333
0
26.6667
0
20
9
0
0 33.3333 10 43.3333 13.3333
0
10
0
0 36.6667 10 43.3333
0
2
0
3
10
10
PER_MTD
1
2
3
4
5
6
0
0
0
83.8733
0
16.1267
0
0
0
83.8733
0
0
16.1267
0
0
0
83.8733
0
0
0
16.1267
0
0
0
83.8733
0
0
0
0
16.1267
0
0
0
83.8733
0
36.8914
0
0
0
79.4521
0
0
0
20.5479
0
0
0
0
0
0
100
0
0
0
0
0
0
0
0
0
0
0
100
0
0
0
0
0
0
0
0
42.5633
0
0
15.0279 13.8229
0
0
0
83.8733
0
44.6626
0
0
0
43.1776
0
0
12.1598 14.3988
0
0
0
83.8733
0
26.6667 4.53523
0
46.3198 10.5898
0
20.2517
0
18.3034 2.34917
0
78.4837 4.69834
0
9.71703
5.668
0
57.8891 13.2348
0
0
0
23.2081 2.58519
0
86.369
5.17039
0
0
6.20396
0
52.7517 14.4862
0
1.15549
0
25.4026 1.53364
0
50.854
3.06727
0
41.0596
0
49.2611 15.0302
0
2.91538
0
26.3564 1.5331
0
50.3484
3.0662
0
41.5679
6.45873
0
46.1772 15.0811
0
5.83708
0
26.4458 1.53364
0
49.7734 3.06727
0
42.1401
6.77545
0
39.5263 15.8207
0
10.1349
0
27.7426 1.53257
0
49.1815 3.06513
0
42.7377
30
7.31596
0
28.6054 17.0828
0
17.0401
0
29.9558 1.53417
0
48.5704 3.06834
0
43.3403
0
30
7.78034
0
17.389 18.1671
0
24.8063
0
31.8572 1.53364
0
47.9958 3.06727
0
43.9177
0
0
0
41.3229 3.02354 50.6275 5.02604
0
0
0
0
30.3725 2.96084 61.8911 4.77555
0
0
0
0
0
42.7305 3.08091 51.5881 2.60044
0
0
0
0
31.6444 2.96367 61.9503 3.44168
0
0
3.33333 50.4969
13.3333 42.4088 10
ADD
8
1
ASD
AVXD
3
4
5
6
7
8
1
2
3
4
5
6
7
8
1
2
3
4
5
0
0
0
185.94
0
0
39.56
1943.06
0
0
0
2231.24
0
0
4945
1689.81
0
0
0
-2033.11
15.7757
0
0
0
185.94
0
0
0
1971.96
0
0
0
2231.24
0
0
0
1727.68
0
0
0
-2033.11
15.24
0
0
0
185.94
0
0
0
1905
0
0
0
2231.24
0
0
0
1669.64
0
0
0
-2033.11
0
15.0718
0
0
0
185.94
0
0
0
1883.97
0
0
0
2231.24
0
0
0
1656.25
0
0
0
-2033.11
0
0
15.0614
0
0
0
185.94
0
0
0
1882.68
0
0
0
2231.24
0
0
0
1665.18
0
0
0
-2033.11
6
0
0
15.4414
0
0
0
261.77
0
0
0
1930.17
0
0
0
4362.83
0
0
0
1719.83
0
0
0
-3966.67
7
0
0
15.8957
0
0
0
0
0
0
0
1986.96
0
0
0
0
0
0
0
1783.33
0
0
0
0
8
0
0
15.9047
0
0
0
0
0
0
0
1988.08
0
0
0
0
0
0
0
1808.33
0
0
0
0
9
0
2.30382 15.4387
0
0
0
185.94
0
0
32.825 1929.84
0
0
0
2231.24
0
0
4103.13 1645.83
0
0
0
-2033.11
10
0
1.72786 15.3868
0
0
0
185.94
0
0
34.91
1923.35
0
0
0
2231.24
0
0
4363.75
0
0
0
-2033.11
1
0
4.75174
6
0
27.2356
7.005
0
107.17
0
12.1075 564.51
0
1651.07 663.038
0
588.85
0
1118.82 564.51
0
-219.28
-628.69
0
2
0
5.87544
6
0
27.2356
7.005
0
0
0
10.9189 564.51
0
1651.07 663.038
0
0
0
1008.75 564.51
0
-219.28
-628.69
0
3
0
3.48554
6
0
25.5087
7.005
0
4.47
0
10.9189 564.51
0
1390.98 663.038
0
3.79
0
1008.75 564.51
0
-223.96
-628.69
0
4
0
3.48432
6
0
26.2386
7.005
0
5.435
0
10.9189 564.51
0
1381.52 663.038
0
215.23
0
1008.75 564.51
0
-215.14
-628.69
0
5
0
3.48554
6
0
28.5983
7.005
0
7.23
0
10.9189 564.51
0
1493.35 663.038
0
368.903
0
1008.75 564.51
0
-201.98
-628.69
0
6
0
3.48311
6
0
28.002
7.005
0
8.975
0
10.9189 564.51
0
1397.27 663.038
0
474.038
0
1008.75 564.51
0
-167.37
-628.69
0
7
0
3.48675
6
0
23.46
7.005
0
11.18
0
10.9189 564.51
0
1139.08 663.038
0
629.23
0
1008.75 564.51
0
-156.58
-628.69
0
8
0
3.48554
6
0
17.88
7.005
0
12.7533
0
10.9189 564.51
0
681.277 663.038
0
726.515
0
1008.75 564.51
0
-125.45
-628.69
0
9
0
0
34.441
8.4
32.4585 10.4725
0
0
0
0
2741.94 803.517 2844.12 859.315
0
0
0
0
2650.08 409.091
-1044.7
-654.92
0
10
0
0
31.7736
8.4
32.4585
0
0
0
0
2528.34 803.517 2844.12
0
0
0
0
2444.13 409.091
-1044.7
-492.27
0
0
2
0
0
3
0
0
4
0
5
1
8
4.75973 15.5508
2
1
No. User 2
20
8
PER_MTD
2
0
7
User 7
PER_DD
2
0
No. User 2
PER_MAD 1 90
1
0.57595 15.5444
7.09
AVXD
654.8
AVYD
1650
ATVD
Prob. (%)
Other Prob. (%)
4945.01 90.0133
0.23412
6
7
8
1
2
3
4
5
6
7
8
1
2
3
4
5
6
7
1
0
0
4750
-856.481
0
0
0
910.596
0
0
1375
1943.06
0
0
0
2231.27
0
0
2
0
0
0
-830.357
0
0
0
910.596
0
0
0
1971.98
0
0
0
2231.27
0
0
0
80.4819
0.8928
3
0
0
0
-776.786
0
0
0
910.596
0
0
0
1905.02
0
0
0
2231.27
0
0
0
89.2275
0.12969
4
0
0
0
-736.607
0
0
0
910.596
0
0
0
1883.98
0
0
0
2231.27
0
0
0
89.2275
0.12969
5
0
0
0
-691.964
0
0
0
910.596
0
0
0
1882.67
0
0
0
2231.27
0
0
0
89.2275
0.12969
6
0
0
0
-676.724
0
0
0
1816.67
0
0
0
1930.15
0
0
0
4362.88
0
0
0
89.5076
25.8388
7
0
0
0
-662.5
0
0
0
0
0
0
0
1986.93
0
0
0
0
0
0
0
1.39453
72.4951
8
0
0
0
-604.167
0
0
0
0
0
0
0
1988.04
0
0
0
0
0
0
0
1.39453
17.0877
9
0
0
3906.25 -947.917
0
0
0
910.596
0
0
1250
1929.83
0
0
0
2231.27
0
0
4103.22 82.0799
0.05645
10
0
0
4166.67
0
0
0
910.596
0
0
1291.67 1923.35
0
0
0
2231.27
0
0
4363.85 62.5346
0.16893
-920
8
Average: User 7
67.51
11.72
1
-379.12
0
1108.54
0
0
-1630
-185.99
0
450.549
0
141.385
564.51
0
1651
663.088
0
588.836
0
1118.87 2.06488
1.96E-04
2
0
0
995.472
0
0
-1630
-185.99
0
0
0
135.777
564.51
0
1651
663.088
0
0
0
1008.83 99.6566
7.74828
3
-1.6978
0
995.472
0
0
-1367.8
-185.99
0
3.39559
0
135.777
564.51
0
1390.92 663.088
0
3.79638
0
1008.83 99.8521
0.56022
4
-134.18
0
995.472
0
0
-1359.2
-185.99
0
168.364
0
135.777
564.51
0
1381.5 663.088
0
215.336
0
1008.83 41.8488
0.01335
5
-214.46
0
995.472
0
0
-1477.8
-185.99
0
299.743
0
135.777
564.51
0
1493.28 663.088
0
368.904
0
1008.83 99.4266
0.8948
6
-285.84
0
995.472
0
0
-1385.9
-185.99
0
377.585
0
135.777
564.51
0
1397.25 663.088
0
474.076
0
1008.83 28.5048
0.00917
7
-378.67
0
995.472
0
0
-1127.1
-185.99
0
502.068
0
135.777
564.51
0
1139.02 663.088
0
629.261
0
1008.83
0.28892
8
-443.01
0
995.472
0
0
-669.49
-185.99
0
575.253
0
135.777
564.51
0
681.198 663.088
0
726.497
0
1008.83 0.11765
9
0
0
0
-458.03
-672.73
-2541.6
-555.71
0
0
0
0
2741.98 803.606 2844.13 859.347
0
0
0
10
0
0
0
-423.38
-672.73
-2541.6
-431.42
0
0
0
0
2528.36 803.606 2844.13
0
0
0
654.95
33.378
1.23196
0
99.091
4.88E-08
0
88.0621
1.44E-06
Average:
59.20
1.07
74 5.6.4
User Site Actions Profile
User site action data correspond to characteristics of the actions performed by the user while visiting a website. Examples of actions include browsing web pages and logins. Features such as action frequencies and the time of performing actions are extracted from the raw data. The user site action Bayesian network is built based on these attributes. The amount of site action data is very limited compared to the amount of keystroke and mouse data collected. Consequently this has a negative impact on the training data used to build the profiles. Figure 5.5 shows two Bayesian network structures for User 2 and User 7. Table 5.5 lists some examples of user site action records for User 2 and User 7. IsAuthorized
AAG
ATF
AAT1
AAT2
AAT5
AAF2
AAF1
AAF4
AAF2
AAT4
AAF3
AAT3
(a) User 2 IsAuthorized
AAG
AAT2
AAF2
AAT4
AAF4
AAF3
ATF
AAT3
AAF1
AAT1
AAT5
AAF5
(b) User 7
Figure 5.5. User site action Bayesian networks for two different users: User 2 and User 7
75 Table 5.5. Examples of site action records for two different users: User 2 and User 7 No. User 2
User 7
5.7
ATF
AAF 1
2
3
AAT 4
5
1
2
3
4
5
AAG
Prob. (%)
Other Prob. (%)
1
0
0
0
0
0
0
0
0
0
0
0
0
1.061222
0.565389
2
7.5
0
0
0
0.06
0
0
0
0
16
0
16
1.653376
2.43E-04
3
1.13
0
0
0
0
0.01
0
0
0
0
143
79.5
20.75308
0.45063
4
1.05
0
0.01
0
0
0
0
70
0
0
0
76.33
63.45466
0.380845
5
0.88
0
0.02
0
0
0
0
57.5
0
0
0
68.5
65.45532
0.003379
6
0.64
0
0.01
0
0
0
0
72.33
0
0
0
75.2
96.95425
0.380845
7
0.61
0
0
0
0
0
0
0
0
0
0
66
1.615414
0.001397
8
0
0
0
0
0
0
0
0
0
0
0
0
1.061222
0.565389
9
2.86
0
0
0
0.02
0
0
0
0
42
0
42
15.39069
9.512523
10
0.83
0
0
0
0
0.01
0
0
0
0
176
109
5.705983
0.01548
Average:
27.31
1.19
0
0
0.565389
1.061222
1
0
0
0
0
0
0
0
0
0
0
2
0.57
0
0
0
0
0
0
0
0
210
0
210
53.09854
10.23546
3
0.26
0
0
0
0
0
0
0
0
0
478
344
20.84651
0.32221
4
0.3
0
0.01
0
0
0
0
110
0
0
0
266
16.42911
28.6257
5
0.33
0
0
0.01
0
0
0
0
107
0
0
226.25
83.46247
0.736496
6
0.31
0
0
0.01
0
0
0
0
85
0
0
193.6
83.46247
13.48072
7
0.28
0
0
0.01
0
0
0
0
97
0
0
181.5
15.21719
13.48072
8
0.23
0
0
0.01
0
0
0
0
125.75
0
0
185.86
17.99042
0.736496
9
0.22
0
0
0.01
0
0
0
0
109.8
0
0
168.38
15.21719
0.736496
10
0
0
0
0
0
0
0
0
0
0
0
0
0.565389
1.061222
Average:
30.69
7.05
Testing Results
As discussed in previous sections, our proposed system involves three types of data, keystroke dynamics, mouse dynamics, and user site actions. Each test user contributed various numbers of sessions of genuine data and attack data. After enrolling the user separately for the three types of data, a fusion method was applied on the three outputs or a subset of the three outputs. For example, if there are two valid outputs for keystroke dynamics and mouse dynamics, the fusion method is applied on these two outputs. If the number of outputs is three, then the fusion method is applied on all three outputs. The outcome of the fusion is a similarity ratio computed for every session. Keystrokes, mouse actions, and user site actions are collected from a total of 24 test users. Due to limited numbers of sessions contributed by some test users, the total number of users having enough data for enrolment is 12; these users represent our legal users in calculating FAR and FRR. The break down of the above legal users for the different types of data is as follows:
76 5.7.1
Keystroke dynamics: 10 users Mouse dynamics: 11 users User site actions: 7 users Individual Results
We evaluate the performance of each type of data for each user separately. Averaging users’ FRR and FAR yield the overall FRR and FAR for that specific type of data. Tables 5.6 – 5.8 display individual performance results corresponding to each of the three types of data by varying the threshold. Table 5.6. FRR/FAR results for keystroke dynamics while varying the threshold Threshold (%) FAR (%) FRR (%)
0.00 96.00 0.00
5.00 49.42 0.00
10.00 32.92 3.33
15.00 30.92 5.83
20.00 25.25 10.93
25.00 25.25 14.52
30.00 20.67 38.62
35.00 8.67 46.76
40.00 7.00 49.04
45.00 7.00 55.48
Threshold (%) FAR (%) FRR (%)
55.00 5.33 66.68
60.00 3.67 72.27
65.00 3.67 79.36
70.00 2.00 82.69
75.00 2.00 85.19
80.00 2.00 88.46
85.00 2.00 88.72
90.00 0.00 95.06
95.00 0.00 98.33
100.00 0.00 100.00
50.00 7.00 56.99
Table 5.7. FRR/FAR results for mouse dynamics while varying the threshold Threshold (%) FAR (%) FRR (%)
0.00 100.00 0.00
5.00 53.99 2.50
10.00 34.33 7.50
15.00 21.71 23.38
20.00 16.97 33.99
25.00 7.58 46.25
30.00 6.06 64.06
35.00 4.55 73.64
40.00 4.55 80.00
45.00 0.00 88.30
Threshold (%) FAR (%) FRR (%)
55.00 0.00 90.68
60.00 0.00 90.91
65.00 0.00 92.73
70.00 0.00 92.73
75.00 0.00 96.36
80.00 0.00 100.00
85.00 0.00 100.00
90.00 0.00 100.00
95.00 0.00 100.00
100.00 0.00 100.00
50.00 0.00 89.32
Table 5.8. FRR/FAR results for user site action while varying the threshold Threshold (%) FAR (%) FRR (%)
0.00 100.00 0.00
5.00 13.47 67.07
10.00 5.05 74.62
15.00 2.20 75.71
20.00 2.20 75.71
25.00 2.20 75.71
30.00 2.20 85.71
35.00 0.00 92.86
40.00 0.00 100.00
45.00 0.00 100.00
Threshold (%) FAR (%) FRR (%)
55.00 0.00 100.00
60.00 0.00 100.00
65.00 0.00 100.00
70.00 0.00 100.00
75.00 0.00 100.00
80.00 0.00 100.00
85.00 0.00 100.00
90.00 0.00 100.00
95.00 0.00 100.00
100.00 0.00 100.00
50.00 0.00 100.00
77 Figure 5.6 displays the corresponding Receiver Operating Characteristic (ROC) Curves. A ROC Curves plots the FAR against the FRR while varying the thresholds; this provides a depiction of the performance of a model at various thresholds.
(a) Keystroke Dynamics (EER 24.78%)
(b) Mouse Dynamics (EER 22.41%)
(c) User Site Action (EER 49.2%)
Figure 5.6. ROC curves for each of the three types of data
78 The curves in Figure 5.6 show a trend that FRR decreases while FAR increases. The proposed models for the three types of data tend to have a high false acceptance rate when a threshold is set to allow low false rejection rates. The optimum performance point for the system is obtained at the equal error rate (EER) point where the FAR and FRR are the equal. Therefore, the lower the EER, the better the system performance. Among all three types of data, mouse dynamics has the lowest equal error rate (EER) at 22.41%.User site action has the highest EER at 49.2%, while keystroke dynamics has the EER at 24.78%. Compared to behavioural biometrics such as keystroke dynamics and mouse dynamics, user site action behavioural patterns are not well representing behavioural characteristics because of the following reasons. First, we had collected very low entries of user site actions. The records used in training were limited. Therefore, the trained Bayesian network does not well represent user’s characteristics. Second, it is easy for a user to change his site action behaviour patterns. For example, a user might perform browsing actions more often during the enrolment stage. In verification stage, the user might post comments more often, because he is interested in his friend’s comments. This lowers the probability in the verification. Third, it is easier for attackers to copy the target user’s behaviour pattern by performing similar site actions. Keystrokes and mouse actions are more difficult to forge without using special tools to copy and perform similar actions. We believe that a user’s web site behaviour pattern might be consistent in a long time period where more data can be collected. This was not verified in our experiment due to short experimental time period.
79 5.7.2
Mouse and Keystroke Fusion
In this section, we test the system performance by combining keystroke dynamics and mouse dynamics using Bayesian fusion method. We focus on these two modalities because the EER of user site action (49.2%) is much higher than the EER of keystroke dynamics (24.78%) and the EER for mouse dynamics (22.41%). Table 5.9 shows the FRR/FAR, and Figure 5.7 shows the corresponding ROC curve. The overall EER is 8.21%. This is much lower than either the EER of keystroke dynamics or the EER of mouse dynamics alone.
Table 5.9. FRR/FAR results by combining keystroke dynamics and mouse dynamics Threshold (%) FAR (%) FRR (%)
0.00 97.42 0.00
5.00 8.21 6.58
10.00 4.17 17.04
15.00 4.17 28.21
20.00 1.39 39.89
25.00 0.00 44.73
30.00 0.00 63.34
35.00 0.00 70.70
40.00 0.00 72.57
45.00 0.00 75.07
Threshold (%) FAR (%) FRR (%)
55.00 0.00 82.22
60.00 0.00 87.36
65.00 0.00 89.97
70.00 0.00 92.74
75.00 0.00 92.74
80.00 0.00 95.24
85.00 0.00 95.97
90.00 0.00 98.96
95.00 0.00 99.48
100.00 0.00 100.00
Figure 5.7. ROC curve for keystroke dynamics and mouse dynamics fusion
50.00 0.00 76.53
80
In order to measure the margin of errors, we used the method proposed by Bengio and Mariethoz to calculate the confidence interval (CI) [58]. The method uses the half total error rate (HTER) which is the sum of FAR and FRR divided by 2. The CI is calculated as follows: , where NI – the number of imposter accesses, NC – the number of genuine accesses. The value of
corresponds to the margin of error. We estimate the threshold for
EER is at 5.95%, and then we calculate the HTER and the CI based on the fusion scores for each user. We obtain the results listed in Table 5.10: Table 5.10. Average margin of errors for combining keystroke dynamics and mouse dynamics at threshold 5.95% 90% 95% 99%
5.7.3
1.645 1.960 2.576
HTER 0.079692 0.079692 0.079692
0.044811 0.044811 0.044811
0.073714 0.087829 0.115432
0.153405 0.167521 0.195124
0.005978 0 0
Combining All Three Modalities
In this section, we present performance obtained by combining all three modalities. The same fusion method is applied on the three outputs. Table 5.11 shows the FRR/FAR obtained by varying the threshold, and Figure 5.8 shows the corresponding ROC curve. The overall EER is 6.91% which is a slight improvement over the previous result.
81 Table 5.11. FRR/FAR obtained by combining all three modalities Threshold (%) FAR (%) FRR (%)
0.00 97.42 0.00
5.00 1.39 28.26
10.00 0.00 34.63
15.00 0.00 43.19
20.00 0.00 53.29
25.00 0.00 56.98
30.00 0.00 73.09
35.00 0.00 79.72
40.00 0.00 81.39
45.00 0.00 83.58
Threshold (%) FAR (%) FRR (%)
55.00 0.00 86.53
60.00 0.00 91.67
65.00 0.00 93.75
70.00 0.00 95.14
75.00 0.00 95.14
80.00 0.00 97.22
85.00 0.00 97.22
90.00 0.00 100.00
95.00 0.00 100.00
100.00 0.00 100.00
50.00 0.00 84.62
Figure 5.8. ROC curve obtained by combining all three modalities
We did the same error analysis and obtained the following confidence intervals while we estimate the threshold is at 0.28% for all users. Table 5.12. Average margin of errors for combining all three modalities at threshold 0.28% 90% 95% 99%
1.645 1.960 2.576
HTER 0.057971 0.057971 0.057971
0.030394 0.030394 0.030394
0.049999 0.059573 0.078296
0.107969 0.117544 0.136266
0.007972 0 0
As depicted in Table 5.10 and Table 5.12, the margin of errors decreases after combining user site action data at the EER points.
82 5.7.4
Discussions
The fusion of the three modalities yields an overall EER that is far lower than the EER obtained for each of the individual modality, and only slightly lower than the EER obtained by combining mouse and keystroke. This shows that the user site action has a limited impact on the overall performance. By comparing Table 5.9 and Table 5.10, we can see that the FAR drops quickly when we consider user site actions. For instance, the FAR is 4.17% in the first test when the threshold is 10.00%, while the FAR in the second test is 0.0% at the same threshold level. We used most of the records in building Bayesian network profiles. Therefore, the remaining site action records used in FRR tests are limited. Some users do not have site action FRR test results. There are several possible reasons that the overall EER is not as low as the EER results in the studies mentioned in the related work chapter: 1. The experiment environment is open. Test users are free to choose their own devices, which include PCs, laptops, and handheld devices. The client side browsers are different from each other, which included Internet Browser, Firefox, and browsers for handheld devices. The way users enter keys and use mice are also free. Test users use their own input devices, including touch screen of handheld devices. Since there were no restrictions in the test environment, the collected raw data contained a lot of noise that is hard to reduce effectively. However, this reflects better real world operating environments. 2. The number of valid user site action sessions is much lower than the mouse dynamics and keystroke dynamics ones. This was due to the limited amount of
83 actions performed by the test users. This affected the performance of user site action Bayesian network model. As a result, it did not contribute significantly in improving the overall performance. This again reflects typical usage scenario in web environments. 3. Due to the limited number of keystroke data collected on the experimental website, the number of records used for training was limited. Therefore, this has affected the performance of keystroke dynamics Bayesian network model. Comparing the first test result (EER at 8.21%) and the second one (EER at 6.91%), we can see that the performances with or without considering user site actions are close. In the cases that the target website does not involve a lot of site actions, we still can implement the approach that combines keystroke dynamics and mouse dynamics as an alternative. 5.8
Summary
This chapter presented our experimental evaluation for our proposed system. We described the experimental website, the instructions for test users, and the experiment environment. For each type of data, we evaluated the performance of the Bayesian network model. We then combined keystroke dynamics and mouse dynamic with user site action data by applying Bayesian fusion method. The performance before and after applying the fusion method were compared in this chapter. The overall performance yields an EER at 6.91%, which is improved compared with single biometric system.
84
Chapter 6
6.1
Conclusion
Summary
In this thesis, we presented a risk-based authentication system for web environments that combines mouse dynamics biometric, keystroke dynamics biometrics, and user site actions using Bayesian network models. Web environments are characterized by the limited amount of keystrokes and mouse actions involved in typical sessions. This makes detection hard, especially for free samples produced without any predefined baseline. Our proposed approach achieves an EER of 6.91%, which is encouraging. Risk-based authentication can be applied from two different perspectives: proactively and reactively. When applied proactively, risk-based authentication can be integrated with the login process and used to block from the beginning access to users flagged as risky. In contrast, reactive risk-based authentication can be used to identify and revert ongoing or completed transactions considered as risky. Although proactive risk-based authentication may be considered as more desirable than reactive risk-based authentication, the cost of a misclassification error is far greater in the former than the latter. In other words, more stringent accuracy requirements underlie proactive approaches compared to reactive ones. Actually, each category is adequate for specific scenarios. While proactive risk-based authentication is important in situations where confidentiality is essential such as in military or intelligence transactions, reactive risk-based authentication may be enough in situations when integrity is the primary concern. For instance, in online banking
85 transactions, malicious transactions (e.g., illegal transfer between accounts) can be reverted (immediately) by the end of the session if the user is classified as risky. As shown above, the experimental evaluation of our proposed risk-based authentication scheme yields an EER of 6.91%. Although such performance can be considered low for proactive risk-based authentication, we believe it is adequate for reactive risk-based authentication. In this case, the goal is not to prevent the user from using the system, but rather to identify malicious sessions and trigger appropriate risk mitigation measures. 6.2
Future Work
There are several tasks that we intend to tackle in the future. Firstly, we intend to investigate alternative models for keystroke biometrics and mouse biometrics. For example, re-sampling techniques, dynamic Bayesian network models, and neural network models could be used to improve system performance. Secondly, web behaviour is another direction we intend to investigate. For example, user behaviour characteristics, such as clicking areas on web pages, clicking frequencies on links or text, visit duration per web page, web page browsing sequence, are proposed in related work [54] and [55]. We plan to investigate techniques used in this direction that could improve the performance of user site action model proposed in this work. Thirdly, we plan to investigate the impact of alternative new computing devices on the performance of our proposed model. These include handheld devices such as iPad, iPhone, and Playbook.
86
Bibliography [1] M. Bishop, Computer Security: Art and Science, Boston: Addison Wesley, 2003 [2] S. E. Raj, and A. T. Santhosh, A behavioral biometric approach based on standardized resolution in mouse dynamics, International Journal of Computer Science and Network Security (IJCSNS), vol. 9 no. 4, pp. 370-377, 2009 [3] A. A. E. Ahmed and I. Traore, A new biometric technology based on mouse dynamics, IEEE Transactions on Dependable and Secure Computing, vol. 4, no. 3, pp. 165-179, 2007 [4] K. Revett, H. Jahankhani, S. T. Magalhães, and H. M.D. Santos, A survey of user authentication based on mouse dynamics, Global E-Security 4th International Conference (ICGeS 2008), Communications in Computer and Information Science, vol. 12, pp. 210-219, 2008 [5] C. Shen, Z. Cai, X. Guan, H. Sha, and J. Du, Feature analysis of mouse dynamics in identity authentication and monitoring, IEEE International Conference on Communications (ICC 2009), pp. 1-5, 2009 [6] F. Bergadano, D. Gunetti, and C. Picardi, User authentication through keystroke dynamics, ACM Transactions on Information and System Security, vol. 5, no. 4, pp. 367-397, 2002. [7] S. Mandujano and R. Soto, Deterring password sharing: user authentication via fuzzy c-means clustering applied to keystroke biometric data, In Proceedings of the Fifth Mexican International Conference in Computer Science (ENC 2004), pp. 181-187, 2004 [8] S. Hocquet, J. Ramel, and H. Cardot, Fusion of methods for keystroke dynamic authentication, Fourth IEEE Workshop on Automatic Identification Advanced Technologies (2005), pp. 224-229, 2005 [9] L. C. F. Araujo, L. H. R. Sucupira Jr., M. G. Lizarraga, L. L. Ling, and J. B. T. Yabu-Uti, User authentication through typing biometrics features, IEEE Transactions on Signal Processing, vol. 53, no. 2, pp. 851-855, 2005 [10] S. Hwang, H. Lee, and S. Cho, Improving authentication accuracy of unfamiliar passwords with pauses and cues for keystroke dynamics-based authentication, Expert Systems with Applications: An International Journal, vol. 36, no. 7, pp. 10649-10656, 2009 [11] W. Chang, Reliable keystroke biometric system based on a small number of keystroke samples, Emerging Trends in Information and Communication Security, International Conference, (ETRICS 2006), LNCS, pp. 312-320, 2006
87 [12] J. Lee, S. Choi, and B. Moon, An evolutionary keystroke authentication based on ellipsoidal hypothesis space, In Proceedings of the 9th Annual Conference on Genetic and Evolutionary Computation (GECCO 2007), pp. 2090-2097, 2007 [13] C. Jiang, S. Shieh, and J. Liu, Keystroke statistical learning model for web authentication, In Proceedings of the 2nd ACM Symposium on Information, Computer and Communications Security (ASIACCS 2007), pp. 359-361, 2007 [14] J.Hu, D. Gingrich, and A. Sentosa, A k-nearest neighbor approach for user authentication through biometric keystroke dynamics, IEEE International Conference on Communications (ICC 2008), pp. 1556-1560, 2008 [15] D. Wawrzyniak, Information security risk assessment model for risk management, Trust and Privacy in Digital Business, Third International Conference (TrustBus 2006), LNCS, pp. 21-30, 2006 [16] A. Rot, IT risk assessment: quantitative and qualitative approach, In Proceedings of the World Congress on Engineering and Computer Science (WCECS 2008), pp. 1073-1078, 2008 [17] L. Teo, G. Ahn, and Y. Zheng, Dynamic and risk-aware network access management, In Proceedings of the Eighth ACM Symposium on Access Control Models and Technologies (SACMAT 2003), pp. 217-230, 2003 [18] P. Cheng, P. Rohatgi, C. Keser, P.A. Karger, G. M. Wagner, and A. S. Reninger, Fuzzy multi–level security: an experiment on quantified risk–adaptive access control, IEEE Symposium on Security and Privacy (SP 2007), pp. 222-230, 2007 [19] N. Tuptuk and E. Lupu, Risk based authorisation for mobile ad hoc networks, In Proceedings of the 1st International Conference on Autonomous Infrastructure, Management and Security: Inter-Domain Management (AIMS 2007), pp. 188-191, 2007 [20] N. N. Diep, S. Lee, Y. Lee, and H. Lee, Contextual risk-based access control, In Proceedings of the 2007 International Conference on Security Management (SAM 2007), pp. 406-412, 2007 [21] M. Pusara and C. E. Brodley, User re-authentication via mouse movements, In Proceedings of the 2004 ACM Workshop on Visualization and Data Mining for Computer Security (VizSEC/DMSEC 2004), pp. 1-8, 2004 [22] P. Bours and C. J. Fullu, A login system using mouse dynamics, Fifth International Conference on Intelligent Information Hiding and Multimedia Signal Processing (IIH-MSP 2009), pp. 1072-1077, 2009 [23] B. Roy and PH. Vincke, Relational system of preference with one or more pseudocriteria: some new concepts and results, Management Science, vol. 30, no. 11, pp. 1323-1335, 1984
88 [24] Y. Aksari and H. Artuner, Active authentication by mouse movements, 24th International Symposium on Computer and Information Sciences (ISCIS 2009), pp. 571-574, 2009 [25] R. E. Neapolitan, Learning Bayesian Networks, Northeastern Illinois University, Chicago, Illinois: Prentice Hall, 2004 [26] H. P. In, Y. Kim, T. Lee, C. Moon, Y. Jung, and I. Kim, A security risk analysis model for information systems, In Proceedings of 3rd Asian Simulation Conference (AsiaSim 2004), LNCS, vol. 3398, pp. 505-513, 2004 [27] O. K. Hussain, E. Chang, F. K. Hussain, and T. S. Dillon, A fuzzy approach to risk based decision making, On the Move to Meaningful Internet Systems (OTM 2006), LNCS, vol. 4278, pp. 1765-1775, 2006 [28] P. Wang, K. Chao, C. Lo, C. Huang, and M. Younas, A fuzzy outranking approach in risk analysis of web service security, Cluster Computing, vol. 10, no. 1, pp. 4755, 2007 [29] F. Herrera, E. Herrera-Viedma, and J.L. Verdegay, A rational consensus model in group decision making using linguistic assessments, Fuzzy Sets and Systems, vol. 88, no. 1, pp. 31-49, 1997 [30] H. Jin, J. Sun, H. Chen, and Z. Han, A risk-sensitive intrusion detection model, In Proceedings of the 5th International Conference on Information Security and Cryptology (ICISC2002), pp. 107-117, 2003 [31] M. D. Aime, A. Atzeni, and P. C. Pomi, AMBRA: automated model-based risk analysis, In Proceedings of the 2007 ACM Workshop on Quality of Protection (QoP 2007), pp. 43-48, 2007 [32] Y. Kim, S. Cho, J. Lee, M. Lee, I. H. Kim, and S. H. Kim, Method for evaluating the security risk of a website against phishing attacks, In Proceedings of the IEEE ISI 2008 PAISI, PACCF, and SOCO International Workshops on Intelligence and Security Informatics (PAISI, PACCF and SOCO 2008), pp. 21-31, 2008 [33] T. Dimitrakos, B. Ritchie, D. Raptis, and K. Stølen, Model based security risk analysis for web applications: The CORAS approach, In Proceedings of the EuroWeb (2002), 2002 [34] N. Jin and M. Fei-Cheng, Network security risks in online banking, International Conference on Wireless Communications, Networking and Mobile Computing (2005), vol. 2, pp. 1229-1234, 2005 [35] S. Y. K. Mo, P. A. Beling, and K. G. Crowther, Quantitative assessment of cyber security risk using Bayesian Network-based model, Systems and Information Engineering Design Symposium (SIEDS 2009), pp. 183-187, 2009
89 [36] A. ˚Arnes, K. Sallhammar, K. Haslum, T. Brekne, M. E. G. Moe, and S. J. Knapskog, Real-time risk assessment with network sensors and intrusion detection systems, In Computational Intelligence and Security International Conference (CIS 2005), LNCS, vol. 3802, pp. 388-397, 2005 [37] G. Tubin, Emergence of Risk-Based Authentication in Online Financial Services: You Can't Hide Your Lyin' IPs, Whitepaper #V43:15N, TowerGroup, 2005 [38] N. Dimmock, J. Bacon, D. Ingram, and K. Moody, Risk models for trust-based access control (TBAC), Trust Management, Third International Conference (iTrust 2005), LNCS, vol. 3477, pp. 11-12, 2005 [39] G. Brændeland and K. Stølen, Using risk analysis to assess user trust – a net-bank scenario, Trust Management, Second International Conference (iTrust 2004), LNCS, vol. 2995, pp. 146-160, 2004 [40] J. Ma, K. Adi, M. Mejri, and L. Logrippo, Risk analysis in access control systems, 2010 Eighth Annual International Conference on Privacy Security and Trust (PST), pp. 160-166, 2010 [41] G. F. Cooper and E. Herskovits, A Bayesian method for the induction of probabilistic networks from data, Machine Learning, vol. 9, no. 4, pp. 309-347, 1992 [42] P. Tan, M. Steinbach, and V. Kumar, Introduction to Data Mining, Boston, MA, USA: Addison Wesley, 2005 [43] P. S. Dowland and S. M. Furnell, A long-term trial of keystroke profiling using digraph trigraph and keyword latencies, In IFIP 18th World Computer Congress TC1119th International Information Security Conference, IFIP International Federation for Information Processing, vol. 147, pp. 275-289, 2004 [44] N. Friedman, D. Geiger, and M. Goldszmidt, Bayesian network classifiers, Machine Learning - Special Issue on Learning with Probabilistic Representations, vol. 29, no. 2-3, pp. 131-163, 1997 [45] U. M. Fayyad and K. B. Irani, Multi-interval discretization of contiuous-valued attributes for classification learning, Proceedings of the International Joint Conference on Uncertainty in Artificial Intelligence (IJCAI 1993), pp. 1022-1027, 1993 [46] D. Gunetti and C. Picardi, Keystroke analysis of free text, ACM Transactions on Information and System Security (TISSEC), vol. 8, no. 3, pp. 312-347, 2005 [47] H. Gamboa and A. Fred, A user authentication technic using a web interaction monitoring system, In Pattern Recognition and Image Analysis, LNCS, pp. 246254, 2003
90 [48] H. Gamboa and V. Ferreira, WIDAM – web interaction display and monitoring, Proceeding of 5th International Conference on Enterprise Information Systems, (ICEIS 2003), pp. 21-27, 2003 [49] A. Ahmed and N. Zhang, A context-risk-aware access control model for ubiquitous environments, International Multiconference on Computer Science and Information Technology (IMCSIT 2008), pp. 775-782, 2008 [50] J. Rissanen, An Introduction to the MDL Principle, 2006, available at http://www.mdl-research.org/jorma.rissanen/pub/Intro.pdf (last visited April 28, 2011) [51] J. A. Clark, J. E. Tapiador, J. McDermid, P. Cheng, D. Agrawal, N. Ivanic, and D. Slogget, Risk based access control with uncertain and time dependent sensitivity, In Proceedings of the 2010 International Conference on, Security and Cryptography (SECRYPT), pp. 1-9, 2010 [52] L. Krautsevich, A. Lazouski, F. Martinelli, and A. Yautsiukhin, Risk-based usage control for service oriented architecture, 2010 18th Euromicro International Conference on Distributed and Network-Based Processing (PDP), pp. 641-648, 2010 [53] I. Kononenko, On biases in estimating multi-valued attributes, In Proceedings of the 14th International Joint Conference on Artificial Intelligence (IJCAI 1995), vol. 2, pp. 1034-1040, 1995 [54] G. Velayathan and S. Yamada, Behavior-based web page evaluation, In Proceedings of the 16th International Conference on World Wide Web (WWW 2007), pp. 1317-1318, 2007 [55] T. Zhu, Clustering Web Users Based on Browsing Behavior, In Proceedings of the 6th International Conference on Active Media Technology (AMT 2010), pp. 530537, 2010 [56] R. R. Bouckaert, Bayesian network classfiers in Weka, University of Waikato, http://weka.sourceforge.net/manuals/weka.bn.pdf, 2004 (Last visited, April 28, 2011) [57] P. Cheng, P. Rohatgi, C. Keser, P. A. Karger, G. M. Wagner, and A. S. Reninger. Fuzzy multi–level security: an experiment on quantified risk–adaptive access control, IEEE Symposium on Security and Privacy (SP 2007), pp. 222-230, 2007 [58] S. Bengio and J. Mariéthoz, A statistical significance test for person authentication, In Proceedings of Odyssey 2004: The Speaker and Language Recognition Workshop (ODYS 2004), pp. 237-244, 2004