239 Water Science and Technology: Water Supply (2005), Vol.5, No.6, pp 95-104
USING BAYESIAN NETWORK MODELS TO INCORPORATE UNCERTAINTY IN THE ECONOMIC ANALYSIS OF POLLUTION ABATEMENT MEASURES UNDER THE WATER FRAMEWORK DIRECTIVE D.N. Barton, T. Saloranta, T.H. Bakken, A. Lyche Solheim, J. Moe, J.R. Selvik and N. Vagstad Norwegian Institute for Water Research (NIVA), Norway,
[email protected].
Abstract The evaluation of water bodies “at risk” of not achieving the Water Framework Directive’s (WFD) goal of “good status” begs the question of how big a risk is acceptable before a programme of measures should be implemented. Documentation of expert judgement and statistical uncertainty in pollution budgets and water quality modelling combined with Monte Carlo simulation and Bayesian belief networks, make it possible to give a probabilistic interpretation of “at risk”. Combined with information on abatement costs, a cost-effective ranking of measures based on expected costs and effect can be undertaken. Combined with economic valuation of water quality, the definition of “disproportionate cost” of abatement measures compared to benefits of achieving “good status” can also be given a probabilistic interpretation. Explicit modelling of uncertainty helps visualize where research and consulting efforts are most critical for reducing uncertainty. Based on data from the Morsa catchment in South-Eastern Norway, the paper discusses the relative merits of using Bayesian belief networks when integrating biophysical modelling results in the benefit-cost analysis of derogations and costeffectiveness ranking of abatement measures under the WFD. Keywords: Benefit-cost analysis; Disproportionate costs; Eutrophication; Programme of measures.
INTRODUCTION The Water Framework Directive (WFD) (EU, 2000) specifies a number of situations in which costeffectiveness (CEA) and benefit-cost analysis (BCA) are to be employed in evaluating and implementing a programme of measures whose ideal objective is the achievement of “good ecological” quality for water bodies in a river basin district (RBD). Basic measures under the WFD are understood as those currently under implementation or expected as part of existing pre-WFD legislation. For water bodies that do not achieve good status with “basic” measures it will be initially necessary to conduct a coarse CEA to determine whether proposed “supplementary” measures are sufficient to achieve “good status”, or conversely, determine the risk of non-compliance. Given uncertainty implicit in analyses involving multiple parameters predicted using multiple models, risk of non-compliance suggests the need for a probabilistic analysis. Good status is defined as a combination of physical-chemical and biological parameters, as well as ecological indices. An iterative process of analysis is required until a programme of measures is sufficient to achieve good status as defined by these criteria. A technically feasible programme of measures should be subjected to a benefit-cost analysis to determine whether costs are disproportionate to benefits (WATECO, 2000: WFD art. 4.5). If available measures are insufficient an objective derogation may be sought because costs are implicitly disproportionate to benefits (costs approach infinity). When there is uncertainty about objective compliance, ‘disproportionality’ is probabilistic by nature. In such cases, RBD managers could base the evaluation of disproportionality on whether or not expected benefits exceeded expected costs.
240
Bayesian belief networks have only recently been applied to handling of uncertainty in environmental and natural resource management (Varis and Kuikka, 1999). Borsuk et al. (2004) used belief networks to integrate a combination of process-based models, multivariate regressions and expert opinion of river eutrophication to predict probability distributions of policy-relevant ecosystem attributes. To our knowledge, Bayesian belief networks have not been applied to benefit-cost analysis of eutrophication abatement measures, nor in the context of the WFD. The present study demonstrates the use of Bayesian belief networks to deal with the integration of the physical-chemical-biological models required to predict good ecological status, combined with the costs and benefits of improvements in water quality resulting from the programme of measures in the Morsa catchment in South Eastern Norway.
CASE STUDY SITE DESCRIPTION The Morsa catchment, located in South-Eastern Norway, is perhaps one of the most studied eutrophied catchments in the country. It was the subject of a contingent valuation study of water quality improvements in 1994 and part of one of the first reliability tests of benefits transfer in Europe (Magnussen et al., 1995). It was the subject of a cost effectiveness analysis for nutrient abatement just prior to Norwegian implementation of the WFD (Lyche Solheim et al., 2001) and more recently was a demonstration site for water basin characterization under the WFD (Lyche Solheim et al. 2003). The demonstration project evaluated all the major water bodies in the catchment for their risk of not achieving good status by 2015. The evaluation of “risk” of non-compliance relative to this threshold was qualitative, rather than probabilistic. The Vannsjø-Storefjorden Lake has also been the subject of recent dynamic modeling of nutrient loading-concentrations using the model MyLake (Saloranta and Andersen, 2004). Consistent eutrophication monitoring data are available since 1997. The results of the costeffectiveness analysis carried out by Lyche Solheim et al. (2001) are given in Table 1. Table 1. Results of cost-effectiveness analysis of existing abatement plan for Morsa catchment (Lyche Solheim et al., 2001). Effect (kg red. Tot-P)
Cost/effect (kr./kg Tot-P)
Biofactor b
297-825
3,300
0.09-0.25
0.2
660
0.45-1.25
1
28-56
100-200
0.27
0.2
20-40
1.35
2
Sedimentation dams
730-1,700
1,300-1,700
0.49-1.13
0.2
260-340
2.44-5.67
4
Grassy water courses
-
-
-
-
-
-
1,055-2,580
4,700-5,200
10,431
1,531
6.8
Quantified measure
Cost/Yr (1000 kr)
Effect Cost/Effect Ranking (kg red. bio-P) (kr./kg bio-P)
Agriculture Plowing practices Vegetation zone
Total Agricult. Individual wwater
930-1,030 0.7
1,072
9.7
5
3
Municipal sewage Red. faulty connections
293-583
301
1.0-1.9
0.6
181
1.6-3.2
Red. spillover
-
109
-
0.6
65
-
Red. leakage municipal
-
104
-
0.6
62
-
Transfer of municipal Wastewater (today)
3500
67
52
0.3
20
175
7
Transfer of municipal wastewater (future)
3500
201
17
0.3
60
58
6
Total wastewater
ca. 4000
368
200
Total abatement
15,279-17,094
6,600-7,100
2,220-2,344
Note 1: calculated abatement need was 8,651 Tot-P/yr.
Changed plowing practices ranked as most cost-effective, while transferring wastewater to another watershed was ranked as least cost-effective as measured by the ratio of cost to kg bioavailable P
241
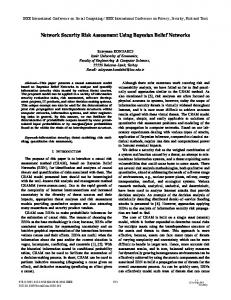
(cost/bio-P). The CEA ranks measures by “end-of-pipe” or “end-of-field” Tot-P loading multiplied by a bioavailability factor for the different sources. Taking the existing CEA of measures in the catchment as a starting point we will look here specifically at the Storefjorden Lake to illustrate the use of Bayesian networks for systematically dealing with uncertainty of attaining the objective of “good status” in the water body itself. As a first step to a quantitative evaluation of whether Storefjorden is ‘at risk’ of not attaining ‘good status’ we asked a number of experts to provide further probability distribution information on the effect of measures evident as simple min-max intervals in Table 1. Figure 1 illustrates a Monte Carlo simulation to account for uncertainty of abatement measure effectiveness in Lyche Solheim et al. (2001) and the abatement target calculations based on the formula by Larsen and Mercier (1976). The aggregate Tot-P loading reduction requirements for the Storefjorden Lake calculated at 8651 kg/yr for 2000 is actually only one point on a probability distribution if one takes into account historical variability in monitored P-concentrations and water flow used as input data in the Larsen and Mercier formula. Figure 1 shows that the probability of achieving the target given uncertainty is about 15%. Further abatement measures would obviously increase this probability. While this information is useful it does not answer the question whether the expected net benefits of achieving that 15% outweigh the expected net benefits of not doing so (85% probability), which should be the essence of the “test” of disproportional costs under the WFD. While this can be programmed or carried out in a spread-sheet model with Monte Carlo analysis, Bayesian networks add the advantage of object oriented modeling of the management problem, inductive sensitivity analysis and updating of initial beliefs (probability distribution) as new evidence becomes available.
Figure 1. Achieving “good status” expressed as a likelihood (Skiple Ibrekk et al., 2004).
METHODS AND DATA Bayesian belief networks (Olesen et al., 1992) offer an intuitive approach to the evaluating interdependent multiple water quality and use suitability criteria using available information from expert opinion, and modelling results regarding probability distributions of key input and output variables. Commercially available software (Hugin Expert: www.hugin.com) uses decision theory (Raifa, 1968) to optimize expected value of utility functions that are defined for decision alternatives (e.g. implementing measures versus no action). Using Bayes’ Law (eq. 1) prior beliefs may be updated with new evidence to calculate joint posterior probabilities. P(A B ) =
P (B A)P ( A) P (B )
(1)
242
This feature also allows managers to evaluate inductively e.g. which prior conditions (upstream Tot-P loadings) correspond to new evidence in end-points (e.g. ‘good status’ in ecological parameters). Underlying the ‘nodes’ of a belief network are conditional probability tables (CPT). CPTs can summarise the relationship between an input and output variable modelled in e.g. a dynamic eutrophication model linking Tot-P loading (input) to Tot-P concentration and Chlorophyll A concentrations. They can be made conditional on any parameters in these models that are deemed uncertain and should be subject to the gathering of new evidence (e.g. through sensitivity analysis, further modelling or monitoring data collection). CPTs are particularly useful as probabilistic information can represent non-linearities such as ecological thresholds or environmental standards. CPTs can take on a number of different standard distributional forms representing expert opinion, as well as empirical distributions resulting from bio-physical model simulations or even simple data correlations. Types of distributions used in our case study are shown in Figure 2.
Figure 2. Probability distributions.
The software Hugin Expert allows for inductive evaluation of uncertain variables. In a deductive spreadsheet-based non-linear model with uncertainty (Vose, 1996), Monte Carlo simulation would be required to evaluate the probability of achieving the environmental objective, while iterated optimisation routines would be required to find an optimal combination of measures. In Hugin Expert optimisation is carried out on the probability distributions in the network. It allows a manager to ask questions like ‘if only high blue-green algal concentrations are observed with high Chlorophyll A concentrations what does this imply for the optimal nutrient loading of abatement measures and expected utility of the implementation decisions in the network’. Traditional sensitivity analysis carried out in Excel would typically ask the question, ‘if the nutrient abatement of a measure is changed by x% how would this change the probability of achieving the target for blue-green algae and Chlorophyll A and the expected utility of the measure’. The main methodological steps and data used are summarised in Figure 3. Existing data was taken from Lyche Solheim et al. (2001) on abatement measures effectiveness on removing Tot-P and annual cost of measures. From Magnussen et al. (1995) we obtained mean household Willingness to Pay (WTP) for improvements in suitability of water in the Morsa catchment, with watershed population statistics coming from the Norwegian Bureau of Statistics. Additional drinking water treatment costs for dealing with high turbidity and algal blooms were obtained from consulting engineers (Interconsult, 2002). The MyLake model (Saloranta and Andersen, 2004) was run for hydrological and nutrient data for 19952000 generating CPTs for relationships between Tot-P-loading – Tot-P-concentrations – Chlorophyll A concentrations. Unpublished quantile regression results for an observed relationship between Chlorophyll A concentrations and blue-green algae proportions of total algal biomass were obtained from Tom Andersen and Jannicke Moe (NIVA) based on data reported in Lyche Solheim et al. (2004).
243
Figure 3. Methodology and data sources.
Some comments are needed on the available data versus data typically desired by economists for costeffectiveness and benefit-cost analysis. Whereas conceptual economic models often assume continuous differentiable marginal cost and benefit functions, natural phenomena when considered, are assumed also to be linear or at least continuous. In practice one finds a mixture of linear, non-linear and discontinuous functions that somehow must be integrated in the same quantitative model. Figure 4 provides a conceptual illustration for benefit-cost analysis of eutrophication in the Morsa catchment.
Figure 4. Conceptual illustration of diverse model results to be combined in a benefit-cost analysis of eutrophication abatement measures.
Abatement cost data was available as minimum-maximum ranges for total annual costs of measures. These could be associated with total annual nutrient abatement effects. No cost functions were readily available which would have permitted the calculation of marginal costs and incremental costeffectiveness evaluations. In effect, the cost-effectiveness analysis carried out by Lyche Solheim et al. (2001) compared these average costs across measures, in a simple stepwise cost function for total Tot-P abatement (upper right hand panel). In the demonstration of Bayesian network used here a simple functional relationship between cost and effects of each measure was furthermore assumed. The relationship between nutrient loading and algal biomass (Chlorophyll A) is non-linear and may display hysteresis depending on whether the lake is initially in a macrophyte-dominated, clear water state or in a
244
eutrophic algal-dominated state (lower right hand panel, Figure 4). The proportion of blue-green algae displays thresholds which may or may not match user suitability definitions based on traditional eutrophication parameters (lower left hand panel). Blue-green algae dominance and toxicity depend on a number of ecological factors that are as yet poorly understood and may in future introduce new nonlinearities and thresholds into the water management issues. Finally, mean WTP from contingent valuation surveys have at best valued WTP for a few alternative levels of user suitability, resulting in a stepwise function for benefits of abatement measures. In the hypothetical situation in Figure 4 the proposed programme of abatement measures is not sufficient to attain water quality suitable for swimming – abatement costs are disproportionate to the benefits to bathing and swimming. Figure 4 also illustrates that ‘traditional’ cost-effectiveness analysis has focused on “pressure” oriented objectives (Tot-P loading), while under the WFD “good ecological status” requires coupling this analysis to process-based modelling of the ‘state’ of the water body. Furthermore, evaluating the disproportionality of abatement costs requires including water user suitability criteria and the economic value of suitability in the integrated model.
Figure 5. Bayesian network model for benefit-cost analysis of individual measures.
The belief network for the benefit-cost analysis of nutrient abatement measures in the Morsa catchment and the Storefjorden Lake is illustrated in Figure 5. Underlying the ‘nodes’ of a belief network are the ‘chance nodes’ or conditional probability tables (CPT) (ovals), utility nodes (diamonds) expressing the value of outcomes, and decision nodes (squares) representing alternative courses of action. The reader will notice that a cluster of nodes is repeated, denominated as _0 and _1. The clusters represent probability distributions for the state of the water body in period 0 (before measures) and period 1 (after measures are implemented). In the model suitability depends on Tot-P and Chlorophyll A concentrations, as well as % of blue-green algae of total algal biomass. Benefits to bathing and avoided costs of water treatment processes depend on the state of these three suitability criteria in the model (a simplification which will be further detailed in future work).
245
RESULTS AND DISCUSSION The results of the optimised model shown in Figure 5 are presented in Figure 6. Model output is illustrated as a series of discrete distributions of the effects of a programme of upstream abatement measures on nutrient loading, water quality parameters and user suitability criteria. The vertical rows of numbers give the discrete probability (prob.) for each interval (value) of the node/variable in the belief network. Figure 6 is best interpreted by making pairwise comparisons of node values for period_0 (baseline, no actions) and period_1 (with measures). It illustrates that the programme of measures as a whole only has a marginal effect on suitability for bathing, the need for treatment for blue-green algae (with ozone) and for turbidity (represented by the proxy variable Tot-P concentration). These marginal effects in the water body and for water users are not sufficient to justify the programme of measures the expected value of “no action” exceeds the expected value of implementation for most measures. Table 2. Comparisons of ranking of measures. Lyche Solheim et al. (2001) Measures CEA
Belief network BCA
Plowing season
1
3
Buffer strips
2
1
Repair sewage pipe leakage
3
2
Sedimentation Dams
4
5
Individual waste water systems
5
4
By comparing the expected value of the implementation alternative for all measures we can conduct a ranking. Benefit-cost analysis using a Bayesian network ranks measures differently to the costeffectiveness analysis of Lyche Solheim et al. (2001), reversing some of the rankings (Table 2). The additional uncertainty regarding the effect of measures, as well as the correlation between cost and abatement effect introduced by us in the network is probably the cause of this difference. Work in progress involves developing standard ways of diagnosing the properties of these networks in the context of the WFD. According to expected net benefits only buffer strips should be implemented. The “no action” alternative for each of the other measures is assigned the expected value of buffer strips, leading all other measures to have lower expected value than buffer strips. This uncovers a feature in the model which must be interpreted in the context of the specific decision model evaluated. The order of decisions taken does not seem to affect the ranking of individual measures, but we are currently exploring other configurations of the decision process (square nodes in the network).
CONCLUSIONS Although the networks demonstrated here have an intuitive appeal they still have a number of weaknesses that we are working to improve. We expect the feasibility of the programme of measures is sensitive to the resolution of the models incorporated and that the discretisation intervals of the CPTs should be made finer, especially for the water quality parameters modeled by the dynamic lake eutrophication model MyLake. When this is improved we expect that the expected value of the programme will be very sensitive to the level of the threshold for suitability of water uses. For more realistic scenarios we will conduct a more detailed analysis of the transferability of WTP for water quality improvements, as existing estimates include all recreational uses of the Morsa basin, rather than strictly for bathing in the Storefjorden Lake. Further reflection is needed on the direction of the bias in transferring WTP estimates for a gain in water quality, to situations involving avoiding a loss of water use suitability. The same need for revision is true for the avoided costs of water treatment. We have not
246
considered any sunk costs of treatment, meaning that avoided costs of water quality improvements when baseline loadings are low, are probably a good deal higher than avoided costs when initial baseline loading is high, and treatment plant investments have already been made. Nutrient loading
Water quality
Effect of individual measures:
Aggregate effect:
Prob: Value:
Prob: Value:
User suitability and expected values of alternatives Prob: Value:
Expected value of alternatives:
Figure 6. Discrete probability distributions for nodes in the belief network and expected values of measures
Non-point abatement effects in agriculture were not scaled to the variation in background run-off thereby dampening the effectiveness of measures. Furthermore, the MyLake model does not predict TotP concentrations of