Intelligent User Interfaces: Modelling the User Marcus Rohrbach and Uwe Schmidt
[email protected] and
[email protected] Artificial Intelligence 1: CPSC 502 Computer Science University of British Columbia Intelligent User Interfaces: Modelling the User
Intelligent User Interfaces
Abstract
User Model
Current user interfaces are very complex with a large number of functions. Intelligent user interfaces try to help the users performing their tasks. We describe how (Horvitz et al. 1998) construct and created a user model to meet the different challenges which exist. Building on this, we first look how (Hui & Boutilier 2006) model the user’s features explicitly to suggest help based on the user’s state. Secondly, we explore how (Shen et al. 2006) predict the user’s current task.
Features, Needs
Observations
Structure of Intelligent UIs In general intelligent user interfaces are structured as shown in figure 1. We have a model of arbitrary complexity which observers the user interfaces, i.e. the user interaction with the computer. Based on prior knowledge (included in the model) and previous and current observations it decides how to adapt or affect the user interface for the user. A user model can consist of a large number of facets. We will discuss in this paper two of the most import ones in detail. On the one hand there are the users features and needs and on the other hand the user’s goals and tasks, i.e. what the user is doing and wants to achieve. First we will look on a more general approach on how to build user models. Then we will focus first on features and needs and then on goals and tasks.
affects
User Interface
Introduction Current user interfaces (UIs) are often “bloated” (McGrenere, Baecker, & Booth 2002) and user tasks are getting more complex and more complicated. In these cases artificial intelligence can help to reduce the “bloat” in user interfaces and assist the user. However, several challenges arise when adapting the user interface or providing help: Interpreting user’s activities and predicting goals correctly is very difficult because it is many faceted and the system has only a limited amount of observations. These consist normally of the user’s interaction with the interface. Additionally the decisions have to be made online in a timely manner. For these predictions a model has to be created in most cases. Here it is difficult to determine which variables depend on others and in which way they influence each other. Once a model is created, the model’s parameters have to be learned and in some cases missing data to complete the model is a further difficulty.
Goals Tasks
Artificial Intelligence 1 - Uwe Schmidt, Marcus Rohrbach -
2006-11-20
6
6
Figure 1: Relation of user model and user interface
User Modelling and Deducing Goals In this section we describe an approach how to model the user as outlined by Microsoft Research in the Lumi`ere Project (Horvitz et al. 1998).
Assistance history
Task history
User’s background
Context
User's goals
Competency profile User's acute needs
Documents & data structures
Cost of assistance
Automated assistance
Utility
Explicit query
User’s actions
Figure 2: Decision network to deduce whether help should be provided (Horvitz et al. 1998) Decision Network for Assistance. Horvitz et al. experimented with automated assistance, i.e. which information to present to the user, how and when to help the user reaching their goal. They built a decision network for deciding if the user should receive assistance. As shown in figure 2
the utility depends on the value of the automated assistance, the cost of the assistance due to interrupting the user, and the user’s acute needs. The latter one depends on variables, such as the user’s goals and the task history, and influences for example the user’s actions. A threshold defines if the utility is high enough to assist the user. Creating a Model. They set up a user study with a Wizard of Oz1 design to find out what is important when creating such a model. Subjects were asked to perform a certain task on a desktop computer and were told that they would receive help on a separate screen. Experts were placed in another room seeing only the subjects interface and the interaction of the subject with it. With these information they were asked to give help to the subjects by typing recommendations which were shown on the subjects second screen. Difficulty of current task
User expertise
User needs assistance
Recent menu surfing
Figure 4: Dynamic Bayesian Network to model goals depending on previous states; based on (Horvitz et al. 1998)
seen in figure 4 the goal depends on the previous goal, which again depends on previous instances of the variable goal. background However,User there might also be variables which remain constant over time, such as thePrimary usergoal profile, or variables which change over time but do not depend on their previous state, Hierarchical Pivot wizard suchChart aswizard observation, Consolidation shown as E in the figure. presentation
Pause after activity Repeated chart create/delete
Group mode Database defined
3D cell reference
User distracted Leading spaces
External reference Repeated chart change
Figure 3: Bayesian Network to model when assistance is needed (Horvitz et al. 1998)
Use query Multicell selection
Repeated print / hide Rows
Adjacent conceptual granularity
The experiment showed that it is possible to identify user goals and needs, but it is difficult. The experts did need some time of observation until they could predict more precisely what the user wants to do. Another major result was, that if incorrect or poor advice is given, a high cost is associated with that because users tried to follow that advice which in turn gave the expert a wrong confirmation. Additionally they were able to deduce a model when assistance is needed. Figure 3 displays a part of the relationships. On the one hand, whether the user needs assistance depends on features like the users expertise and the difficulty of the task. On the other hand the user’s needs influence the behaviour of the user, e.g. recent menu surfing or pausing after an activity show that they are not sure what to do. This can be observed and a system can infer if the user needs assistance. Time Dependency. The models described so far did not take into account that variables change over time and that they depend on previous states. For example the users’ goals change, because users change their tasks. Such behaviour can be modelled by a dynamic Bayesian network. It is able to model variables which change over time and depend on previous states, such as the goal in our example. As can be 1
man
Wizard of Oz design means that a system is emulated by a hu-
Figure 5: Lumi`ere Project: Excel Prototype (Horvitz et al. 1998) Lumi`ere Prototype vs. MS Office ’97 Assistant. A prototype for Microsoft Excel was created (figure 5) in the Lumi`ere project. In the prototype the previously discussed ideas were included. (Horvitz et al. 1998) did not state if and how the prototype was evaluated, but they discuss how Microsoft transferred some of these ideas to the Office ’97 Assistant. Similar to the prototype a large range of observations of the current view and document were used to evaluate the user’s goals and needs. However, the assistance is not based on a model which determines if the user needs assistance. Neither the user expertise is considered nor is a persistent user profile established. In the Office ’97 Assistant thousands of goals are considered, but only with a shallow model. All these reductions led to a assistant which is not very sophisticated anymore.
the immediate task, such as neediness (N). Relevant personality traits include the user’s tendency to get distracted (TD) and tendency to work independently (TI) on a computer. These influences are illustrated in Figure 1 (right). Other factors can be modeled similarly.
Inferring User Features The Lumi`ere project, discussed in the previous section, tried to infer the user’s neediness. In addition to that, (Hui & Boutilier 2006) are aiming to infer the user’s state in terms of user features, which includes emotional state and personality, to adapt the user interface to them. They are modelling the user’s features explicitly and then try to infer these features through observations of user behaviour. User Model. Users are modelled in terms of their attiprecisely, we develop a generic modelpersonality of static user type tudes, which More are transient over time, and their and transient user state in which both the type and the state are traits, which are assumed to be static over time. All these inferred (or learned) over time based on observations of user beuser parameters areWerandom variables, because ofand thetheuncerhaviour. model the dynamics of user state interaction tainty of the user’s and apreferences. The user and state with a help needs system using dynamic Bayesian network, the relbenefits ofof various types ofattitudes help (and and their personalinteraction with and type areative composed the user’s ity traits: user state) using a generalized additive utility model. The proba-
User cribed so far did not state
{
{
an activity show that n be observed and a sistance.
bilistically estimated user state is then used determine the expected of a specific course of action (various forms of help or lack •utility Attitudes of help) at any point in time. This generic model is elaborated in – Frustration (F) this model in a specific text-editing task in Section 2. We instantiate Section 3, with assistance for users with mild cognitive or physical – Neediness (N) impairments in mind. However, the general principles illustrated in •thisPersonality traits task carry over to any form of automated software assistance. We–discuss simulation in Section Tendency to getresults distracted (TD) 4, a protocol for learning model parameters in Section 5, and the results of a preliminary user – Tendency to work independently (TI) Userproblems study in Section 6. While the user study suggests certain – the Tendency towards Frustration typeare quite with prototype implementation, the (TF) qualitative results – Tendency Neediness (TN) decision-theoretic apencouraging and towards do suggest that this general proach to assistance we propose is indeed useful.
e over time and that xample the users goal . Such behaviour can etwork. It is able to me and depend on preple. As can bee seen All variables of the user’s state have a discrete domain of previous goal, which All variables of where the user’s state have domain /1,2,3}, 1 denotes not, 2a=discrete somewhat and 3 of = very 2. N A1=GENERIC USER of the variable {1, goal.2, 3}, where = not, 2that = somewhat and 3 = very (e.g. (e.g. 2 means the user MODEL is somewhat in need of help s which stay constant Wethat begin by proposing a TN generic that allows an automated at the moment). TF is andsomewhat canmodel only boolean values N = 2 means the user in take need of help at (1 assistant learn its user. riables which change or 2),Twhere 1 means true and 2take means false. After all, there the moment). Ftoand Tabout N can only boolean values, revious state, such as 36 user nd 81 user states. e.g. the userare either hastypes aState tendency towards frustration or not. 2.1 User and User Types U SER MODEL AS PICTURE LIKE IN PRESENTATION , After all, there are 36 user types and 81 user states.
First we consider the factors that influence whether a user accepts EMPHASIZE IMPORTANT PARTS help from an automated and the value of such assistance, They model thesystem user’s staticassistant, features with andistribution eye towards The maintains a probability over all 7 Assistant. In the asuser shown in Figure 1 (left).may Whether a user accepts between automated help a persistent profile which be transferred user states, which is updated every time a newasobservation soft Exel was created depends on the quality of the assistance (QUAL) well as the applications. about the user’stobehaviour enters the(TI) system. actions of vious discussed different ideas user’s tendency work independently and theThe amount of atthe system are based on this belief that a user is in a parmaintains a probability distribution over all ome of these ideasThe to system tention that is directed toward considering help (CONS). For examstate (i.e. has every certain attitudes atnot the moment). This of observations of thestates,ticular user which iswho updated time amay new observation ple, a user is highly independent consider or accept technique belief monitoring. to evaluate the user’s help even ifisit called is perfect. Thestate degree to whichThe a usersystem’s might consider about the user’s behaviour enters the system. ance is not based on are help depends on the user’sthat current attitudes the automated actions based on the belief a user is intoward a particular agent and general personality traits while working in a computing ser needs assistance. Dynamic Network. They model their system state (i.e. has certainBayesian features at the moment). setting. Relevant user attitudes include those directed toward the d, nor is a persistant with a dynamic Bayesian network (see ??) in causal order. computing environment, such as frustration (F), and those toward goals are considered The influential factors can be seen in figure 1. A user’s acthe immediate task, such as neediness (N). Relevant personality with shallow model. Causality & Inference. The tendency users’ acceptance of help de- tencpetance on help depends on the of the availabe traits include the user’s toquality get distracted (TD) andhelp, ce which is notpends very on the the user’s tendency work and quality of the to available help, the users’ ten- she dency to work independently (TI)independently on a computer. Thesewheter influences considers help. The user’s consideration of can help dependency to work independently whether they consider are illustrated in Figure 1and (right). Other factors beismodeled dent on consideration the user’s state (F,N,TD,TI). similarly. help. The users’ of help is dependent on the
Help?
users’ state {F, N, T D, T I}. These influential factors can
o explicitly infer the Need Help Tendency seen in figure 6. With Task To Be ures. They are be modConsiders Now Distracted Keeping these influential factors in mind, they model their Help then try to learn these Frustrated Quality a Dynamic Bayesian Network (DBN) in causal a single goal. system They with Independence With System of Help Independence Now canBy be hether to suggestorder, help which(Work Self) seen in figure 7. The user’s frustration, (Work By Self)
UNCERTAINTY
neediness and consideration of help at a certainConsiders point in time Accept Help is dependent on its value at the last time step (coloured orHelp in terms of herange). atti- The user’s type {T F, T N, T D, T I} does not change d her personalityover traitstime. Figure 1: Influential factors. Left:(Hui Causes for accepting Figure 1: Influential factors & Boutilier 2006)help. me. All these user paRight: Causes considering help. lines. The DBN The observations are for drawn with double ables. The user’s atobserves the users’ (OBS), which is causally de-a dyKeepingbehaviour thisvariables infleuntial in mind, they ness (N). The user’s Together, the {F,factors N, TD, TI} make up themodel user’s state. pendent on their current state; the available help and its qualnamic Bayesian network whichtocan be seen in figure 2. The As we will see, these are sufficient predict the probability of spedistracted (TD), Ten-
ency towards frustraness (TN). The user’s user’s static type of
Need Help With Task Now
Considers Help Quality of Help
Independence (Work By Self) Accept Help
Frustrated With System Now
that allow servation for inferr specific, w At a gi infers the at the nex sist over point in t time, the him. To m dynamic 2. In this dencies o user type to learn th Forma set of n t. We de condition its parent
Tendency To Be Distracted
Independence (Work By Self) Considers Help
Figure 1: Influential factors. Left:(Hui Causes for accepting Figure 6: Influential factors & Boutilier 2006)help. Right: Causes for considering help. currently needs help with a difficult task may benefit greatly from
thethe variables {F,theN,user TD, TI} up steps; the user’s state. partial suggestions that helps the next someityTogether, as well as direct request ofidentify the make user for more or fewer Asone we who willissee, these are sufficient tonot predict the probability of spegenerally dependent may mind receiving imperfect help (SY S). cific user behaviours (including accepting and howsomecostly or suggestions as much as someone who is highlyhelp) independent; Exact inference in the DBN isnow done with a cliquemore tree alone who is with the system is likely rewarding a frustrated user perceives his experience with to thebecome automated sysgorithm. This ofConsider algorithms “is particularly suited to with family further interruptions and We discuss temfrustrated at any point in time. the suggestions. follow examples: someone the case where observations arrive incrementally, where we the precise structure of the reward and cost functions below. who is easily distracted may find automated assistance costly beTD and TI are static, reflecting traits that the want the posterior probability of eachspecific node,user and where causeVariables it prevents the user 1 from completing the task; someone who do of notbuilding change over In contrast, andamortized N are transient, cost thetime. clique tree canFbe overre-many flecting user attitudes that can change, often frequently, during a cases.” (Zhang & Poole 1996). specific session. How these transient variables evolve can also be modeled by assuming additional static user traits. For this purpose, we propose latent variables TF and TN, representing the user’s tendencies frustration in theTDapplication. These TF TF TN toward TN TD TI HELP and neediness TI HELP QUAL QUAL influence the (stochastic) evolution of F and N. We define a user’s type to N be the state of all static user traits: N{TF, TN, TD, TI}. CONS CONS FIn our prototype application, theseF user variables are discrete, with variables F, N, TD and TISYS having 3 values each, and TN and TDSYS having 2 valuesOBS each. F = 1 denotes that the user isOBSnot frustrated, F = 2 the user t!1 is somewhat frustrated, and F = 3 the user is very t frustrated. Other variables are defined similarly. As a result, there are 81 user states and 36 user types.
Figure 2: A two time-step DBN user model. Solid arcs indicate
Figure Dynamic Bayesian (Hui & Boutilier intra-temporal links while dashed lines indicate inter-temporal 2.2 7:Model Structure and Network Dynamics links. Observations are drawn with double lines. 2006) Since the user state is partially observable, the system must maintain a probability distribution, or belief state BEL(F, N, TD, TI) (BELthfor short), over user statesthgiven all past observations of user the k value of Xi and the j likelihood parent configuration. behaviour (reflecting the relative that the user isWe in adiscuss parthese parameters inThe more detail in the next section. ticular state). Based on the current belief state, the reasons Observations. observation model is system domain specific, The parameters of acosts DBN areactions defined by the rewards and of its in order toD, make appro-toatbe butabout fully observable variables for F, N,aTprior Tdistribution Ianhave time t= 0, a transition function, and after an observation model.they As an priate decision, anduser’s updates its beliefs each user observation. derived from the observations. In their paper use A user’s type traits TF, TN, TD, TI), despite having a fixed initial step, we(over handcrafted these parameters using expert domain the domain of text-editing where word prediction is convalue for a specific user, isfunction not known priori the system and knowledge. The transition for athe usertotypes is the identity sidered assince automated help (i.e. the persistent user is typing and thus must also be estimated probabilistically. function, these variables represent traits of text a user. the system tries to suggest the most the user The causal relationships in Figure 1 formprobable the basis ofword our model. The transition functions P r(F t |Ft−1 , TFt ) and P r(Nt |Nt−1 , TNt ) In addition, the availability of automated (HELP) affects wants to frustration type). In and thisneediness domain, theassistance observation function capture patterns and how they evolve.for when the frustration user function can consider suggestions. Our model incorporates the user’s can instance beobservation modelled as observThe transition for for CONS model for t and the additional system variables (SYS) and user observations (OBS). OBS more movements complicated due toa the sizesequence of the distributions. t are ing fast mouse and rapid of clicks An example of a system variable is the status of an interface widget as Here, we their common substructure. For example, if help well theexploit user jamming into the keyboard. thatasallows the user to directly manipulate its settings. User obisservations not available, user is not P r(CON St = should the be abstracted at considering a behaviouralit,level, and useful not|HELP = none) = 1.0. If help available and user was for inferringt the user’s state. Since theseisobservations arethe domainDecision Policy. Based allthen observations thatofgotheinto considering (CONS = on yes), the probability userthe t−1discussion specific, we itleave further to Section 3.1. DBN, decision has be system made at eachthe time considering help istodefined as Pobserves r(CONS ,action, HELPt ), to t |F t , Ntwhether At aa given pointnow in time, the user’s which independent TD and is offer that whether suggest help to current the of user or intuition not. The system t(sHelp) t . The infers isthe user’s state, andTIdecides whether to help reaone willnext (dis)continue to consider help on changes inon thethe at the timerewards step. Naturally, certain variable values may persons about the and costs ofdepends its actions, based sist over time, or influence the values of other variables at the next levels of frustration or neediness. On the other hand, if the user was current belief in the user’s state. The user can either accept point time. For example, user frustrated now, but over not considering help already, thenmay thebecurrent consideration level (acc) orin reject (¬acc) theasuggested help. The expected utiltime, the frustration level willofdecrease nothing else aggravates will depend on the difficulty the taskifand the user’s tendency to itywork (EU ) for suggesting help: him. alone, To model these temporal characteristics, we adopt a two-stage P r(CONS t |Nt , TIt , HELPt ). dynamic Bayesian network model [7], clique as shown Figure Exact in DBNs is done via the treein algorithm EUinference (sHelp) = (DBN) EU (sHelp|acc)P (acc) 2. In this variables N, and CONS depends have temporal depen[17]. The model, performance ofF,this algorithm on the size of + EUthe (sHelp|¬acc)P (¬acc) dencies on their counterparts future, and the values of the the cliques which are createdin based on the dependencies in the user variables persist over model allowshelp the system Thetype expected fortime. notThis suggesting is calcuDBN. In the contextutility of user modeling, we are interested in monitorto learn the user’s type through behavioural observations. ing Formally, the system’s beliefThe distribution overa joint thecarries user’s state time, lated analogously. system out over the a two-stage DBN modelsthen distribution over action a given past observations: P r(BEL |OBS ). Let X denote t 1:t t with the maximum expected utility, i.e. suggest help set of n random variables X = {X1 , ..., Xn } at time t − 1 andthe if clique of elements BELas TFwhich , and CONS t , θ, t , TNtspecifies t . Then t. (sHelp) We consisting denote > theEU parameterization the set of EU (¬sHelp). P Pconditional r(BELt |OBS P r(X |OBS ) which is pro1:t ) = distributions, t 1:t probability P r(X |Pa ) for each X TF ,TN ,CONS i i i and t t t P portional r(X |OBS This its parentstoPai .TFIn particular,Pθr(OBS r(X xkit|Pa paji )).for t |X t )P i = i =1:t−1 ijk = P t ,TNt ,CONSt
user’s frustration, and consideration of help cific user behavioursneediness (including accepting help) and how costlyatora rewarding a user perceives his experience with values the automated syscertain point in time depend on their direct in the past. equation corresponds to a rollup step in the inference algorithm. In 1 tem atuser’s any point time. Consider the follow change examples: someone The typein(TF,TN,TD,TI) doesn’t over time. Naturally, these can change over certain takeand Section 4, we discuss simulation results time that scales, gauge but the we speed who is easily distracted findwith automated costly beThe observations are may drawn doubleassistance lines. The DBN these to be static at least over the time frame associated with a reaaccuracy of thisseries process. sonably small of application sessions. cause it prevents the user from completing the task; observes the user’s behaviour (OBS), which is someone causallywho deWe are also interested in predicting the likelihood of a user acpendent on his current state; the available help and its qualcepting help given its quality, the system environment, and past eviity as well as the direct request of the user for more or fewer dence: P r(OBSt+1 = acc|HELPt+1 ,QUALt+1 , SY St+1 |OBS1:t ). help (SYS). 187This term can also be computed readily using the clique tree algoThey do direct inference in the DBN with a clique tree
1 Naturall these to b sonably s
187
To evalua tion that inco The reward the suggestio lows: R(F, T generalized overall perce determined b frustration a independenc the user is de the automate function: C range of the
3.
TEX
In order to that correlate the model m bed applicat its functions email and o motor disadv diction softw and give the prediction is sented in Fig tem will not learns the us it believes th is generaliza User Model
OBS,HEL
Abstract Event
3.1
Der
In a typica are the sour events into b istics. The OBS can be characteristi
• Frust
positive weight wi, 1! i! m. Output: Three recommended folders (descending in predicted preference). Step 1. Compute a probability pi for each fi by normalizing the m
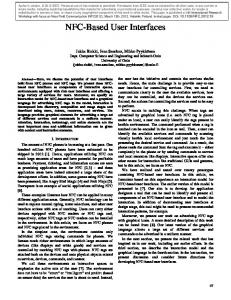
FolderPredictor running. The three predicted folders are shown as the top three icons in the “places bar” on the left. The user can jump to any of them by clicking on the corresponding icon. The most probable folder is also shown as the default folder of the dialog box so that the display will show this folder initially.
! Simulation. They evaluated their i "1 user model by running simulations with their text-editing domain. Them user’s beStep 2. Build the hypothesis set: H " ! Hi , where Hi is the set haviour was simulated by sampling from the DBN. On avi "1 erage, their system was able toofdetermine the correct user of all ancestors fi, including fi itself. type based on the simulated observations for all possible Step 3. Compute a distance L(h, f) for each h # H and f # F : user types. L(h, f) = the length of the path from h to f in the tree-structured weights: pi " wi
wi .
folder hierarchy. Step 4. Return the three different folders a1, a2, a3 from H that Learning Model Parameters. After evaluating their user minimize the expected cost: model, they learned the parameters for the DBN (prior dism pi $ min{ a , fi), L(a , functions) fi) % 1.0, L(by a , fi) % 1.0} tributions, transition functions andL(observation ! i "1 conducting experiments with 45 users. They recorded the user’s behaviour and acquired the user’s features through Step 4 collected of the above algorithm, the costthey of getting questionnaires. AfterIn they all the data, usedto a folder fi from a prediction (a1, a2, a3) is computed as the Expectation Maximation algorithm to learn the parame{L(a , fi), L(a , fi) % 1.0, L(a , fi) % 1.0} , because of Figure 4. FolderPredictor is integrated into the open file ters for the DBN. Themin reason behind this parameter learning box. Figuredialog 8: FolderPredictor, an application of TaskTracer. the following facts: was to replace their initially handcrafted parameters by pawill be set as the default folder of the open/save file 1) a 1 rameters that have been derived from real user behaviour. There are five slots in the places bar. By default, Microsoft dialog. This means that the user will be in folder a with no 1
1
2
2
3
3
1
Windows places five system folders (including “My Computer” extra “click” required. Therefore, L ( a1, fi) is the cost if the TaskPredictor. consists of two and “Desktop”) The there. TaskPredictor Informal questioning of Windows users user navigates to fi from a1. revealed that several of these shortcuts were not commonly used.
parts, namely Taskpredictor.WDS and TaskPredictor.email. User Study and Results. To validate their learned model, Thus, we felt it was safe to replace some of them by predicted 2) experiment a2 and a3 will be shown4 asparticipants shortcuts to the by corresponding Taskpredictor.WDS aims to predict task based on they made a usability with folders. By default, FolderPredictor uses threethe slots for predicted folders in the “places2bar” on the left side of the open/save events, called Window-Document-Segments (WDS), comparing their adaptive policy MEU against the static whereas TaskPredictor.email predicts the task based on policies A LWAYS (always suggest help) and N EVER (never incoming email messages. We will concentrate at TaskPresuggest help) as well as the adaptive policy T HRESH (sug181 dictor.WDS in the following, but TaskPredictor.email is gest help if its quality exceeds a certain threshold). The task similar. given to the users was to edit text with a Dvorak3 keyboard. “A WDS consists of a maximal contiguous segment of They got the result that 3 out of 4 users actually preferred time in which a particular window has focus and the name A LWAYS to their adaptive policy MEU. However, the sysof the document in that window does not change.” (Shen et tem inferred that all 4 users were of the needy (TN = true) al. 2006) and dependent (TI = 1) type which can explain why they preferred A LWAYS over their adaptive policy. TaskPredictor.WDS. TaskPredictor.WDS extracts the information from the WDS (window title, filename, path, and Task Recognition website url if applicable). It then segments the information In the previous section we focused on adapting the user ininto a set of words and adds them to a global set of unique terface based on the user’s current needs and attitudes. These words that have been collected from all events so far. For user features naturally change over time because the user’s each event, it keeps the feature set of the event’s unique tasks change over time. To examine this aspect in more dewords (see figure 9). TaskPredictor.email is very similar, tail we review a paper that focuses on predicting the user’s it just uses the properties of the incoming emails instead current activity (task). (sender, recipients and subject). A group at the Oregon State University has developed the TaskTracer (Dragunov et al. 2005) system which aims to Set of all words Words of event help multi-tasking users manage their resources. They do (WDS) this by associating all accessed files, folder and emails of a user with user-defined activities. FolderPredictor (Bao, Herlocker, & Dietterich 2006) is an application that builds on top of the TaskTracer system and modifies the open/save dialogue to give the user the most probable folders for the current task (see figure 8). Figure 9: Feature set The initial TaskTracer system relied on the users to manually switch the task they are currently working on. Because of this inconvenience they developed TaskPredictor (Shen et Machine Learning Methods. In order to make the predical. 2006) as a part of the TaskTracer system, which tries to tions, they employ three machine learning methods: Claspredict the user’s current activity based on the observation sification thresholds, Mutual information feature selection of accessed objects (e.g. windows, files). We are focusing and a Hybrid Naive Bayes / Support Vector Machine (SVM) on TaskPredictor in the following. classifier. 2 First, they apply feature selection to reduce the amount Maximum expected utility 3 A different keyboard layout than QWERTY of features that will be taken into account for the prediction.
Hybrid model
0.95
0.9
0.9
0.8
sion than Naive Bayes when the number of features is very large, whereas Naive Bayes does better when the number of Classification Let x be vector of features features is less thresholds. than 400 (although theadifferences are not extracted from a WDS and y be a task. Thenalways the probability statistically significant). For FB, the SVM outperof x isNaive Bayes, and most forms X of the differences are significant. Note that for P FA, (x) the = best P precision (x|y)P (y)attained is around 93%, while for FB, the SVM y does better than 95%. We set the number of features K to be 200 for both FA and FB. which is calculated by the Naive Bayes classifier and esFigure 4 plots the precision as a function of the number timates the probability density on the neighbourhood of x. of features for TaskPredictor.email. Here, the results are Then different, they use aperhaps threshold θ andthe only make a prediction if quite because classification threshold P (x) > θ, i.e. the prediction confidence exceeds the threshwas set to zero, so that TaskPredictor.email was forced to old. a prediction for each email message. We see that best make performance is achieved when a large number of features are available. Indeed, the SVM achievedlist maximum Feature Selection. A stopword is used performance to get rid of when all features are(like included, while Bayes very common words “open”, “to”)Naive because theyattains would the maximum when 500 features are available. However, otherwise appear in a lot of events and make the prediction none of these differences is statistically so we less accurate. They also apply stemmingsignificant, of words before set K = 200, because it makes the learning and prediction they store them in the feature set (e.g. jumping → jump). Fialgorithms much more efficient.
nally mutual information is used to choose the 200 features with the largestof(individual) predictive threshold power. “Intuitively, 4.3 Effect the classification mutual information measures the information thatthreshold. X and Y Now we analyze the effect of the classification share: it5 measures howthe much knowing of these variables Figure and 6 show precision of one TaskPredictor.WDS reduces our uncertainty about of thethe other.” (Wikipedia 2006) as a function of the coverage algorithm. These val-
ues are averaged over all of the days of the test data. The coverage is the+ percentage of WDSs which a previously, prediction Naive Bayes SVM classifier. Asfor mentioned was made, and precision is thetoprobability that the preNaive Bayes is the cheap to compute estimate the probability dictions madeSupport were correct. The valueare of supposed the classification of an event. Vector Machines to have threshold θ is implicit in in these plots. Low values of θ correhigher predictive power general. spond to high coverage, and high values of θ give low covThe Naive Bayes classifier is used to estimate the probaerage. We see that as we increase θ, the precision increases bility P (x) of the current event x. Then the actual prediction very well. TaskPredictor.WDS is able to attain a precision of the most probable task is made with the SVM, but only if of 80% with coverage of 10% for FA and a precision of 80% P (x)coverage exceeds ofthe20% given θ. If P (x) ≤ θ, no prewith for threshold FB. diction is made because the system not confident enough Figure 7 plots the precision versusincoverage for TaskPreto predict the Again currentweactivity (according to values θ). dictor.email. observe that larger of θ (i.e., lower coverage) give higher precision. Naive Bayes is able
Results. The results are measured in terms of coverage and precision. Coverage denotes the fraction of cases in which a prediction was made, in other words the system was confident enough in its prediction. Precision is the probability that the prediction being made is correct.
0.7
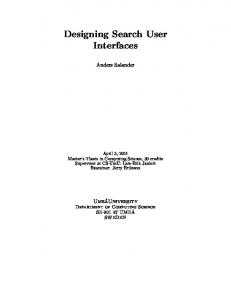
The effect of the classification threshold θ: A low θ causes high coverage with a low precision. High θ results in low 0.6 coverage with high precision on the opposite. The overall goal is to have high precision, even at low coverage. This is 0.5because the system doesn’t want to interrupt the user if it is not very confident in the prediction that can be made. So they 0.4 fixed the precision to 80% and found out that they could get a coverage of 10% and 20% (they only had two subjects). They even got better results for TaskPredictor.email, they 0.3 0.2 0.3 0.4 0.5 0.6 0.7 could get0.192% precision withCoverage 66% coverage. They got slightly better results with their hybrid classifier than with singleofNaive Bayes or SVM as as canabe seen Figure 5: either Precision TaskPredictor.WDS funcin figure 10.coverage for FA, created by varying θ. tion of the Precision
The intention is to improve the accuracy of the classifier by 0.8 reducing its complexity and additionally gaining speed by 0.75that. doing Classification thresholds are used to decide whether the 0.7 system should make a prediction or not, based on the classification confidence. 0.65 A Naive Bayes classifier is used to compute the classification confidence. It estimates the probability density on 0.6 0 100 200 300 400 500 the neighbourhood ofThe the current event. If there haveAllbeen number of features K similar events before, it is more likely that the current event refers to4:a specific task. is also fast to computeas because Figure Precision of It TaskPredictor.email a func-it assumes that all features (here words) are independent. tion of the number of features K (θ = 0). Error bars The actual of intervals. the user’s task is done by a Supdenote 95% prediction confidence port Vector Machine (SVM). A SVM is a linear classifier that separates objects into two classes such that the classFor both we canmargin see thattoreducing the numborder has FA the and mostFB, possible all objects. It is ber of features improves the performance both therefore calledgenerally a large margin classifier and has beenofshown Naive Bayes and prediction the SVM. (Shen For FA, gives higher precisuitable for text et SVM al. 2006).
0.95
Naive Bayes SVM Hybrid model
0.9
0.85
0.8
0.75
Precision
Precision
0.85
0.7
0.65
0.6
0.55
0.5 0.1
0.2
0.3
0.4
Coverage
0.5
0.6
0.7
Figure as a funcFigure 6: 10:Precision Results of forTaskPredictor.WDS TaskPredictor.WDS (Shen et al. tion of the coverage for FB, created by varying θ. 2006) to attain a precision of 91% with a coverage of 66%, and the hybridSummary method is able do slightly better, with a preandto Future Directions cision of 92% at a coverage of 66%. Note that the hybrid We have discussed how to use user modelling for implemethod always gives better precision for the same coverage menting than Naiveintelligent Bayes. user interfaces. Decision networks can
be used to decide if a user interface should assist users, but it has toEffect be takenofinto thatMethod this is a interruption which 4.4 theaccount Hybrid has a cost associated with it. In most cases the cost is even The preceding figures also show the effect of the Hybrid higher if the suggestion is poor or even wrong. User method. For FA (Figure 5), the Hybrid method gives models precican that be rather complex,the butsame simply reducing the when complexity sion is essentially as Naive Bayes covwill in most cases lead to aastool intelligence erage is small and the same the with SVMlimited when coverage is which has or is even annoying formethod the user.gives betlarger. For no FBuse (Figure 6), the Hybrid have seenthan the either approach of Bayes (Hui & ter We performance Naive or Boutilier the SVM 2006), when which aimed to infer the user’s features to decide coverage is small and performance similarexplicitly to the SVM with when to is offer help to theTaskPredictor.email user. They developed a general coverage larger. For (Figure 7), user we see thatwhich the Hybrid outperforms thedemonNaive model can bemethod used inalways different domains and Bayes at all coverage stratedmethod its feasibility for the levels. task of text-editing where the Thesegoal results show that the hybrid method givesapplying perforuser’s is typing words. They are currently mance equal to better than the best method their model to or a different domain withsingle changing user(Naive goals, so they have to alter the prediction model to take that into account. (Shen et al. 2006) focused on the classification of user 90 activities. They did this in order to support them fulfilling their tasks, e.g. by modifying the open/save dialogue for
applications (see Figure 8). They employed several machine learning methods, especially a hybrid Naive Bayes / SVM classifier, to increase the accuracy of the prediction being made. We think that both components, knowing the user’s features (including emotional state and personality) and knowing what the user is currently doing, are necessary to improve the quality of modern user interfaces. To improve intelligent user interfaces the range of observations should be broadened to enable a more precise prediction. Intelligent systems should be tested with users to find out if the automatic adaptation is accepted by users and does not interrupt too much. Although user interfaces are very complex today and automatic adaption is helpful, users also want to be able to predict how the interface behaves. These are competing goals and it is a very difficult to find the right trade-off.
Acknowledgement We thank Bowen Hui for her helpful explanations and comments about her paper and current work.
References Bao, X.; Herlocker, J. L.; and Dietterich, T. G. 2006. Fewer clicks and less frustration: reducing the cost of reaching the right folder. In IUI ’06: Proceedings of the 11th international conference on Intelligent user interfaces, 178–185. New York, NY, USA: ACM Press. Dragunov, A. N.; Dietterich, T. G.; Johnsrude, K.; McLaughlin, M.; Li, L.; and Herlocker, J. L. 2005. Tasktracer: a desktop environment to support multi-tasking knowledge workers. In IUI ’05: Proceedings of the 10th international conference on Intelligent user interfaces, 75– 82. New York, NY, USA: ACM Press. Horvitz, E.; Breese, J.; Heckerman, D.; Hovel, D.; and Rommelse, K. 1998. The Lumi`ere project: Bayesian user modeling for inferring the goals and needs of software users. In In Proceedings of the Fourteenth Conference on Uncertainty in Artificial Intelligence, 256–265. Madison, WI: Morgan Kaufman. Hui, B., and Boutilier, C. 2006. Who’s asking for help?: a bayesian approach to intelligent assistance. In IUI ’06: Proceedings of the 11th international conference on Intelligent user interfaces, 186–193. New York, NY, USA: ACM Press. McGrenere, J.; Baecker, R. M.; and Booth, K. S. 2002. An evaluation of a multiple interface design solution for bloated software. In CHI ’02: Proceedings of the SIGCHI conference on Human factors in computing systems, 164– 170. New York, NY, USA: ACM Press. Shen, J.; Li, L.; Dietterich, T. G.; and Herlocker, J. L. 2006. A hybrid learning system for recognizing user tasks from desktop activities and email messages. In IUI ’06: Proceedings of the 11th international conference on Intelligent user interfaces, 86–92. New York, NY, USA: ACM Press. Wikipedia. 2006. Mutual information — wikipedia, the free encyclopedia. [Online; accessed 3-December-2006].
Zhang, N. L., and Poole, D. 1996. Exploiting causal independence in bayesian network inference. Journal of Artificial Intelligence Research 5:301–328.