International Journal of Artificial Intelligence in Education 14 (2004) 1-37 IOS Press
Interacting with Inspectable Bayesian Student Models Juan-Diego Zapata-Rivera, Jim E. Greer, ARIES Laboratory, Department of Computer Science, University of Saskatchewan, Saskatoon, Canada
[email protected],
[email protected] http://www.cs.usask.ca/research/research_groups/aries/ Abstract. Inspectable student models focus on the idea of letting students and teachers interact with the representation of the student that the system maintains. Both humans and the system can benefit from this interaction. By externalizing the student model and making it an object for inspection, several representational and interaction issues arise. This paper presents ViSMod (Visualization of Bayesian Student Models) an integrated tool to visualize and inspect distributed Bayesian student models. Using ViSMod, students and teachers can understand, explore, inspect, and modify Bayesian student models. ViSMod offers a practical tool that helps students and teachers to engage in negotiated assessment processes. Student models in ViSMod follow the Bayesian belief net backbone structure proposed by Reye (1996), which describes both cognitive and social aspects of the student. In addition, we report on a usability study of the ViSMod tool and an exploratory study focused on the effects of employing various levels of guidance and support in the way students interact with inspectable Bayesian student models. INTRODUCTION In order to provide personalized instruction to a particular individual, Intelligent Tutoring Systems (ITSs) keep a representation of the student. Such a representation of the student (student model) can include the student’s knowledge about some particular domain, learning preferences (e.g. learning style), and social aspects that affect the learning process (e.g. motivation). Student models have been used in many areas, such as: adaptive educational and training systems, help systems, recommender systems, and others. Student models can be used for more than supporting the traditional components of an ITS. Students themselves can benefit by looking to their own models and reflecting upon the content. Considering students as an active and integral part of a learning process, models of the student become powerful tools that offer important opportunities to engage students in meaningful learning experiences. Inspectable student models focus on the idea of letting students (and teachers) interact with the representation of the student that the system creates and maintains. Both humans and the system can benefit from this interaction. Students become aware of their own representation in the system and can use this information to feel some control over their own learning. Students can also offer their opinion about this representation, which makes the diagnosis process of the system less demanding and may improve the accuracy of the model. 1560-4292/03/$8.00
© - 2004 IOS Press. All rights reserved
2
J.D. Zapata-Rivera & J.E. Greer/Interacting with Inspectable Bayesian Student Models
Inspectable student models can be used as an instrumental tool that facilitates learning, reflection and knowledge awareness. Student models can be created by students or can be the result of a collaborative activity between the student and the system. Models can be refined by adding information from different sources (i.e. from the teacher, the student, peers, and/or educational systems that interact with the student). By revealing the student model to the student, it becomes an object for inspection, an external representation of what the system believes about the student. Considering the student model as an external representation, it is necessary to analyse all the possible effects that this representation artifact can have in the way students learn and interact with computer-based educational systems. External representations of the student’s knowledge in the form of conceptual maps, student portfolios, thinking maps, organizers, and mind maps have been used in education and training environments as a means of capturing and representing knowledge. External representations have demonstrated their effectiveness in enhancing learning processes in schools and corporations (Jonassen et al., 1993a; Jonassen et al., 1993b; Novak, 1998; Novak & Gowinn, 1984; Hyerle, 1996). In our work, students’ conceptual maps have been included as part of the student model in order to facilitate sharing of knowledge and assessment of students’ knowledge by teachers (Zapata-Rivera et al., 2000). Jonassen’s concept of mindtools as cognitive artifacts/systems that can be used to foster meaningful learning demonstrates how different educational systems (i.e. databases, spreadsheets, expert systems, system modelling tools, visualization tools, and communication tools) that offer a variety of external representation possibilities can be employed to engage students in the content as well as in basic, critical and creative thinking (Jonassen, 2000). Suthers explores the use of different representational tools in supporting collaborative learning (Suthers, 2001). Representational and interaction issues of inspectable student models as external representations of the student are the focus of our research. We are interested in knowing how different student modelling representations and different forms of interaction with the model affect learning. Some of the questions that arise when student models are presented to students and teachers are as follows: • Are students able to understand their student model? •
What kind of representation is more appropriate (textual, graphical, etc.) and under which conditions?
•
How does the student model information support students’ reflection? Is it possible to use student feedback to build more accurate models?
•
What kind of information is it possible to acquire by interacting with the model? Which components of the model should be available to students to visualize and manipulate?
•
To what extent can information given by students, teachers and the system be combined to improve the modelling process?
Several authors have been working on some of these questions and interesting results have been found. In a preliminary study, Bull and Pain (1995) found that students seem to understand textually presented models. Bull and Shurville (1999) showed how students and the system can
J.D. Zapata-Rivera & J.E. Greer/Interacting with Inspectable Bayesian Student Models
3
co-operate in the construction of writer models improving the model and accuracy of their predictions. Dimitrova et al. (1999a) explored a collaborative construction of student models promoting student’s reflection and knowledge awareness. Morales et al. (1999) showed a graphical representation of the model for a sensori-motor task where modularity and interaction with the model are presented in a complementary way. Kay (1999), in her scrutable user modelling shell system (UM), extends the notion of inspectability by helping the user to understand the meaning of each of the elements and processes of the model. UM provides tools for external sources, tools for internal inferences, tools for conflict resolution, and tools for scrutability support. Experiments using two consumer systems (e.g. sam - a text editor and a movie advisor) showed that users did use the scrutability support interfaces to see their model and information about the processes that formed it. Dimitrova et al. (1999b) explored interactive diagnosis based on conceptual maps. Students used an interface that combines conceptual graphs and classification of interactions to support their dialogue about the student model. Students in this system can manipulate the model directly. Other authors have been investigating assessment processes in open learning environments. For example, Brna et al. (1999) defined the notion of negotiated assessment, which allows the student and the teacher (or an agent acting on the teacher’s behalf) to engage in dialogue about the model that will result in a more accurate assessment and an optimised student model. Mühlenbrock et al. (1998) proposed a teacher assistant that allows teachers to inspect student models in order to assess the student’s current state of knowledge, to arrange students in groups, and to suggest appropriate peer helpers. Finally, in Paiva et al. (1995) the system externalises the student model to the teacher, in order to test the modelling process, support self-assessment, and promote reflection and interactive diagnosis. Most of the student models in the systems mentioned above are easily inspectable because the modelling approaches are relatively simple to understand. The models are slots and values, feature vectors, simple overlays or rules. More complicated representational formalisms, such as Bayesian belief networks can be effectively used to construct student models, but these representations are presumably harder to inspect and understand by the student. Several authors in different areas have explored the use of Bayesian belief networks to represent student models (Collins et al., 1996; Conati et al., 2002; Conati et al., 1997a; Conati et al., 1997b; Horvitz et al., 1998; VanLehn & Martin, 1997; Reye, 1996; Reye, 1998; Villano, 1992). Martin & VanLehn (1995) proposed a special interface (assessor’s interface) that allows a human (the assessor) to create a Bayesian network of rules and factors. Using this interface the assessor can get an overview of the student's competence and manually increase the probability of a rule when new information is available. Although existing configurations of student models can be represented using Bayesian belief networks in a solid and computationally tractable fashion, understanding the status of a Bayesian network can be difficult. In our work, we developed VisNet (Zapata-Rivera et al., 1999) to experiment with how to visualize Bayesian networks. In this paper, we extend our previous work. We present a multiple-view application, ViSMod, that has been designed and built to permit students and teachers to inspect student models represented as Bayesian networks (Bayesian student models - BSMs). ViSMod allows students and teachers to experiment with the creation of Bayesian what-if scenarios; providing not only a visualization tool, but also an interactive tool for inspection of and reflection on Bayesian student models. In addition, ViSMod has been adapted to visualize and inspect
4
J.D. Zapata-Rivera & J.E. Greer/Interacting with Inspectable Bayesian Student Models
distributed Bayesian student models, allowing the use of student model information from different sources. We report on two different studies. The first one, a usability study focused on how people can better understand general Bayesian belief network concepts using different visualization techniques. The second one, a larger scale exploratory study was carried out in an elementary school in which students and teachers had the opportunity to interact with BSMs in a variety of contexts. VISUALIZING BAYESIAN STUDENT MODELS Bayesian Belief Networks (BBNs) (Pearl, 1988) have become accepted and used widely for reasoning under uncertainty. Probabilistic and/or causal relationships among variables are represented as a directed acyclic graph (DAG.) Using prior and conditional probabilities attached to each node, it is possible to propagate changes in probability values on receipt of evidence. The information encoded in BBNs facilitates the analysis of action sequences, observations, consequences, and expected utility (Pearl, 1988 1997.) These characteristics make BBNs a powerful technique to model students’ knowledge by representing causal and probabilistic relationships among concepts and guaranteeing consistency of beliefs when new evidence (knowledge) is included in the model. One of the main advantages of BBNs is that they provide an inspectable cause and effect structure among their nodes and direct specification of probabilities in the model (Villano, 1992). BBNs offer a mathematically sound mechanism to represent uncertainty. Using such a technique (BBNs), assessment of students’ knowledge can be carried out effectively. Visualizing and inspecting BSMs becomes an interesting and challenging task that opens not only the internal representation of the student’s knowledge, but also the mechanisms to update it for the teachers, students or others interested in knowing more about the student’s representation within the system. VisNet – Visualizing Bayesian Belief Networks Previous work on how to visualize Bayesian models showed how a graphical representation of a Bayesian model in conjunction with different visualization techniques facilitates understanding of cause-effect relationships among nodes, marginal probabilities, changes in probability, and propagation of beliefs throughout the model (Zapata-Rivera et al., 1999). Figure 1 shows a screen shot from VisNet, an environment for experimenting with different visualization techniques for BBNs. The Bayesian network in the figure represents a popular and simple textbook example of a Bayesian network (the tampering network). Marginal probability of nodes is represented using different visualization techniques, in this case with spheres of varying size and colour. With VisNet, it is possible to observe changes in probability of different nodes (that is, to gain new evidence) and, through computer animation, to visualize how probability values subsequently change with propagation through the network. Moreover, it is possible to choose which kind of animation and which visualization technique (or combination of them) to use in the process. VisNet also allows the visualization of a sequence of changes resulting from a set of observations (a collection of new evidence).
J.D. Zapata-Rivera & J.E. Greer/Interacting with Inspectable Bayesian Student Models
5
VisNet offers several widgets to visualise and inspect BBNs. Using different widgets, it is possible to navigate throughout the model and focus on specific regions. Suppose one observes that a specific node is suddenly believed to be true. One can then visualize how this change in belief is propagated throughout the model. VisNet was implemented using C++, SMILE (a Bayes net library) (SMILE, 1998), OpenGL (Mesa libraries) (Paul, 1998), and Togl (a tk widget) (Paul & Bederson, 1998). VisNet can use different BBN formats, including: dsl, dsc, net, dne, and erg. The present version runs on Sun Solaris and windows platforms. VisNet also serves as an authoring and tuning tool for Bayesian Belief Nets. Although there are several other authoring tools for BBNs (i.e. GeNIe©-Decision Systems Laboratory, Huging© Hugin Expert A/S, MSBN© Microsoft belief networks, and others), VisNet focuses on the use of different visualization techniques (colour, size, proximity –closeness, link thickness) and animation (node by node animation and continuous animation) to represent changes in probability, and propagation of beliefs. VisNet can be a useful tool for experimenting with and tuning a Bayesian Belief Net as it is being engineered for suitable behaviour.
Fig. 1. VisNet– Using colour and size as redundant cues to represent marginal probability of each variable being true after Tampering has been observed
ViSMod – Visualizing and Inspecting Bayesian Student Models ViSMod, an extended version of VisNet, provides a flexible architecture where students and teachers can create their own views of a student model by choosing nodes they want to inspect from the Bayesian network representing the student model. Our system assumes the belief net
6
J.D. Zapata-Rivera & J.E. Greer/Interacting with Inspectable Bayesian Student Models
backbone structure for student models proposed by Reye, which covers content and social attributes in a three-level structure (Reye, 1996 1998). The first level (concept level) covers a prerequisite structure of concepts. This level corresponds to a network or hierarchy of concepts of the domain overlaid with information about the student’s knowledge on each concept. The second level consists of a set of topic clusters directly related to each of the nodes from the first level. These nodes are pieces of evidence that influence the knowledge levels of the concepts of the first level (e.g. self assessment nodes, teacher assessment nodes or evidence provided by the system), and the third level holds global nodes that represent general characteristics of the student that affect his/her learning process (e.g. eagerness and helpfulness). Although the computational complexity of BBNs is NP-hard, special configurations of nodes such as the belief net backbone structure can be used to reduce the computational complexity through local propagation of beliefs and independence assumptions. This is possible by using concepts such as d-separation (Pearl, 1988) and barren nodes (Shachter, 1986) to limit the scope of propagation in the model. The belief net backbone structure also provides a standard methodology to create BSMs (Reye, 1998). Figure 2 gives a general idea of how these three levels could be represented using a Bayesian student model in the area of the biology of cells. Although Figure 2 only shows one cluster of nodes (assessment nodes) associated with TheCell node, each of the nodes of the topic hierarchy (first level) has a similar cluster of assessment nodes connected to it. The third level (social aspects of learning) contains global variables that are relevant to each of the nodes of the topic hierarchy. Although Figure 2 shows that the General_Aspects node is connected to the Student_Assessment node from the second level, it has actually been connected to each of the nodes of the first level directly (see Figure 6). Figures 3 and 4 present two different possible views of the model according to the interests of different types of users. A multiple-view platform is particularly useful to determine which components of the model are interesting for students and teachers and which components should be available to students for further visualization or inspection. By using their own views, teachers and students can select and visualize groups of nodes that are significant to them in a particular situation. For example, teachers may be interested in knowing how eager or helpful a student is, or how certain behaviour corresponds to student knowledge on a specific topic. On the other hand, students can visualize how their interests and claims are taken into account to assess their knowledge on a specific topic. A graphical representation of student models helps teachers to determine learning problems on a specific topic for a student or group of students. Teachers may find this information useful to plan changes in their teaching strategies and variations in their lesson plans. Conditional probabilities for nodes in the Bayesian student model can be defined by the teacher following an approach that uses qualitative descriptions of the strength of the relationship between a child and its parents. This approach is presented in the section “Inspecting Bayesian Student Models with ViSMod”, using as an example, nodes of the first level (concept level) of the backbone model. By default parents influence a child using the same level of strength.
J.D. Zapata-Rivera & J.E. Greer/Interacting with Inspectable Bayesian Student Models
7
Fig. 2. ViSMod. A sample three-level backbone structure. The first level shows a hierarchy of concepts in the area of biology cell. The second and third levels have a common structure across several domains
Fig. 3. Sample student view
Fig. 4 Sample teacher view
8
J.D. Zapata-Rivera & J.E. Greer/Interacting with Inspectable Bayesian Student Models
ViSMod implements several widgets to visualise and inspect BSMs (see Figure 5). For example, it is possible to overlay the model with information from a particular student by selecting a student observations file and loading it into the system (load button). Using this feature of ViSMod it is possible to animate the student model with observations made at different points of time. The current version of ViSMod can read this information from text files or from a database. By checking on “scrolling up-down”, “left-right”, and “near-far”, it is possible to navigate throughout the model and focus on specific regions. The widgets “observe node” and “clear evidence” allow students to suppose that a specific node has been observed (believed to be true) and visualize how this change of belief is propagated throughout the model. For effects of visualization, using the view control, students can choose to show or to hide the system’s or the teacher’s beliefs, their own beliefs (student opinions), and general social aspects of learning (third level in the backbone structure). Figure 5 shows a BSM in which the assessment level (second level) has been divided into two nodes connected to each of the topic nodes from the first level (i.e. MyOpinionConceptname and SystemConceptname). These two nodes represent the student’s opinion and the system’s/teacher’s opinion about the student’s knowledge on a particular concept. The Bayesian student model presented in Figure 5 was used during an exploratory study in which students added their opinions to the model using self-assessment nodes associated with each concept (MyOpinionConceptname nodes). Teachers, on the other hand, used teacher-assessment nodes to add their opinions about the student knowledge on a particular concept (SystemConceptname nodes). Nodes from the first level (concept level) receive and integrate evidence from both sources. The section “Inspecting Bayesian Student Models with ViSMod” presents some of the graphical interfaces students and teachers used to add their opinions to the Bayesian student model. Figure 6 shows how general social aspects of learning (third level) affect each and every node from the conceptual level.
USING VISMOD An initial Bayesian student model organized according to Reye’s belief backbone structure must be provided to ViSMod. Such a model consists of nodes representing concepts of interest in the domain and directed links indicating influence of one node on another. Probabilities are associated with nodes and strengths of relationships are associated with links. Propagation of probabilities among the nodes, based on observed evidence, is computed according to Bayes rule. For a particular domain, the initial Bayes belief network can be created by the teacher as an overlay on a prerequisite relationship structure or concept map. New nodes and links can be added on any level according to students’ or teachers’ interests. This model (structure information and evidence) can be derived from the student model of a single ITS or from distributed models of a students from various ITSs or components. One of the main problems found when using BBNs is the intense knowledge engineering effort of specifying prior and conditional probabilities (Villano, 1992). In order to facilitate inspection and understanding of Bayesian belief student models by students and teachers, custom interfaces have been implemented. Using such interfaces, it is possible to avoid direct manipulation of probabilities and integration of new evidence.
J.D. Zapata-Rivera & J.E. Greer/Interacting with Inspectable Bayesian Student Models
9
The biology cell network shown in Figure 5 and 6 was constructed by a teacher based on the curriculum of a biology class for fifth grade students in an elementary school in Colombia. The teacher used several textbooks to define an initial prerequisite structure of concepts. Students’ opinions, teachers’ opinions and general social aspects of learning (second and third levels of the backbone model) can be used across several domains. As mentioned before, special interfaces were developed to allow students and teachers to interact with second and third level nodes (see next section).
Fig. 5. A screenshot of ViSMod showing a fragment of a Bayesian student model in the area of biology cell. It shows how students’ and systems’/teachers’ opinions are taken into account to assess the overall belief of a student knowing a particular concept. The control panel in the lower part of the window shows the set of widgets available to interact with the model.
ViSMod provides three general levels of mastery in their models (i.e. beginner, intermediate and expert). Each level includes information about prior and conditional probabilities according to the level of knowledge. Initial probability values are adjusted using the results of preassessment quizzes carried out by the teacher prior to the use of ViSMod. For simplicity the inspectable interface of ViSMod summarizes the three mastery levels into a single coloured node – giving the appearance of a single binary-valued knowledge level with an associated probability (size and colour).
10
J.D. Zapata-Rivera & J.E. Greer/Interacting with Inspectable Bayesian Student Models
Students and teachers can visualize the student model using visualization techniques where influence of one node on another or likelihood of a node being known are represented by such things as: colour, size, proximity (closeness), link thickness, and animation. Using ViSMod, it is possible to inspect the model of a single student, compare several students by comparing their models, navigate throughout the model changing focus according to students’ and teachers’ interests, and use several sources of evidence to animate the evolution of a new model. Besides the obvious goal of continuous student assessment, teachers can also be interested in knowing what kind of evidence is being collected in order to detect possible inconsistencies, misconceptions, or gaps in student knowledge. By using ViSMod, it is possible to visualize and distill distributed student models into a single model, to find causes for inconsistencies and refine the model by changing the structure or adjusting probability values of the student model.
Fig. 6. In this screenshot of ViSMod, it is possible to visualise the influence of “GeneralAspects” (social aspects of learning) on each and every node in the model. To get this view of the model, it is necessary to check on the general aspects checkbox on the right part of the control panel (see Figure 5) and rotate the visual representation of the model as desired.
In a typical ITS, students are modelled according to their interactions with the system. Using this information, several decisions are taken inside the system in order to adapt the curriculum to the student. Although this approach has been used in many real applications, traditional student models rarely differentiate between students’ and teachers’ points of view about the model. ViSMod takes into account teacher and students opinions about the model. In addition, different ITSs can connect and update Bayesian student modelling information using a Bayesian student modelling server called SMODEL server (Zapata-Rivera & Greer, 2001). ViSMod can be used to visualize BSMs maintained by SModel server. SModel provides several services to a group of agents in a CORBA platform. Using ViSMod it is possible to keep track of the changes made to a Bayesian student model by different ITSs. Visualization and inspection of student modelling information from different sources is an interesting problem that is being tackled in our continuing research.
J.D. Zapata-Rivera & J.E. Greer/Interacting with Inspectable Bayesian Student Models
11
Inspecting Bayesian Student Models with ViSMod Students and teachers can create their own views in order to visualize and inspect the student model without changing the internal representation of the model. Using their own views, it is possible to change probability values and even add or remove nodes graphically. These views can be used as an important element to promote reflection, to engage students and teachers in interesting discussions about the student model, and to use the results of these reflective activities to refine their models. Students can agree or disagree with the information shown in the model. ViSMod aims to support a dialogue between the student and the teacher based on the model. This model includes information about what the student thinks about his/her level of knowledge and the teacher’s/system’s view of the student. These discussions can result in changes to the underlying structure of the system’s representation of beliefs and a more accurate version of the student model. In addition, social aspects of learning have been included in the model in order to situate the model in a learning context that can influence the learning process directly or indirectly. When the model maintained by the system differs in some way from the model the student or the teacher expects, the capabilities of ViSMod to support the creation of what-if scenarios allows students and teachers to experiment with the model and refine it. Using their own views, students and teachers can create what-if scenarios by choosing nodes upon which to focus, by changing probabilities, and by adding new evidence without permanently changing the internal state of beliefs. Students and teachers can adjust and experiment with their views in order to create a model that reflects their perception of the learning process with high fidelity. Those scenarios are an important element to find conflicts between what the student and the system may believe about the student’s knowledge state. For example, students can change estimates of their own knowledge of concepts in order to express their perceived level of knowledge on said concept. It is important to notice that students should be strongly encouraged to explain and even justify their changes. ViSMod interfaces provide a textbox and a set of choice questions in which students can defend their position about changes made to the model. By including explanations in the model, the teacher will be able to initiate a dialogue on the basis of the explanation given by the student. Teachers can comprehend better the causes for disagreement and work on the resolution of conflicts together with the student. What-if scenarios result from the interaction of a human with the student model. For example, students can change their level of knowledge on a particular concept and check how their changes affect the overall model. If the student decides that this is the way the model should be, he/she can move to a different area of the model or can share his/her model with the teacher. Each scenario is just an example of the many possible ways students can interact with the model in order to enhance their learning. A What-if scenario corresponds to a possible state of the model that propitiates reflection and interaction with other sources of knowledge. In order to conciliate different views of the model it is necessary to include other actors (i.e. teacher, artificial or human peers) and/or additional sources of information. Figure 7 shows an interface students use to inspect/change their opinion about their level of knowledge on a particular concept. In this case, the node being inspected is “Nucleolus”. The student believes that he/she has very good knowledge about nucleolus. The student should explain why he/she believes so by writing the reasons in the textbox and checking any of the
12
J.D. Zapata-Rivera & J.E. Greer/Interacting with Inspectable Bayesian Student Models
options that appear in the lower part of the window. The upper frame of the window shows the aggregate knowledge estimate value, the estimate value of social aspects of learning and the system’s/teacher’s view of the student’s knowledge on nucleolus. Figure 8 depicts the systems/teachers’ beliefs about the student knowledge on a particular concept and Figure 9 shows the student’s social aspects. Teachers can modify these values (Figures 8 and 9), while students can only visualise the teachers’/systems’ opinions (Figure 8). Student access to social aspects of learning (Figure 8) is left to the teachers’ discretion.
Fig. 7. Different views of the student’s knowledge on Nucleolus
In an effort to reduce the complexity of eliciting prior and conditional probability tables (CPTs), an approach that uses an additive model of separable degrees of influence from parents to child has been used in ViSMod. The approach presented in this section maps qualitative degrees of influence to CPTs so that can be used with any of the existing algorithms for BBNs. A similar approach is also used by Lacave and Diez (2002).
J.D. Zapata-Rivera & J.E. Greer/Interacting with Inspectable Bayesian Student Models
Fig. 8. The system’s/teacher’s view of the student knowledge on Nucleolus
13
Fig. 9. The student’s general aspects (social aspects of learning)
Related research in this area includes qualitative probability networks proposed by Wellman (1990) and extended by other authors such as Druzdzel and Henrion (1993). Although in qualitative probability networks degrees of influence between each pair of variables in the network are assigned, qualitative probability networks do not map these degrees of influence to actual conditional probability tables (CPTs). Instead, qualitative probability networks implement their own algorithms to propagate evidence using just the degrees of influence (i.e. positive or negative, strong, medium and weak). Figure 10 shows the interface used to change conditional probabilities in a Bayesian student model. This is made by clicking on a link and choosing the degree of influence of one node upon another. The kind of influence can be positive or negative with three different degrees of strength (strong, medium, and low). Every time a link is modified, its conditional probabilities are updated to reflect the new type of influence. Each type of influence is represented by a blue or red arrow. Red arrows (arrows on the left) represent a positive influence and blue arrows (arrows on the right side) a negative influence. Three different arrows represent the three degrees of influence. In the figure, the concepts ‘Nucleolus’ and ‘Nucleus’ are related by a strong positive influence. It means that knowing ‘Nucleolus’ concept has a strong positive effect in knowing the concept ‘Nucleus’. Negative influences can be used to represent the effects a misconception has on a specific topic. That is, if it is believed that a student is in a particular state (misconception), this
14
J.D. Zapata-Rivera & J.E. Greer/Interacting with Inspectable Bayesian Student Models
can influence in a negative manner the belief that this student knows a concept directly related with this kind of misconception. Using the graphical interface presented in Figure 10 it is possible to define degrees of influence assuming that evidence from one of the parent’s states has been observed (i.e. evidence that the student knows the concept ‘Nucleolus’). However, we are experimenting with graphical interfaces that allow the teacher to select and specify degrees of influence for different states of the parent.
Fig. 10. Influence relationship between nodes In order to create conditional probabilities out of qualitative descriptions of the strength of the relationship, our approach adds weights based on the number of parents and the kind and the strength of the relationship. As a simplified example, let Nucleolus, Chromosomes and Nucleus be three binary variables (state1 = knows and state2 = doesnotknow) where Nucleus is influenced by Nucleolus and Chromosomes (Nucleolus->Nucleus and Chromosomes->Nucleus). Positive and negative relationships with different degrees of strength could be defined between Nucleolus and Nucleus and between Chromosomes and Nucleus. Depending on the kind of evidence coming from a parent (i.e. evidence of a particular parent’s state) and how it affects the child, positive
J.D. Zapata-Rivera & J.E. Greer/Interacting with Inspectable Bayesian Student Models
15
and negative relationships are defined. In our case, for example, a positive relationship between Nucleolus and Nucleus means that in the presence of evidence of a particular student knowing Nucleolus, the probability of the student knowing Nucleus will increase. Similarly, evidence of the student not knowing Nucleolus will increase the probability of the student not knowing Nucleus. On the other hand, a negative relationship between Nucleolus and Nucleus means that there is an inverse relationship between the variables. Continuing with our example and assuming positive relationships, we determine the weights associated to each degree of influence. First, a threshold value is associated with each degree of influence. These threshold values correspond to the highest probability value that a child could reach under a certain degree of influence of its parents (i.e. assuming that Nucleolus and Chromosomes have positive strong relationships with Nucleus, evidence of the student knowing Nucleolus and Chromosomes will produce a conditional probability value of 0.98 of the student knowing Nucleus). Initial thresholds values were defined by the researcher based on experience with implementing Bayesian models and analysing relationships between variables. However, for future use of ViSMod, threshold values can be initialized by the teacher or by the knowledge engineer. The corresponding weights are obtained by subtracting a base value (1 / number of parents, 0.5 in our case) from the threshold value associated to the degree of influence (i.e. threshold value for strong = 0.98) and dividing the result by the number of parents (i.e. (0.98 - 0.5) / 2 = 0.48 / 2 = 0.24). The base value represents the conditional probability value that will be assigned when no influence from parent nodes is available. Table 1 presents threshold values and weights used in our example. The value a = 0.02 leaves some room for uncertainty when considering evidence coming from positive strong relationships. Table 1 Threshold values and weights with two parents
Degree of influence Strong Medium Weak
Thresholds
Weights
1-a = 1 – 0.02 = 0.98 0.48 / 2 = 0.24 0.8 0.3 / 2 = 0.15 0.6 0.1 / 2 = 0.05
In our case, let’s assume that Nucleolus and Chromosomes have positive strong relationships with Nucleus and there is evidence that the student knows Nucleolus and Chromosomes. That is, weights will be added to the conditional probability table of Nucleus every time Nucleolus = knows or Chromosomes = knows. For example, the conditional probability value associated with Nucleus given that there is evidence of Nucleolus = knows and Chromosomes = knows is 0.98. This value is obtained by adding to the base value the weights associated with Nucleolus and Chromosomes (0.24 each). Table 2 shows a complete conditional probability table for this example.
16
J.D. Zapata-Rivera & J.E. Greer/Interacting with Inspectable Bayesian Student Models
Table 2 CPT for two parents with positive strong relationships
Nucleolus Chromosomes Nucleus knows doesnotknow
Knows 0.98 0.02
Knows Doesnotknow 0.74 0.26
Doesnotknow knows Doesnotknow 0.74 0.5 0.26 0.5
P(Nucleus= knows | Nucleolus= knows & Chromosomes= knows) = 0.5 + 0.24 + 0.24 = 0.98 P(Nucleus= doesnotknow| Nucleolus= knows & Chromosomes= knows) = 1 - 0.98 = 0.02 P(Nucleus= knows| Nucleolus= knows & Chromosomes= doesnotknow) = 0.5 + 0.24 = 0.74 P(Nucleus= doesnotknow | Nucleolus=knows & Chromosomes= doesnotknow) = 1 - 0.74 = 0.26 P(Nucleus= knows | Nucleolus= doesnotknow & Chromosomes= knows) = 0.5 + 0.24 = 0.74 P(Nucleus= doesnotknow | Nucleolus= doesnotknow & Chromosomes= knows) = 1 - 0.74 =0.26 P(Nucleus= knows | Nucleolus= doesnotknow & Chromosomes= doesnotknow) = 0.5 ** P(Nucleus=doesnotknow |Nucleolus= doesnotknow & Chromosomes= doesnotknow)=1-0.5=0.5 Since the expert has not provided any information about what to do when there is evidence of Nucleolus = doesnotknow and Chromosomes = doesnotknow, no value has been added to the base value (0.5 **). However, one expects to get a high conditional probability value of Nucleus = doesnotknow when Nucleolus=doesnotknow and Chromosomes=doesnotknow, a possible alternative would be to use P(N u c l e u s = knows | Nucleolus=doesnotknow & Chromosomes=doesnotknow) = 0.02 and P(Nucleus= doesnotknow | Nucleolus=doesnotknow & Chromosomes=doesnotknow) = 0.98 assuming that a positive strong relationship also occurs when Nucleolus=doesnotknow and Chromosomes=doesnotknow. Table 3 shows this conditional probability table. Table 3 Alternative CPT for two parents with positive strong relationships
Nucleolus Chromosomes Nucleus knows doesnotknow
Knows 0.98 0.02
Knows doesnotknow 0.74 0.26
Doesnotknow knows Doesnotknow 0.74 0.02 0.26 0.98
Using this approach it is possible to generate initial conditional probability tables for nodes with any number of parents and different degrees of influence assuming that the expert defines degrees of influence using one kind of evidence (i.e. evidence coming from one of the parent’s states). However, when the expert defines degrees of influence for more than one of the parents’ states, adding weights could result in ties, which could generate inconsistent CPTs. In such cases, one could ask the expert which parent should be used in case of ties (i.e. which variable prevails). This extra parameter can be used to solve conflicting situations. Figure 11 presents an example of the conditional probabilities that lie behind different qualitative levels of influence for a simple Bayesian network. The figure shows a small Bayesian network with three nodes (‘Nucleolus’, ‘Chromosomes’, and ‘Nucleus’.) ‘Nucleus’ is influenced
J.D. Zapata-Rivera & J.E. Greer/Interacting with Inspectable Bayesian Student Models
17
by ‘Nucleolus’ and ‘Chromosomes’ concepts. Conditional probabilities for ‘Nucleus’ are displayed when ‘Nucleolus’ and ‘Chromosomes’ vary their level of influence (positive strong, positive medium and positive weak). This example shows how these interfaces can be used to interpret positive influences as conditional probabilities in a Bayesian belief network without having to assign prior and conditional probabilities directly. Although this is a relatively simple case with positive influences in a small network, similar characterization can be done using negative influences and more complicated network structures.
Nucleolus
Chromosomes
‘Nucleolus’ and ‘Chromosomes’ have positive medium influence. Conditional probabilities for ‘Nucleus’: Nucleolus
Knows Does not Knows Chromosomes know
Nucleus
Nucleus
Nucleolus
Chromosomes
0.87
0.65
0.65
0.2
Does not know
0.23
0.35
0.35
0.8
‘Nucleolus’ (positive strong influence). ‘Chromosomes’ (positive medium influence). Conditional probabilities for ‘Nucleus’:
know
Nucleolus
Nucleus
Chromosomes
know
Knows
Nucleolus Knows Does not Chromosomes Knows Nucleus
Does not know Knows Does not
Does not know Knows Does not know
Knows
0.89
0.74
0.65
0.11
Does not know
0.11
0.26
0.35
0.89
‘Nucleolus’ (positive strong influence). ‘Chromosomes’ (positive weak influence). Conditional probabilities for ‘Conditional statements’: Nucleolus Knows Does not Chromosomes Knows know
Nucleus Nucleus
Does not know Knows Does not know
Knows
0.79
0.74
0.55
0.21
Does not know
0.21
0.26
0.45
0.79
Fig. 11. Conditional probabilities using different degrees of influence
Distributed Bayesian Student Models in ViSMod Data for student models can be obtained and processed using software systems (such as ITSs) from widely diverse sources distributed across the Internet. In fact, a student model can itself be distributed. This requires a modelling technique that can store student model data in a distributed fashion and at the same time provide a common inference mechanism. ViSMod provides a flexible architecture for visualizing distributed Bayesian student models. Figure 12 shows how ViSMod is organized to use a student’s information from three software
18
J.D. Zapata-Rivera & J.E. Greer/Interacting with Inspectable Bayesian Student Models
applications derived from the matchmaker component of I-Help (Vassileva et al., 1999), an online testing system named Dogmatix (Kumar & Yellanki, 1997), and a web-based discussion forum named CPR (Bishop, 1998). ViSMod allows visualization of student models using different levels of granularity, and integrating several sources of evidence. A Bayesian student model could integrate information from any telelearning system that has a model of the student. It is especially useful in systems like I-Help, which integrate student model information form several sources. With ViSMod, students and teachers can visualize and inspect aggregate models maintained by the system. VisMod can be used to create and maintain different kinds of student model views, to determine the effectiveness of a particular application in maintaining an accurate representation of the student, and to integrate evidence from various sources to be used for various purposes.
ViSMod
Fig. 12. ViSMod – Visualizing student models from several information sources
Using ViSMod it is possible to integrate evidence from several sources into a single model. The combination of student models relies on the assumption that there is a common ontology among the various student model fragments (segments of a general model with some degree of overlapping) and that all of the distributed models were represented as Bayesian belief nets. Figures 13, 14, and 15 show three different fragments of a student model. CPR’s Bayesian model (Figure 13) estimates the student’s knowledge about the biology cell based of his/her knowledge on the nucleus and its parts. I-Help’s Bayesian model (Figure 14) estimates the
J.D. Zapata-Rivera & J.E. Greer/Interacting with Inspectable Bayesian Student Models
19
student’s knowledge about the biology cell based of his/her knowledge on the cytoplasm and its parts. DogMatix’s Bayesian model (Figure 15) uses the student’s knowledge on cell membrane to estimate his/her knowledge on the cell. Figure 16 shows how ViSMod combines student model information –structure and evidence- from all three applications in a single structure for further visualization and inspection. This process is done by connecting the segments of the network based on common nodes (i.e. TheCell). That is, for each common node a new link is added and the conditional probabilities of the common node are changed to reflect the new evidence that comes from the new segment. In our example, TheCell node appears on different model fragments with different parents, the resulting model contains a link from each of the parents (Figure 16). By combining levels of strengths of each parent that affects the common node (i.e. TheCell) the conditional probabilities tables for each node is computed. Our work in this area has shown that such combinations can lead to unstable Bayes net structures. That is, when contradictory links are introduced, when arrows become reversed, and/or when cycles are introduced. This approach has been useful to integrate and keep track of different segments of the model. It assumes that the maximum degree of overlap between segments is one node. This rather simplistic combination of multiple distributed student models illustrates the capacity of ViSMod to assist with visualization and inspection. But it also points out the incredible complexity that may arise when trying to integrate distributed student models in a realistic setting. Future work in this area will be focused on combining complex Bayesian structures with overlapping segments and addressing issues such as what to do when the resulting network becomes unstable.
Fig. 13. CPR student model
Fig. 14. I-Help student model
In summary, our approach with ViSMod makes possible visualization and inspection of Bayesian student models and provides a means for the creation of collaborative student models. By opening the student model, students, teachers, and the system collaborate to improve the accuracy of the model and the quality of help provided by the system.
20
J.D. Zapata-Rivera & J.E. Greer/Interacting with Inspectable Bayesian Student Models
Fig. 15. DogMatix student model
Fig. 16. Combined student model
Some of the perceived benefits that ViSMod provides to students and teachers are: • A graphical representation of the student model makes it easier for students to understand Bayesian student models. •
A tool that supports multiple views of the student model makes it possible to inspect, modify and create interesting representations of the learning process.
•
By allowing inspection of student models and the creation of what-if scenarios, ViSMod aims to support students’ reflection, knowledge awareness, and refining of student models.
•
Finally, ViSMod allows visualization of distributed BSMs with different levels of granularity using several sources of evidence.
J.D. Zapata-Rivera & J.E. Greer/Interacting with Inspectable Bayesian Student Models
21
The degree to which these benefits are actually realized by learners and teachers is an empirical question and the remainder of this paper aims at providing preliminary evidence to support our claims that ViSMod provides a useful learning environment.
EVALUATION This section reports on two different studies. The first one, a usability study was conducted at the University of Saskatchewan with ten graduate students as participants. This study was focused on assisting students with understanding general Bayesian concepts using different visualization techniques. The second one, a larger-scale exploratory study was carried out in a public school in a Colombian town. Participants were six teachers and 110 children between ten and twelve years of age. Children and teachers had the opportunity to interact with BSMs in different contexts. Usability Study – General Bayesian Network Concepts A usability study was conducted with the visualization of causality representations in BBNs using the visualization features of ViSMod. Spatial order, colour, size, proximity (closeness), link thickness, and animation were the visualization techniques evaluated by the participants. After a short explanation about cause-effect relationships and directed acyclic graphs (DAG), ten graduate students were asked to perform a sequence of tasks to determine the efficacy of each of the visualization techniques. For example, in the case of spatial ordering, participants were asked to select the correct causal sequence from three different layouts of a single Bayesian Network. One of these layouts (the one preferred by students) was a layered drawing in which causes were placed first and their immediate effects directly underneath. This arrangement makes the graph easy to read (Top-down) from causes to effects. During the task labels were hidden, so participants could relate causes only by means of the direction of the arrows. Participants were asked for main causes (origin of causality on each net). They also explained the network verbally in order to illustrate their understanding of its content. General comments about how the spatial ordering was useful or confusing to them were also recorded. In the case of colour and size techniques, participants were asked to select the three more probable nodes (marginal probability), and to give general comments about how colour or size techniques were useful to them. The closeness technique was tested using animation when one of the nodes was observed to be true and propagation of belief was performed through the network. During the test, animation was used to show how the network was affected by new evidence. The animation technique was used to show changes in probability with a single visualization technique and combination of techniques. Participants answered specific questions such as “what was (were) the event(s) observed”, “how strong was the effect (big, small, or no effect) on the rest of the nodes”, and general questions like “which kind of animation (continuous or node by node) was better to represent probability propagation”. In addition, participants’ comments and suggestions were carefully studied to determine useful extensions to VisNet. Some of the observations recorded in this study were: • Spatial order (top-down from causes to effects) was chosen as an appropriate way to show cause-effect relationships. Participants were able to understand the structure of
22
J.D. Zapata-Rivera & J.E. Greer/Interacting with Inspectable Bayesian Student Models
the BBNs shown to them (meaning of nodes and links between them) using a top down ordering from causes to effects. •
Participants preferred size over colour to represent marginal probability. They argued that changes in size are easier to perceive than changes in colour intensity or hue.
•
Combinations of techniques appear to be clearer than a single technique. Participants chose size and colour as a good combination to represent marginal probability (size) and strength of a relationship (colour). This result corroborates existing evidence of the use of redundant clues in visualization systems.
•
For large networks, which are very sensitive to changes in size and position of the nodes, colour is a better alternative.
•
Closeness of nodes proved to be an interesting and powerful way to show probability propagation and changes in probability.
•
Finally, animation was useful for representing probability propagation; especially node by node animation, which was preferred because it shows both the sequence of Bayesian belief updating and probability propagation.
Future evaluation efforts will be designed to examine scaling up issues, such as: • expanding and collapsing nodes when using bigger graphs (containing over 50 nodes) •
changing focus to specific regions of the model,
•
using different visualization techniques on specific areas of the model, and
•
comparing models by showing each model on a transparent layer.
More information about this usability study can be found in (Zapata-Rivera et al., 1999). Exploratory Study – Interacting with Bayesian Student Models using different guidance mechanisms Recent findings show that students are able to report their problem-solving knowledge more accurately by interacting actively with their student models. In a participative learning modelling approach, changes in students’ behaviour indicated evidence of student’s reflection and knowledge awareness (Morales et al., 2001). Dimitrova et al. (2001) explored interactive open student modelling (IOLM) in which the student’s knowledge is challenged in order to encourage a negotiated diagnostic process. In this approach, negotiated assessment is enhanced by allowing the computer to choose among various diagnostic strategies in order to guide a constructive dialogue process with the student. Dimitrova et al. reported that the quality of the model improved and there was evidence of reflective learning among participants. Many systems employ different mechanisms to present and to support human interaction with the student model. But can we expect students to learn and reflect on their knowledge by letting them browse freely through the model? Should we detect potential conflicts between the student’s and the system’s view of the model and point them out to the student for further interaction? Could we just design a simple general protocol that students can follow during their interaction with the model? Is there a benefit of having artificial guiding agents directing the
J.D. Zapata-Rivera & J.E. Greer/Interacting with Inspectable Bayesian Student Models
23
student’s interaction with the model? How does the interaction with the model change when the teacher is involved in the process? We explore the effects of employing various levels of guidance and support (guidance mechanisms) in the way students interact with inspectable BSMs (i.e. following a protocol, interacting with human peers and artificial guiding agents, interacting with the teacher, and exploring the model as part of a group.) We present the study design and results of an exploratory study carried out with fifth grade students who interacted with different configurations of inspectable student modelling environments. A study focusing on how students interact with BSMs using different guidance mechanisms was conducted at the Joaquín Aristizabal School, a public elementary school in Colombia, South America. Participants were one hundred and ten fifth-grade students between the ages of ten and thirteen, as well as six teachers. The topic domain was the biology cell. In this study we used two different inspectable student modelling tools (i.e. ViSMod and ConceptLab) in conjunction with various guidance mechanisms (Zapata-Rivera & Greer, 2002). ConceptLab is a knowledge construction and navigation system that employs conceptual maps overlaid with values from the BSM to represent the student. The rest of this paper presents the results concerning the use of ViSMod. During a session of forty-five minutes students were told about the biology cell, its parts, their function and location. Students had the opportunity to visualize cells of animals and plants using pictures from books and from the web. In addition, pictures of deformed cells (e.g. cancer) were presented to students. Right after the introduction to the biology cell, students were told about student models and ViSMod. Groups of students were shown some examples of student models using ViSMod and a large display screen. Using a participatory approach, teachers explained to students how to add information to the student model (adding explanations about what they knew on a particular topic and changing levels of knowledge that they believed themselves to possess). Students proved to be quite adept at using the graphical interface mechanisms to update their student models in ViSMod. Artificial guiding agents used in this study (Don Pacho and Doña Rita) were also presented to the students. The nature and use of these agents are described below. The student model was first initialised for each student using the results of a pre-assessment quiz taken by all students. A software tool was implemented to allow a fast generation of crude initial student models to be used within ViSMod. This software tool mapped the outcome of each of the questions of the pre-assessment quiz to the level of knowledge of the concepts involved in the particular question. Once a quiz was marked and fed into the system, it generated a text file that could be read by ViSMod. The use of such a tool was crucial to the success of creating initial values to initialize the student model in this study. Students worked individually, in groups, in dyads with another student (human peer), in dyads with a software agent (artificial peer), or in dyads with the teacher (see Table 4 for a description of each of the scenarios). While using ViSMod, students were able to interact with a predefined Bayesian network that reflected the system’s estimate of their knowledge. Students could change their own level of knowledge on any concept but were required to explain the changes. Teachers acted as facilitators, letting students organise their work and decide the best way to create and/or interact with the model. In addition, teachers became active participants during a debriefing session focussed on negotiated assessment. A team of observers took note of students’ and teachers’ interaction with the student modelling environment. Both students and teachers
24
J.D. Zapata-Rivera & J.E. Greer/Interacting with Inspectable Bayesian Student Models
answered a final questionnaire that covered general and specific questions about the learning activity, general suggestions, and their interaction with student models using ViSMod and the corresponding guidance tools. Table 4 summarises the kinds of scenarios different students and teachers worked through. Five general scenarios were defined in order to test a full range of possible environments based on inspectable student models. Each scenario offered different characteristics such as different activities, different roles for student(s) and/or the teacher, different student modelling tools, and different guidance mechanisms. The 110 students were each assigned to a scenario. Each scenario was replicated a number of times in the study (the last column in the table indicates the number of replications of this scenario that were performed). After an initial group training session and pre-assessment quiz, the students worked within their assigned scenario for one session of one and a half hours. The experiment lasted for one week while all students were run through their assigned scenario. Student allocation to each scenario varied due to limitations of time, human (observers), classroom logistics, and computer resources and also to the issue that we did not want to leave out enthusiastic children who wanted some opportunity to participate. Table 4 Inspectable student modelling scenarios Scenarios Scenario 1
Participants Single Student
Learning Activity The student interacts freely with his/her model.
Scenario 2
Single Student
Scenario 3a
Single student with artificial guiding agent
Scenario 3b
Dyad of students human peers
Scenario 4
Student, teacher
Scenario 5
Group of five students
The student follows a protocol (solving a guiding questionnaire that included general and specific questions about concepts included in the Bayesian student model) while interacting with his/her model. Artificial peer points out interesting aspects of the model. It detects discrepancies between the system and the students’ view of the model, and points them out to the student. The student interacts with his/her model and explains it to his/her human peer who questions him about the model. As a result students can revise the changes made to the student models. The student negotiates the final state of the model with the teacher. During this negotiation process the teacher can ask the student to explain his/her changes to the model. As a result the teacher and the student can update their opinions about the student’s knowledge on the concept(s) that were discussed. Groups of students interact with a group student model and with individual student models of each group member. Different degrees of guidance are also tested in this scenario.
Replications 10 (10 students) 15 (15 students)
11 (11 students) 9 (18 students) 6 (6 students & 6 teachers)
10 (50 students)
J.D. Zapata-Rivera & J.E. Greer/Interacting with Inspectable Bayesian Student Models
25
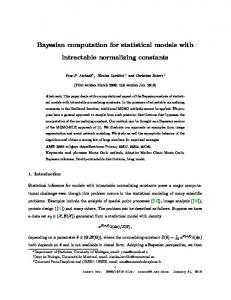
In addition to ViSMod, which was used in all of the scenarios, students in scenario 3a had the opportunity to interact with “Don Pacho” or “Doña Rita”, two artificial guiding agents designed to guide students during their interaction with their student models. “Don Pacho” and “Doña Rita” represent two familiar characters for Colombian children. “Don Pacho” is a mature and gentle countryman who inspires respect and seems knowledgeable in many areas. “Doña Rita” is a young and kind schoolteacher who tries to help and guide students in a positive and gentle manner. Both agents can exhibit basic emotions, such as happiness, sadness, anger, surprise and disgust through verbal and facial expressions based on Ekmans’ model of basic emotions (Ekmans 1999). Although “Don Pacho” and “Doña Rita” exhibited similar behaviour, students were not forced to interact with a particular character. Instead, students were free to select the character they wanted to interact with during the session. There was some suspicion that different students may feel more comfortable with one or the other guide.
Fig. 17. Don Pacho asking the student to explain the difference between his/her assessment and the system’s one on the concept nucleolus. A fragment of a Bayesian student model of the biology cell is shown using ViSMod. It is possible to see how the student’s opinion and the system’s opinion influence each node. In this example, size and colour are used to show marginal probability values representing the student’s knowledge on a particular concept (e.g. 0.95 represents the student’s opinion about his/her knowledge on nucleolus)
Changes in agents’ emotional behaviour are triggered by the student’s level of knowledge on a particular concept, differences between the student’s opinion and the system’s opinion on the student’s knowledge, and the interactions among the student, the model, and/or the agent. Emotional behaviour was programmed into these agents by defining rules over a matrix of possible events and emotions. For example, when the agents discovered potential conflicting concepts (i.e. concepts in which the student’s and the system’s opinion about the student’s knowledge differed significantly), the agents appeared surprised and asked students to elaborate further on those concepts. Similarly, the agents expressed their happiness upon finding that
26
J.D. Zapata-Rivera & J.E. Greer/Interacting with Inspectable Bayesian Student Models
students had added more information to the model. The agents were also sad to see bad performance levels and suggested that the students read more and learn more about a particular concept. In order to motivate students’ interaction with the model, agents questioned students about their model (i.e. which concepts do you know better than the computer thinks you know them? do you agree with the model? do you want to change something?). The agents asked the student for an explanation in cases where the student had changed the level of knowledge, but he/she did not provide any justification. Figures 17 and 18 show “Don Pacho” and “Doña Rita” interacting with a student.
Fig. 18. Doña Rita asking a student if he/she agrees with the current state of the student model
Results The guidance mechanisms explored in this study to help students interact with their models include working alone in an undirected manner (Scenario 1), following a fixed protocol (i.e. solving a guiding questionnaire (Scenario 2)), interacting with another student acting as a human peer (i.e. explaining the model to a peer (Scenario 3b)), interacting with an artificial guiding agent (Don Pacho or Doña Rita (Scenario 3a)), interacting with the teacher (i.e. as part of a negotiated assessment session (Scenario 4)), and exploring the model as a group (Scenario 5). We present results on the number and the type of changes made to the student model by students, changes in the students’ browsing behaviour, and general observations made by the observers and the students on the use of various learning modelling tools.
J.D. Zapata-Rivera & J.E. Greer/Interacting with Inspectable Bayesian Student Models
27
Types of changes made to the student model Students and teachers used the graphical interfaces presented in Figure 7 and 8 to interact with the student model. The number of times students increased their level of knowledge in their models seems inversely proportional to the sophistication of guidance mechanisms offered (see Table 5). Although, scenarios 1, 2 and 5 seem to be similar regarding changes in level of knowledge, a closer look shows that students working in groups (S5) and students following a protocol (S2) revisited a particular group of related concepts (see Table 6 - high frequency of revisited concepts for S2 and S5) and adjusted their knowledge gradually (i.e. by changing level of knowledge, concept domain explanations, and self assessment options). Students interacting freely with the model (S1) increased the level of knowledge of a large number of concepts. In fact, students in S1 made more changes to the model than students in any other scenario. It showed that students in S1 exhibited an unrestrained exploratory behaviour. It is also possible to see that students preferred to increase their level of knowledge rather than to decrease it. Indeed, the only scenario in which increasing and decreasing the level of knowledge are balanced is S4. It seems that during a negotiated assessment session, the frequency in which the teacher and the student decided to increase and/or decrease the level of knowledge was similar. An interesting observation is that decreasing the level of knowledge was often done at the end of the session. It appears that students, knowing that the teacher or a peer could explore their models in the future, decided to decrease their level of knowledge for some of the concepts just before ending the session. However, since in S4 students and teachers worked together, changes to the model were discussed and both estimates of knowledge levels and explanations were added to the model on a concept by concept basis. In fact, the teacher could give his/her feedback every time the student made a change to the model. Thus, changes to the model in S4 respond to a dialogue between the teacher and the student. A dialogue in which participants take turns to talk using the Bayesian student model as a communication means that also keeps record of the negotiation process. Changes in level of knowledge counted for 35% of the total of changes made to the model. Table 5 Average Number of Changes per Student
Scenario S1: Student Freely S2: Student Protocol S3a: Student Art. Agent S3b: Dyad S4: Student Teacher S5: Group
Increases Mean SD 6.13 2.1 6.27 2.5 4.36 2.3 3.97 1.5 2.0 1.1 5.8 2.2
Decreases Mean SD 1.58 1.1 0.4 0.7 1.48 0.4 0.67 0.3 1.5 0.3 1.38 1.0
Total 7.71 6.67 5.83 4.64 3.5 7.25
Explaining the concepts and self-assessment Table 7 shows that the number of explanations added to the model was high for S1, S2 and S5, medium for S3a and S4, and low for S3b. It was noticed that while students explained their
28
J.D. Zapata-Rivera & J.E. Greer/Interacting with Inspectable Bayesian Student Models
models verbally to their human peers (S3b), they were not concerned about registering their explanations with the model. On the other hand, students interacting with Don Pacho or Doña Rita (S3a) registered more explanations. Changes in domain concept explanations counted for 31.4% of the total changes made to the model. Regarding the quality of explanations added to the model, it was found that more complete and detailed explanations were obtained in S4 followed by S3a, S5, and S2. Students in S1 gave a high number of short and incomplete explanations. Since the nature of the interactions with the student model the quantity and quality of explanations added to the student model, it is necessary to carefully design the kinds of learning activities that accompany the use of inspectable student models. Even though some learning activities could be designed to encourage students to document each step with simple and short comments (i.e. S2), others could be designed to capture more complex statements that demonstrate the use of higher order cognitive skills (i.e. S4). Hence, designing appropriate learning activities according to the current learning goals is an important step when interacting with inspectable student models. Table 6 Average Number of Revisited Concepts per Student
Scenario S1: Student Freely S2: Student Protocol S3a: Student Art. Agent S3b: Dyad S4: Student Teacher S5: Group
Mean 0.5 1.47 0.57 0.17 0.5 2.13
SD 0.2 1.2 0.2 0.05 0.06 1.1
Students did use the self-assessment options to justify their level of knowledge on a particular concept. Changes on self-assessment options counted for 33.6% of the total of changes made to the model. As is shown in Table 8, students chose reading, doing research and asking (‘I have read/done research’), and solving assignment and tests (‘I have shown proof’) as the main self-assessment options in most of the scenarios. In addition, it was found that on a few occasions students used the domain content text box (middle frame in Figure 7) to explain the reasons for decreasing their level of knowledge. Thus, it is necessary to offer a more ample range of selfassessment options to the student or a text box that students can use to explain why they are changing the level of knowledge. Table 7 Average Number of Explanations per Student
Scenario S1: Student Freely S2: Student Protocol S3a: Student Art. Agent S3b: Dyad S4: Student Teacher S5: Group
Mean 7.04 6.0 5.36 3.28 4.0 6.5
SD 3.0 3.0 1.7 1.3 0.5 2.1
J.D. Zapata-Rivera & J.E. Greer/Interacting with Inspectable Bayesian Student Models
29
Browsing behaviour As we expected, students’ browsing behaviour became more structured when more sophisticated guidance mechanisms were available. Students in S4 traversed the model following structured paths from subtopics to topics. It appears the teacher influenced this order while negotiating with the student. Interestingly, students in S3b also explained their model to their peers in an organised manner. Initially, students in S3a visited several concepts without an apparent order, but since the guiding agent at some points of the session pointed particular nodes to the student, students followed the agent’s directions and visited potentially conflicting nodes. Students in S1 traversed the model in various ways without an apparent order. As we can see, using different kinds of learning activities during student interaction with Bayesian student models also influences browsing behaviour. Further analyses on how different patterns of browsing behaviour while interacting with inspectable Bayesian student models could be related to student reflection and other cognitive skills should be the subject of future research. Table 8 Average Number of Occurrences per Student
Scenario S1: Student Freely S2: Student Protocol S3a: Student Art. Agent S3b: Dyad S4: Student Teacher S5: Group
I am interested in the topic Mean SD 1.13 0.5 2.47 0.7
I have read/done research Mean SD 3.67 1.1 3.87 0.3
I have shown proof (tests/assignments) Mean SD 2.75 0.7 2.93 0.6
Total 7.54 9.27
0.5
0.05
2.45
1.0
1.5
0.5
4.45
0.06 0.0
0.01 0.0
0.92 1.0
0.1 0.4
1.03 3.0
0.2 0.4
2.0 4.0
3.38
0.9
3.13
1.0
3.63
0.6
10.13
General observations As part of this exploratory study, a variety of interesting observations have been gathered. It is important to recognize that although these issues provide insight on how inspectable Bayesian student models can be used in different contexts, many of them require further research. These preliminary observations have been grouped into the following general categories: interacting with inspectable student models, the resulting Bayesian student model and guiding mechanisms, and negotiated assessment and educational impact. Interacting with inspectable student models •
Listening to students’ voices. It is common to find learning environments in which the teacher has total control and responsibility over assessing students. Test scores are used as
30
J.D. Zapata-Rivera & J.E. Greer/Interacting with Inspectable Bayesian Student Models
the main and sometimes as the only source of evidence to assess students. Sometimes students, especially children, do not have the opportunity to express their opinions about what they know. Even if students get a chance to tell the teacher what they have learnt, it does not guarantee a proper use of this new evidence to update the assessment of the students. Students who participated in this study had the opportunity to update the student model based on what they knew about the biology cell. Being able to tell the system what they know about a particular concept and looking at how this information was taken into account by the system and the teacher to update the student’s assessment using the student model, placed students in a new role in which they became participants in their own assessment. They became jointly responsible for contributing to and maintaining their student models. •
Students were motivated by having the opportunity to interact with the model. Children were really interested in modifying their initial model. They wanted to learn more and to change the model in order to reflect what they knew about different concepts. In addition, students were attracted by the use of different visualization techniques in ViSMod and were intrigued by interacting with artificial guiding agents. “I learnt many things. I can change what is wrong in the model. I have the opportunity to improve my results easily” student comment. “The student said ‘I like this game’. He seems to have fun while adding information to the model to make it better” observer comment. The idea of using a game-like environment to interact with inspectable Bayesian student models has been further explored in The Learning Game (Zapata-Rivera, 2003).
•
Reflecting upon the model facilitates a new learning process. Once students started exploring and interacting with the model, they became interested in knowing more about what the system believes about their knowledge. Students were willing to express their own opinions and were willing to share their opinions with others, especially with their teacher.
•
Students recognised their model as their own construction and were able to express their opinions even when they were contrary to the system beliefs about the student’s level of knowledge on a particular concept. Students not only adjusted their knowledge level upward, but they did realise that sometimes they knew less than what was shown by the system. In at least some of those cases, they reduced the size of the concept and explained why they were doing that.
•
Students seemed to understand and all were able to interact with the model. “The student understands the model. He knows the meaning of the arrows and nodes. He knows how to change the model to reflect what he wants” teacher comment. “Students seem to develop a different attitude about their knowledge. Students recognise what they know and what they do not know. They try to learn about their weak concepts” observer comment.
•
Students invented convincing explanations of probability propagation when new evidence was added to the model.
J.D. Zapata-Rivera & J.E. Greer/Interacting with Inspectable Bayesian Student Models
31
“Since chromosomes is a part of nucleus and I am changing my knowledge of chromosomes, my knowledge about nucleus should also change” student comment. The resulting Bayesian student model and guiding mechanisms •
Did we obtain a better student model? In order to analyse the quality of the final student model we follow the criteria defined by Dimitrova et al. (2001). That is, a better new student model (1) removes inconsistencies from the previous model, (2) represents a wider scope of the student’s beliefs, (3) provides more explanations for the student’s errors, (4) includes more valid information about the student’s knowledge, and (5) minimises the number of invalid assertions about the student’s knowledge. It is clear that our student modelling tools help students to easily locate and remove inconsistencies from their models. Although, students working in scenarios S3a and S4 were guided by an artificial agent and the teacher respectively, which let them find inconsistencies faster that the others, students in all of the scenarios adjusted their models to some degree. This observation adds another criterion in deciding whether the model is better or not, namely ‘student satisfaction’. Participants in our study found both tools useful in giving them a chance to express their opinions about their knowledge and students appreciated the role the tools had on their final assessment. Regarding criterion 2, final student models covered information about the student in a wider range of concepts in all of the scenarios. Regarding criteria 3, 4, and 5, students added explanations, changed the level of knowledge and provided self-assessment information in similar proportions. Thus, students explained their knowledge or lack of it, included valid information, and reduced invalid beliefs about their knowledge. Although the number and quality of students’ contributions to the student model varied from scenario to scenario, in general final student models were considered by teachers and observers to be better than the initial ones based solely on test scores.
•
Social aspects of learning. Although our BSMs contained information about students’ social aspects of learning (i.e. helpfulness, eagerness, and assertiveness), which was provided to teachers, students were not allowed to interact with this information. Teachers, however, were very interested in the idea of including social aspects of learning as part of the model and were also very interested in adding more aspects and modifying the Bayesian model using ViSMod. Further analysis of the effects of letting students interact with this kind of information remains as an open area to be explored.
•
Were artificial guiding agents effective? Artificial guiding agents Don Pacho and Doña Rita attracted the attention and curiosity of students. Although agents had a positive effect in guiding students to particular concepts without forcing them, we believed that their role could be further enhanced by letting the agent offer interesting paths (i.e. paths previously defined by the teacher as part of a learning activity associated with a particular learning goal) and external learning resources. Artificial guiding agents capable of showing emotions are indeed useful to regulate when and how to present feedback given to students while interacting with inspectable student models. In addition, the role of artificial guiding agents will become more important when additional guidance is required for interacting with large student models and partial student models from different domain areas.
32
•
J.D. Zapata-Rivera & J.E. Greer/Interacting with Inspectable Bayesian Student Models
Exploring student group models. In scenario S5 students worked in groups of five and attempted to negotiate among themselves some common view on their knowledge. This activity led to many difficulties in modelling and analysis. In some collaborative scenarios students interacted with the composite student model of the group instead of their own individual student models. Some students felt uncomfortable and had problems trying to convince the rest of the group to change the group knowledge level on a particular concept. Some groups even changed their leader several times in an attempt to create a more stable situation in which everyone could contribute. This observation suggests that students may find it easier to reflect upon their own knowledge profile as opposed to a single group model. It also suggests that special support is needed to help groups to inspect and reflect upon a group model. The second case could be addressed following different paths. For example, it could be necessary to offer special support to students in solving conflicts within the group (Tedesco & Self, 2000), a more refined group modelling approach that considers individual student models could be useful (Hoppe, 1995), special support could be provided to mediate dialogue among students while inspecting the model (Soller, 2001), student’s roles should change dynamically during their interaction (Burton, 1998), or ‘Acting Coach’ agents could be used to support roles based on current tasks and speech acts (Zapata-Rivera & Greer, 1999). In any case, students need special support in creating and interacting with a group view of their knowledge, especially when asked to defend it as a group during a negotiated assessment session.
Negotiated assessment and educational impact •
Dialogue between teacher and students was enhanced by the model. Teachers used the model to find points of disagreement. Some simple questions were sufficient for teachers to understand a student’s position and adjust their assessment. Teachers commented that students were able to express what they really thought. Students were pleased at having the opportunity to tell the teacher what they had learned and let the system and teacher use this information to change their assessment.
•
Teachers valued ViSMod as a tool that supports self and negotiated assessment. Teachers unanimously believed that having the model opened for discussion was useful. Sharing the responsibility of assessment with students (and even parents) could help to solve many misunderstandings between actors in the learning process. “ViSMod is an interesting and novel system in which students, teachers and parents can participate in the evolution of the learning process. Using ViSMod parents will be able to understand the student model and the pedagogical strategies used by teachers to help the students with their particular learning processes” teacher comment. “I am very pleased with the system. Students get interested in learning more by interacting with the system” teacher comment. “Students became interested in knowing more about different concepts. They interact with the model and use its information to direct their own learning. Although I do not know much
J.D. Zapata-Rivera & J.E. Greer/Interacting with Inspectable Bayesian Student Models
33
about computers, I found the system easy to use. I became involved with the system easily” teacher comment. •
Asking students to explain matters. Students asked and read in order to explain why they believed their knowledge level should be different from that determined by the system. They wanted to make their circles big and red (i.e. the nodes in the Bayesian network). Although in some cases they did realise they knew less than what was shown by the system. In those cases, they reduced the size of the concept circles and explained why they were doing that. They wanted to be prepared to explain their actions to the teacher during the negotiation process.
•
Avoiding “I do not know” and “I do not remember” answers. During the pre-assessment quiz students were told they could answer “I do not know” or “I do not remember”. Although they understood they could change this information using ViSMod later, they seemed not to feel secure answering “I do not remember” or “I do not know”. They were used to thinking that answering “I do not remember” or “I do not know” were wrong and some kind of penalty would be associated with such answers.
•
Did students learn while interacting with their student models? Although we did not run a post-assessment quiz, the final state of the model gives us an initial overview of the continuous assessment process that is generated with the interaction of the student with his/her student model. By looking at this interaction and especially by focusing on the number and quality of the explanations provided by students and the self-assessment information obtained, we can say that there was some good evidence of students’ engagement, motivation, and knowledge reflection. A different study focused on using inspectable Bayesian student models to support student reflection has been carried out in The Learning Game (Zapata-Rivera, 2003).
•
Students used books and asked questions. Students were highly motivated during this activity. Teachers reported that the students made good use of books and the number and quality of student questions increased significantly over normal classroom activities. Although one could argue that this can be entirely attributed to the novelty of the experiment, it is important to take into account that students had used other computer programs before and they did really seem to appreciate the opportunity to tell the system what they knew about the domain content.
•
Teachers and researchers were greatly surprised by students’ participation during the whole experiment.
Summarising, using ViSMod students seemed to be able to interact with simple BSMs quite effectively. Propagation of evidence due to changing beliefs or introduction of new evidence did not seem to cause confusion to the students. ViSMod was accepted as a useful tool among teachers and students. Teachers are willing to integrate ViSMod in their teaching. Teachers would also like to use ViSMod with other subject areas and share BSMs with parents and students. Students appreciated the difference between traditional assessment and continuous negotiated assessment using ViSMod. The scenarios tested provided information about how different levels of feedback and several kinds of interactions influence the number and quality of explanations and student
34
J.D. Zapata-Rivera & J.E. Greer/Interacting with Inspectable Bayesian Student Models
browsing behaviour. Although in this exploratory study only a limited number of cases were tested, information gathered shows that learning activities designed to guide students while interacting with BSMs are an important factor in the success of this kind of system. If the goal is supporting student reflection and other cognitive skills and achieving high quality selfassessment, more guidance is an important ingredient. In addition, student model accuracy can be influenced by managing interaction with BSMs. These issues has been explored further elsewhere (Zapata-Rivera, 2003). A general message to take away is that exploring inspectable learning models using different guidance mechanisms results in a variety of effects on both the student and the student model. It is important to take into account the goals of the learning session and the need to have an accurate student model in order to decide which kind of support is more appropriate for a particular situation. CONCLUSIONS ViSMod provides a flexible architecture where students and teachers can create their own views by choosing nodes from a Bayesian student model. Using ViSMod, students can understand, explore, inspect, and modify Bayesian student models. Students interacting with the model may realise what they really know and perhaps use this information to direct their learning process. The creation of what-if scenarios in ViSMod promotes students’ reflection and knowledge awareness. ViSMod offers a practical tool to determine which components of the model are interesting to students and teachers. Students and teachers create, share and discuss interesting representations of learning processes. ViSMod facilitates the evolution of student models by capturing and reflecting the information given by students and teachers during their explorations. ViSMod offers special interfaces for changing prior and conditional probabilities and is able to integrate new evidence graphically. ViSMod facilitates the evolution of student models by capturing and reflecting the information given by students and teachers during their explorations. Interaction with the student model is an important factor in refining the student model. We have experimented with several methods to encourage student interaction with the student model. A general conclusion that arises from this work has to do with guidance in ISM systems. Accurate student models, and thus accurate assessments, seem to be possible using ISMs provided guided interaction with the models is appropriately achieved. The exploratory studies point to this as an important hypothesis that merits further validation. Future work will involve refining ViSMod into an authoring tool for creating, tuning and maintaining distributed Bayesian student models, and providing special support for groups interacting with Bayesian student models. In addition, we would like to explore human interaction with Bayesian student models in which the relationships between a child and parents show several different degrees and types of influence. For example, we are interested in adjusting the degree of influence of different nodes in the student model dynamically, and thus decreasing the degree of influence of the student opinion on a particular concept when the student has lower confidence in his or her judgement.
J.D. Zapata-Rivera & J.E. Greer/Interacting with Inspectable Bayesian Student Models
35
ACKNOWLEDGEMENTS We would like to acknowledge the reviewers for many interesting comments, the members of the ARIES group for many productive discussions as well as the Government of Colombia COLCIENCIAS- and the Natural Science and Engineering Research Council of Canada for financial support. We would like to extend our thanks to graduate students at the University of Saskatchewan, and to teachers, observers, and students at the Joaquin Aristizabal public elementary school in Colombia for their participation in our studies.
REFERENCES Bishop A. (1998). A Case Study of System-Generated Help Responses for the Cooperative Peer Response System. M.Sc. Thesis. University of Saskatchewan, Department of Computer Science. Brna, P., Self, J., Bull, S., & Pain, H. (1999). Negotiated Collaborative Assessment through Collaborative Student Modelling. In Proceedings of the workshop ‘Open, Interactive, and other Overt Approaches to Student Modelling’ (pp. 35-44). AIED’99. Le Mans, France Bull, S., & Pain, H. (1995). ‘Did I say what I think I said, and do you agree with me?’: Inspecting and questioning the student model, In J. Greer (Ed.) Proceedings of AI-ED'95 - 7th World Conference on Artificial Intelligence in Education (pp. 501-508). Virginia: AACE. Bull, S., & Shurville, S. (1999). Cooperative Writer Modelling: Facilitating Reader-Based Writing with Scrawl. In Proceedings of the workshop ‘Open, Interactive, and other Overt Approaches to Student Modelling’ at AIED’99 (pp. 1-8). Le Mans, France. Burton, M. (1998). Computer modelling of dialogue roles in collaborative learning activities. Unpublished doctoral dissertation, Computer Based Learning Unit, The University of Leeds. Collins, J. A., Greer, J. E., & Huang, S. X. (1996). Adaptive Assessment using Granularity Hierarchies and Bayesian Nets. In C. Frason, G. Gauthier, & A. Lesgold (Eds.) Intelligent Tutoring Systems (pp. 569577). Lecture Notes in Computer Science Vol. 1086. Berlin: Springer. Conati, C., Gertner, A.S., VanLehn, K., & Druzdzel, M.J. (1997a). Online student modeling for coached problem solving using Bayesian networks. In A. Jameson, C. Paris, and C. Tasso, (Eds.) Proceedings of the Sixth International Conference on User Modeling (pp. 231-242). New York: Springer-Verlag. Conati C., Larkin J., & VanLehn K., (1997b). A Computer Framework to Support Self-Explanation. In B. du Boulay, & R. Mizoguchi (Eds.) Artificial Intelligence in Education (pp. 279-286). Amsterdam: IOS. Conati, C., Gertner, A.S., & VanLehn, K. (2002). Using Bayesian Networks to Manage Uncertainty in Student Modeling. User Modeling and User-Adapted Interaction 12, 371-417. Dimitrova, V., Self, J., & Brna, P. (1999a) The interactive maintenance of open student models.. In S. P. Lajoie & M. Vivet (Eds.) Artificial Intelligence in Education (pp. 405-412). Amsterdam: IOS Press. Dimitrova, V., Self, J., & Brna, P. (1999b). STyLE-OLM – an interactive diagnosis tool in a terminology learning environment. In Proceedings of the workshop ‘Open, Interactive, and other Overt Approaches to Student Modelling’ at AIED’99 (pp. 25-34). Le Mans, France. Dimitrova, V., Self, J., & Brna, P. (2001). Applying Interactive Open Learner Models to Learning Technical Terminology. In M. Bauer, P.J. Gmytrasiewicz & J. Vassileva (Eds.) User Modeling 2001: 8th International Conference (pp. 148-157). Berlin: Springer. Druzdzel, M. J. & Henrion, M. (1993). Efficient Reasoning in Qualitative Probabilistic Networks. AAAI (pp. 548-553). Ekman, P. (1999). Basic emotions. In T. Dalgleish and T. Power (Eds.) The Handbook of Cognition and Emotion (pp. 45-60). Sussex, U.K.: John Wiley.
36
J.D. Zapata-Rivera & J.E. Greer/Interacting with Inspectable Bayesian Student Models
Hyerle, D. (1996). Visual Tools for constructing knowledge. Alexandria, Virginia: ASCD Press. Hoppe, H. U. (1995). The use of multiple student modeling to parameterize group learning. In J. Greer (Ed.) Proceedings of AI-ED’95 - 7th World Conference on Artificial Intelligence in Education (pp. 234-241). Virginia:AACE. Horvitz, E., Breese, J.S., Heckerman, D., Hovel, D., & Rommelse, K. (1998). The Lumiere Project: Bayesian user modeling for inferring the goals and needs of software users. Fourteenth Conference on Uncertainty in Artificial Intelligence (pp. 256-265). San Francisco: Morgan Kaufmann. Jonassen, D., Beissner, K., & M., Yacci. (1993a). STRUCTURAL KNOWLEDGE. Technique for Representing, Conveying, and Acquiring Structural Knowledge. Hillsdale, NJ: Lawrence Erlbaum Associates. Jonassen, D., Wilson, B., & Cole. P. (1993b). Cognitive Approaches to Instructional Design. In G.M. Piskurich (Ed.) The ASTD handbook of instructional technology (pp. 21.1-21.22). McGraw–Hill. New York,. Also available on-line:http://www.cudenver.edu/~bwilson Jonassen, D., (2000). Computers as Mindtools for Schools. Engaging in critical thinking. NJ: PrenticeHall. Kay, J. (1999). A Scrutable User Modelling Shell for User-Adapted Interaction. Ph.D. Thesis, Basser Department of Computer Science, University of Sydney, Sydney, Australia. Kumar V.S., & Yellanki L. (1997). Dogmatix: A constraints-based online generative testing system on WWW. Version-1: http://www.cs.usask.ca/grads/vsk719/dogmatix/FinalReport. Lacave, C. and Diez, F. J. (2002). Explanation for causal Bayesian networks in Elvira. In Proceedings of the Workshop on Intelligent Data Analysis in Medicine and Pharmacology (IDAMAP-2002), Lyon, France. Martin, J. & VanLehn, K. (1995). Student assessment using Bayesian nets. International Journal of Human-Computer Studies. 42, 575-591. Also available on-line: http://www.pitt.edu/~vanlehn/distrib/journal/HCS95.pdf Morales, R., Pain, H., & Conlon, T. (1999). From Behaviour to Understandable Presentation of Student Models: A Case Study. In Proceedings of the workshop ‘Open, Interactive, and other Overt Approaches to Student Modelling’ (pp. 15-24). AIED’99, Le Mans, France. Morales, R., Pain, H., & Conlon, T. (2001). Effects of Inspecting Learner Models on Learners’ Abilities. In J. D. Moore, C. L. Redfield, & W. L. Johnson (Eds.), Artificial Intelligence in Education: AI-ED in the Wired and Wireless Future, Proceedings of AI-ED 2001 (pp. 434-445). Amsterdam: IOS Press. Muehlenbrock, M., Tewissen, F. and Hoppe, H.U. (1998). A framework system for intelligent support in open distributed learning environments. International Journal of Artificial Intelligence in Education. 9, 256-274. Novak, J. D. (1998). Learning, Creating, and using Knowledge. Concept Maps as Facilitative Tools in Schools and Corporations. Mahwah, NJ: Lawrence Erlbaum Associates. Novak, J. D., & Gowinn, B. D. (1984). Learning how to Learn. Cambridge, England:Cambridge University Press. Paiva, A., Self. J. & Hartley, R. (1995). Externalising student models. In J. Greer (Ed.) Proceedings of AIED’95 - 7th World Conference on Artificial Intelligence in Education (pp. 509-516). Virginia: AACE. Paul, B. (1998). Mesa 3.0. OpenGL libraries. Copyright (C) 1995-1998 Paul, B., & Bederson, B. (1998). Togl - a Tk OpenGL widget Version 1.5. Copyright (C) 1996-1998. Pearl, J. (1988). Probabilistic reasoning in intelligent systems: networks of plausible inference. San Mateo, CA: Morgan Kaufmann. Pearl, J. (1997). Graphical Models for Probabilistic and Causal Reasoning. In A. Tucker (Ed.) The Computer Science and Engineering Handbook (pp. 699-711). Boca Raton, FL: CRCPress.
J.D. Zapata-Rivera & J.E. Greer/Interacting with Inspectable Bayesian Student Models
37
Reye, J. (1996). A Belief Net Backbone for student modelling. In C. Frasson, G. Gauthier, & A. Lesgold (Eds.) Intelligent Tutoring Systems (pp. 596-604). Lecture Notes in Computer Science Vol. 1086. Berlin: Springer-Verlag,. Reye, J. (1998). Two-phase updating of student models based on dynamic belief networks. In B. P. Goettl, H. M. Halff, C. L. Redfield, & V. J. Shute (Eds.) Intelligent Tutoring Systems (pp. 274-283). Lecture Notes in Computer Science Vol. 1452. Berlin: Springer-Verlag. Shachter, R. (1986), Evaluating Influence Diagrams. Operations Research, 34, 871-882. SMILE version 1.0. (1998). Structural Modeling, Inference, and Learning Engine. Decision System Laboratory. University of Pittsburgh. Soller, A. (2001). Supporting Social Interaction in an Intelligent Collaborative Learning System. International Journal of Artificial Intelligence in Education, 12, 40-62. Suthers, D. (2001). Towards a Systematic Study of Representational Guidance for Collaborative Learning Discourse. Journal of Universal Computer Science, 7, 3, 254-277. Tedesco, P., & Self, J. A. (2000). Using meta-cognitive conflicts in a collaborative problem solving environment. In C. Frasson, G. Gauthier & K. VanLenh (Eds.) Intelligent Tutoring Systems (pp. 232241). Lecture Notes in Computer Science Vol. 1839. Berlin: Springer-Verlag. VanLehn, K. & Martin, J. (1997). Evaluation on an assessment system based on Bayesian student modeling. International Journal of Artificial Intelligence in Education, 8. 179-221. Vassileva, J., Greer J., McCalla, G., Deters, R., Zapata, D., Mudgal, C., & Grant, S. (1999). A Multi-Agent Approach to the Design of Peer-Help Environments. In S. P. Lajoie & M. Vivet (Eds.) Artificial Intelligence in Education (pp. 38-45). Amsterdam: IOS Press Villano, M. (1992). Probabilistic Student Models: Bayesian Belief Networks and Knowledge Space Theory. In C. Frasson, G. Gauthier & G. McCalla (Eds.) Intelligent Tutoring Systems, Second International Conference, ITS ’92 (pp. 491-498). Lecture Notes in Computer Science Vol. 608. Berlin: Springer-Verlag. Wellman, M. P. (1990). Fundamental concepts of qualitative probabilistic networks. Artificial Intelligence, 44, 257-303. Zapata-Rivera, J. D. (2003). Learning Environments based on Inspectable Student Models. Ph.D. Thesis. University of Saskatchewan. Department of Computer Science. Zapata-Rivera, J. D., & Greer, J. (1999). Collaborative learning environments based on “Acting Coach” agents. Poster presented at CSCL '99, Stanford, CA. Zapata-Rivera, J. D., & Greer, J. (2001). SMODEL Server: Student Modelling in Distributed Multi-Agent Tutoring Systems. In J. D. Moore, C. L. Redfield, & W. L. Johnson (Eds.) Artificial Intelligence in Education: AI-ED in the Wired and Wireless Future, Proceedings of AI-ED 2001 (pp. 446-455). Amsterdam: IOS. Zapata-Rivera, J. D., & Greer, J. (2002). Exploring Various Guidance Mechanisms to Support Interaction with Inspectable Learner Models. In S. A. Cerri, G. Gouardères, F. Paraguaçu (Eds.) Intelligent Tutoring Systems, 6th International Conference, ITS 2002 (pp. 442-452). Lecture Notes in Computer Science Vol 2363. Berlin: Springer. Zapata-Rivera, J. D., Greer, J.E., & Cooke, J. (2000). An XML-Based Tool for Building and Using Conceptual Maps in Education and Training Environments. In Proceedings of Eighth International Conference on Computers in Education/International Conference on Computer-Assisted Instruction, ICCE 2000 (pp. 755-762). AACE-APC/National Tsing Hua University, Taiwan. Zapata-Rivera, J. D., Neufeld, E., & Greer, J. (1999). Visualization of Bayesian Belief Networks. IEEE Visualization 1999 Late Breaking Hot Topics Proceedings (pp. 85-88). San Francisco, CA.