Interaction Between Strategic and Local Traffic Flow Controls Shon Grabbe* and Banavar Sridhar† NASA Ames Research Center, Moffett Field, CA, 94035-1000 Avijit Mukherjee‡ and Alexander Morando§ University of California Santa Cruz, Moffett Field, CA, 94035-1000
The loosely coordinated sets of traffic flow management initiatives that are operationally implemented at the national- and local-levels have the potential to under, over, and inconsistently control flights. This study is designed to explore these interactions through fast-time simulations with an emphasis on identifying inequitable situations in which flights receive multiple uncoordinated delays. Two operationally derived scenarios were considered in which flights arriving into the Dallas/Fort Worth International Airport were first controlled at the national-level, either with a Ground Delay Program or a playbook reroute. These flights were subsequently controlled at the local level. The Traffic Management Advisor assigned them arrival scheduling delays. For the Ground Delay Program scenarios, between 51% and 53% of all arrivals experience both pre-departure delays from the Ground Delay Program and arrival scheduling delays from the Traffic Management Advisor. Of the subset of flights that received multiple delays, between 5.7% and 6.4% of the internal departures were first assigned a pre-departure delay by the Ground Delay Program, followed by a second pre-departure delay as a result of the arrival scheduling. For the playbook reroute scenario, Dallas/Fort Worth International Airport arrivals were first assigned pre-departure reroutes based on the MW_2_DALLAS playbook plan, and were subsequently assigned arrival scheduling delays by the Traffic Management Advisor. Since the airport was operating well below capacity when the playbook reroute was in effect, only 7% of the arrivals were observed to receive both rerouting and arrival scheduling delays. Findings from these initial experiments confirm field observations that Ground Delay Programs operated in conjunction with arrival scheduling can result in inequitable situations in which flights receive multiple uncoordinated delays.
W
I.
Introduction
ITH the operational deployment of the Traffic Management Advisor at all twenty Air Route Traffic Control Centers in the contiguous United States, the Federal Aviation Administration now has a powerful new capability for scheduling flights into capacity constrained airports. For reference, the Traffic Management Advisor is a decision support tool for efficiently sequencing and scheduling aircraft to an arrival meter fix, final approach fix, and a runway threshold, while taking into account the airport runway configuration, the winds aloft, and aircraft types. The system was designed to maximize the capacity of the airport and the Terminal Radar Approach Control without compromising safety.1 Unfortunately, the local-level traffic flow controls developed by the Traffic Management Advisor are only loosely coordinated with other national- and regional-level traffic flow management initiatives that are also designed to schedule flights into these capacity constrained airports. More importantly the objectives of the national- and local-level controls may be very different. For example, the objective of a Ground Delay Program, which is a national-level traffic flow management initiative, is to mitigate any large-scale, persistent *
Research Scientist, Systems Modeling & Optimization Branch, Mail Stop 210-15,
[email protected], Senior Member AIAA. † Senior Scientist, Aviation Systems Division, Mail Stop 210-10, Fellow AIAA. ‡ Associate Project Scientist, University of California Santa Cruz, Mail Stop 210-8. § Senior Software Engineer, University of California Santa Cruz, Mail Stop 210-8. 1 American Institute of Aeronautics and Astronautics
imbalances between the arrival demand and capacity at an airport. In contrast, the objective of arrival metering, which is accomplished with the Traffic Management Advisor, is to precisely merge and space multiple arrival streams so they arrive at the runway with minimal inter-aircraft spacing. As a result of this loose coupling between these national- and local-level controls, their predicted interactions and integrated impact are not well understood. This can lead to flights being under, over, and inconsistently controlled, which may result in airline schedule disruptions and significant sources of inequity in the National Airspace System. Automation to support the assessment of the interaction of these controls could promote an understanding of these interactions and reduce the adverse effects. In recent years, there have been a number of studies that have reported on the results of experiments that were designed to model the impact of local- and national-level traffic flow management initiatives independent of one another. For example at the local-level, the basic design and the results of an operational field assessment of the Traffic Management Advisor, which is used for arrival flight scheduling, is provided in Ref. 1. In References 2 and 3, an extension of the basic single-Center implementation of the Traffic Management Advisor that is referred to as Multi-center Traffic Management Advisor is described and the results of real-time, operational field assessments are presented. Paralleling these efforts at the national-level, Ref. 4 presented a deterministic model to address the single airport ground holding problem. This work was later extended in Refs. 5-7, for example, to address uncertainty in airport arrival capacity. Also at the national-level, Ref. 8 presented models and algorithms for examining the impact of playbook reroutes on air traffic flows. A comparable body of research that examines the integration and interaction of these national- and local-level traffic management initiatives is lacking from the literature. To address this research gap, an integrated decision support system that consists of NASA’s Future ATM Concepts Evaluation Tool9 and the Traffic Management Advisor1 has been developed. Within this integrated system, the Future ATM Concepts Evaluation Tool was used to model national-level restrictions, such as playbook reroutes and Ground Delay Programs, while airport arrival scheduling was accomplished by the Traffic management Advisor. Incorporating operational decision support tools, such as the Flight Schedule Monitor, into this integrated system to model actual Ground Delay Program was outside the scope of this study. Using this system, experiments were designed and conducted to examine the extent to which flights are assigned multiple uncoordinated delays by both national- and local-level traffic flow management initiatives. Real-world scenarios that are derived from the flight schedule data from May 28 and 29, 2009, Ground Delay Program logs from May 14, 2009 and playbook rerouting logs from September 2, 2009 were used to test the initial implementation of this integrated system. Different dates for the aircraft schedule data and the days on which the traffic management initiatives were implemented were intentionally selected to ensure that control actions implemented in response to these initiatives were not reflected in the flight schedule data. Results are presented in terms of histograms of the distribution of the arrival scheduling delays, comparisons of ground delay program delays versus arrival scheduling delays, and playbook rerouting delays versus arrival scheduling delays. Finally in an effort to validate the experimental results, the modeled arrival scheduling delays are compared with the corresponding delays that were operationally observed. Section II describes the modeling methodology and the software architecture of the integrated decision support capability. A discussion of the Ground Delay Program scenarios, the playbook rerouting scenario, the simulation inputs, and the Traffic Management Advisor settings is presented in Section III. The experimental results of fasttime simulations used to explore the interaction between strategic- and local-level arrival flow management into Dallas Fort Worth International Airport are presented in Section IV. Finally, concluding remarks are presented in Section V.
II.
Modeling Methodology
The major components of the integrated arrival scheduling environment are illustrated in Fig. 1. On the left side of this figure are the system inputs, which consist of user schedules and flights plans and airspace adaptation data. The user schedules were extracted from historical Aircraft Situation Display to Industry (ASDI) data archives that will be described in Section III, while the adaptation data for the “Primary Simulation” system was extracted from the FAA’s Enhanced Traffic Management System (ETMS).10 These system inputs were processed directly by the “Primary Simulation” system that was chosen to be NASA’s Future ATM Concepts Evaluation Tool (FACET).9 Interactions with the FACET system were accomplished via an Application Programming Interface that has been described in previous studies.11 Every twenty seconds, the “Primary Simulation” provides updated state information, x(t), (e.g., latitude, longitude, speed, altitude, and heading) for all aircraft in the simulation. On an hourly basis, x(t) is used to assign strategic-level flow control initiatives (see blue diamond labeled “Strategic Scheduling” and “Strategic Routing” in Fig. 1). For the purpose of this study, these strategic initiatives 2 American Institute of Aeronautics and Astronautics
consisted of either assigning pre-departure delays to flights using a deterministic Ground Delay Program (GDP) model or assigning pre-departure reroutes to flights using a playbook rerouting model. For the first set of experiments that are described in Section III.A, flights were assigned pre-departure delays via a GDP at the nationallevel, while in the second set of experiments that are described in Section III.B flights were assigned pre-departure reroutes at the national-level. In none of these scenarios were flights candidates for both playbook reroutes and predeparture delays. The three boxes that are collectively labeled as the “Ground Delay Program Model” depict the high-level steps associated with the deterministic GDP model. The first step in developing these strategic controls consists of calculating estimated times of arrival (ETAs) for all flights destined for the capacity constrained airport. This set of arriving flights is subsequently partitioned into a set of exempt and non-exempt flights in the box labeled “Identify and Schedule Exempt Flights.” The exemption policy used in this study is GDP scenario dependent and will be described in Section III. Exempt flights are not assigned any pre-departure delay, and the airport arrival slots corresponding to these flight’s ETAs will be considered to be unusable when scheduling the non-exempt flights. Finally, in the box labeled “Schedule Non-exempt Flights” a simple ration-by-schedule heuristic is used to assign a scheduled time of arrival (STA) to each flight based on the planned airport arrival rate. When the airport arrival demand and the reduced airport capacity can be reliably estimated, it may be possible to only perform the steps associated with strategic scheduling once. However, when uncertainty exists in either the forecasted demand or capacity, it may be necessary to revisit the strategic scheduling steps at least on an hourly basis. The controls assigned by the Ground Delay Program Model at time t are labeled u GDP (t) in Fig. 1 and consist of a set of predeparture delays to assign to the Ground Delay Program impacted flights. The two boxes collectively labeled as the “Playbook Rerouting Model” depict the two high level steps associated with the playbook rerouting model. The first step, which is labeled “Identify Pre-departure Rerouting Candidates” in Fig. 1, consists of identifying the subset€of pre-departure flights that are playbook rerouting candidates. Typically, this is accomplished by comparing a flight’s originating Center or airport with a list of originating Centers or airports associated with a playbook plan. This procedure is subsequently repeated for the destination airport or Center. The flight plans associated with the subset of flights that are playbook rerouting candidates are subsequently amended in the step labeled “Assign Playbook Reroute to Flights.” For this study, the amended flight path was created by concatenating the origin airport, the standard departure path (as indicated in the originally scheduled flight plan), the playbook rerouting segment, and the destination airport. The controls assigned by the Playbook Rerouting Model at time t are labeled u Reroute (t) in Fig. 1 and consist of a set of pre-departure reroutes to assign to the playbook impacted flights.
€
3 American Institute of Aeronautics and Astronautics
Figure 1. Integrated system architecture. The actual merging and spacing of the traffic flows ensures efficient usage of the airport runways and is accomplished via the collection of boxes labeled “Traffic Management Advisor” in Fig. 1. For the current study, the Traffic Management Advisor1 (TMA) performs the activities associated with these boxes once every twenty seconds. It is worth noting that operationally, TMA receives real-time position updates every twelve seconds, which coincides with the Center radar update rate. The slower update rate was selected for the fast-time simulations to improve computational performance. Using the trajectory prediction capabilities of TMA, ETAs to the meter fixes and all active runways for all aircraft are first calculated. This step is highlighted in the box labeled “Calculate ETAs to meter fix and runways” in Fig. 1. After calculating the ETAs, the flights are subsequently scheduled12 subject to the airport, meter fix, and runway constraints using the time-based TMA scheduling algorithm, which is a derivative of a first-come-first-served algorithm. The outcomes of this scheduling are scheduled times of arrival (STAs) to the meter fixes and active runways for all flights. These steps are captured in the box labeled, “Assign STAs to meter fix and runways” in Fig. 1. The controls assigned by TMA at time t are labeled u TMA (t) in Fig. 1 and consist of a set of airborne delays for the arriving flights. These controls were implemented at the arrival fixes, which are shown in Fig. 2. For simplicity these are implemented as airborne holding in the “Primary Simulation” system. €
4 American Institute of Aeronautics and Astronautics
Figure 2. High-altitude sectors, arrival fixes and sample arrival patterns for Dallas/Fort Worth International Airport (DFW).
III.
Experimental Setup
This section describes the GDP and playbook rerouting scenario, system inputs and the TMA settings used for testing the integrated TFM approach proposed in Section II. A. GDP Scenario The GDP considered in this study was operationally implemented at Dallas/Fort Worth International Airport (DFW) on May 14, 2009, as a result of convective weather impacting the airspace in and around DFW. The program was set to control flights arriving at DFW between 8:27 CDT on May 14, 2009 and 21:59 CDT on May 14, 2009, and all pre-departure flights within the Continental United States were assigned Estimated Departure Clearance Times (EDCTs) by the GDP. The hourly program flow rate for this thirteen and one-half hour period is presented in Table 1. It is worth noting that the flow rate dropped from 120 aircraft per hour, which is DFW’s normal operational rate, to zero at 8:30 CDT. For initial testing, only the first nine hours of the GDP were simulated. The hourly program flow rate from May 14, 2009 converted into fifteen minute increments (purple line), the exempt, uncontrolled arrival demand (hashed red bar) from May 28, 2009 (see Section III.C), the non-exempt, uncontrolled arrival demand (black bar) from May 28, 2009 (see Section III.C), and the actual number of flights that arrived (dashed blue line) during this six-hour period on May 14, 2009 are presented in Fig. 3 in fifteen minute increments. For reference, the actual number of flights (dashed blue line) was obtained from the FAA’s Aviation System Performance Metrics (ASPM) database and includes all major carriers, general aviation, and military flights. Note that although the hourly airport arrival rate is zero from 8:30 through 10:00 CDT, the actual number of arrivals during this period, which is indicated by the dashed blue line in Fig. 3 is non-zero. This is due to the fact that flights already airborne at the start of the GDP were exempt from the program.
5 American Institute of Aeronautics and Astronautics
Table 1. Hourly GDP flow rate from 8:30 CDT through 21:00 CDT. Hour 8:30 9:00 10:00 11:00 12:00 13:00 14:00
Aircraft / Hour 0 0 0 40 50 50 65
Hour 15:00 16:00 17:00 18:00 19:00 20:00 21:00
Aircraft / Hour 65 65 65 65 65 65 65
All GDP scenarios were assumed to start at 8:27 CDT, which coincides with the start of the GDP. All DFW arrivals were actively assigned pre-departure delays, or EDCTs, using two different GDP models between 8:27 CDT and 14:27 CDT. The scenarios were subsequently allowed to run an additional three hours, until 17:27 CDT, in order to allow the GDP impacted flights to arrive at DFW.
Figure 3. Exempt arrival demand (red hashed bars), non-exempt arrival demand (black bars), and DFW airport arrival rate (purple curve) aggregated over 15-minute intervals as a function of time. To simulate GDPs, a simple ration-by-schedule based heuristic was employed, which works as follows: Step 1: Order the original set of flights according to their scheduled DFW arrival times. Step 2: For the fth flight in the ordered list, assign the earliest feasible departure time that does not violate the airport arrival rate constraint (see the solid purple curve in Fig. 3, for example.) Step 3: Reduce the capacity of the fifteen minute arrival interval used by the fth flight by one unit during the time period when the flight occupies the airport arrival facilities. Step 4: Repeat steps 2-3 until all flights have been assigned feasible departure times. For the GDP scenarios, two variations of this scheduling heuristic were employed. In the first variation, no two flights were allowed to be scheduled to the same one-minute time slot within the fifteen minute arrival interval, while in the second variation multiple flights could be scheduled to the same one-minute time slot, as is done with the FAA’s Flight Schedule Monitor. Results generated with the first of these two models will be referred to as 6 American Institute of Aeronautics and Astronautics
“GDP without Virtual Slots”, and results generated with the later of these two models are referred to as “GDP with Virtual Slots.” The rationale for trying both of these scheduling heuristics follows. With the “virtual slot” heuristic, multiple flights could be assigned the same arrival slot time, and so hypothetically TMA could have to impose high delays to the flights in order to meet the runway and meter fix constraints that are described in Section III.D. On the other hand, the “GDP without Virtual Slots” heuristic would ensure that flights arriving at DFW are separated by at least one minute, in the absence of any sources of uncertainty, so it was hypothesized that the TMA scheduling delays would decrease. The results of this hypothesis testing will be examined in Section IV.A. It is worth noting that a serious shortcoming of the “GDP without Virtual Slots” heuristic is that the maximum number of flights that can be accommodated in any single fifteen minute interval is fifteen, which translates into a maximum airport arrival rate of sixty aircraft per hour. As can be seen from Table 1 and Fig. 3, this heuristic will actually over-constraint the national-level arrival scheduling problem starting at 14:00 CDT. B. Playbook Rerouting Scenario The playbook rerouting scenario considered in this study was operationally implemented on September 2, 2009, and affected DFW and Dallas Love Field (DAL) arrivals with estimated departure times (EDTs) between 6:43 CDT to 11:00 CDT. The name of this playbook reroute is “MW_2_DALLAS”, and it was implemented due to weatherinduced constraints that were impacting the DFW Bohnam (BYP) Standard Terminal Area Arrivals (STAR) and the DAL FINGR STAR. For reference, examples of two DFW arrival route segments that commonly use the BYP STAR are shown as green, dashed lines in Fig. 4. Additionally, DFW arrivals that use this STAR commonly cross over the KARLA arrival fix, which is illustrated in Figs. 2 and 4. For this scenario, only the reroutes associated with the BYP star closure, which impacted the DFW arrivals, were simulated in FACET. Flights arriving into DAL were allowed to fly on their originally scheduled routes. The rationale for doing this is that the focus of this effort is on exploring the interactions between the rerouted flights and the DFW arrivals that were scheduled with the TMA. Rerouting the DAL arrivals would not have added any additional insight into this interaction. A graphical depiction of the portion of the MW_2_DALLAS playbook reroute that was simulated is shown in Fig. 4, as solid green lines. As illustrated by this figure, all flights originating in the Minneapolis Air Route Traffic Control Center (ARTCC) (ZMP) that were destined for DFW were rerouted on the following flight path: OVER.SLN.ICT.IRW.UKW9.DFW. Similarly, flights originating in the Chicago ARTCC (ZAU) were rerouted on the following flight path: MZV.J18.ICT.IRW.UKW9.DFW. These reroutes will route flights over the BOIDS arrival fix, which is located to the northwest of DFW as illustrated in Figs. 2 and 4. All playbook rerouting scenarios were assumed to start at 6:43 CDT, which coincided with the first time that a pre-departure flight was rerouted on MW_2_DALLAS. Additionally, all simulations ended at 14:00 CDT, three hours after the last flight was rerouted. This additional simulation time was included to allow all playbook rerouted flights to arrive at DFW.
7 American Institute of Aeronautics and Astronautics
Figure 4. MW_2_DALLAS playbook route from September 2, 2009 (solid lines) and sample good weather arrival path segments (dashed lines). C. System Inputs For all experimental runs, inputs to the “User schedules and flight plans” module in Fig. 1 were derived from the May 28 and 29, 2009 ASDI data set. This date was selected as a representative baseline, good weather traffic scenario for the summer months in 2009, since there were no GDPs or reroutes implemented at DFW on this date and the arrival delays, as recorded in the ASPM database, were relatively low. The ASDI data parsing logic in FACET was used to extract: departure messages (DZ), flow control track/flight data block messages (TZ), and flight plan messages (FZ) to generate the inputs for the fast-time simulations. The TZ messages were used to establish an initial position for each flight. The FZ messages were used to assign baseline flight paths to each flight. The DZ messages were used to establish departure times. D. TMA Configuration For all experiments, TMA was operated in the “South_4_VFR” configuration. With these settings, the airport was assumed to be operating under Visual Flight Rules (VFR) and the active runways at DFW were 18R, 17C, 17L and 13R. The acceptance rate at the airport, including all runways and gates, was set to be unrestricted for all experiments, which is consistent with the TMA settings that were operationally used on May 14, 2009 and September 2, 2009. Additionally, a five nautical miles (nmi) inter-aircraft spacing constraint was imposed at all meter fixes, and the default wake vortex separation matrix in TMA, which is shown in Table 2, was used for all experiments. The data in this table shows the minimum separation in nautical miles between aircraft as they land in order for the trailing aircraft to avoid the wake vortex of the leading aircraft. The leading aircraft type is specified in the first column of the table, while the trailing aircraft type appears in the subsequent columns. For example, the minimum spacing at the runway when a small turboprop follows a heavy jet is six nautical miles. This separation varies depending on the engine type and weight class of the two aircraft that are being separated.
8 American Institute of Aeronautics and Astronautics
Table 2. Default TMA wake vortex separation matrix (in nmi) with the first column indicating the leading aircraft type and subsequent columns indicating the trailing aircraft type.
Heavy Jet Large Jet Large Turboprop Small Turboprop Small Piston Boeing 757
Heavy Jet
Large Jet
4.0 2.5 2.5 2.5 2.5 4.0
5.0 2.5 2.5 2.5 2.5 4.0
Large Turboprop 5.0 3.0 2.5 2.5 2.5 4.0
IV.
Small Turboprop 6.0 4.0 4.0 2.5 2.5 5.0
Small Piston
Boeing 757
6.0 4.0 4.0 3.0 2.5 5.0
5.0 2.5 2.5 2.5 2.5 4.0
Results
This section contains the results of fast-time simulation experiments in which both strategic- and local-level traffic flow management initiatives were used to manage the flow of arrivals into DFW, as described in Sections II and III. Results for the GDP scenarios that were described in Section III.A are presented in Section IV.A, while results for the playbook rerouting scenario are presented in Section IV.B. A. DFW GDP Scenario During the nine-hour GDP scenario, there were a total of 455 flights arriving at DFW, and 103 of these flights were exempted from the GDP, since they were en route at 8:27 CDT. The maximum delay experienced by a flight was 128 min., while the minimum delay for any delayed flight was one min. The average delay for the 255 delayed flights was sixty-six min. The remaining ninety-seven flights in the scenario were included in the GDP, but they were undelayed. Each of these 455 flights was subsequently scheduled for arrival by the TMA, as described in Sections II and III.D. A histogram of the TMA delays is presented in Fig. 5 for the following scenarios: (a) no GDP is implemented (solid black bars), (b) a GDP is implemented without virtual slots (hashed bars), (c) a GDP is implemented with virtual slots (solid white bars), and (d) the operational TMA delays from May 14, 2009 (vertical striped bars). Between 71% and 91% of all flights (either modeled or actually observed) received ≤ two minutes of TMA delay, which indicates that the arrival demand was sufficiently low, even without the GDP that the TMA constraints were seldom binding. In general, the modeled and operational TMA delays are in reasonable agreement with the modeled results varying between 6.5% higher and 15% lower than the operationally observed delays for the case in which delays were ≤ two minutes. Instances in which flights received high TMA delays (i.e., ≥ fifteen minutes of delay) are uncommon. For the modeled results, between 1.1% and 9.8% of all flights had delays in excess of fifteen minutes, while operationally 4% of the flights were assigned delays of ≥ fifteen minutes. In general, the two different approaches used for implementing the GDP (i.e., with and without virtual slots) had little effect on the TMA delays. Because of the serious limitations that the “GDP without Virtual Slots” heuristic imposes on the maximum airport arrival rate, the potential benefits of this heuristic are unwarranted.
9 American Institute of Aeronautics and Astronautics
Figure 5. Histogram of TMA delay distribution in minutes for flights scheduled to arrive at DFW when (a) no GDP is implemented (solid black bars), (b) a GDP is implemented without virtual slots (hashed bars), (c) a GDP is implemented with virtual slots (solid white bars), and (d) the operational TMA delays from May 14, 2009 (vertical striped bars). The distribution of TMA-delayed flights by arrival fix is presented in Fig. 6 for the scenario in which no GDP was implemented. It should be noted that this distribution remains unchanged for the GDP without virtual slots scenario and the GDP with virtual slots scenario. For reference, the arrival fixes in Fig. 6 are displayed in Fig. 2. Arrivals from the southwest cross over FEVER and KNEAD, arrivals from the northwest cross over BOIDS and GREGS, arrivals from the northeast cross over KARLA and SASIE and arrivals from the southeast cross over HOWDY. The distribution of delays in Fig. 6 is to be expected, and is consistent with the arrival traffic patterns flows that are commonly experienced at DFW in the morning and early afternoon periods.
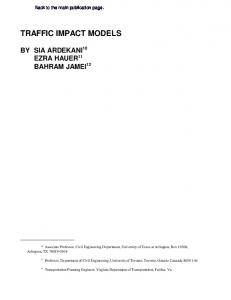
Figure 6. Distribution of TMA delays by arrival fixes for flights scheduled to arrive at DFW. A potential cause for concern when using loosely coordinated models to delay flights at the national- and locallevels is assigning multiple delays to a single flight. Figure 7a shows the TMA delays and GDP delays for the 455 DFW arrivals that were considered in the modeled scenario. When using the GDP model without virtual slots, 51% 10 American Institute of Aeronautics and Astronautics
of all flights received both TMA and GDP delays. Similarly, when using the GDP model with virtual slots, 53% of all flights received both types of delays. Figure 7b shows the subset of flights that departed from within the Fort Worth Air Route Traffic Control Center and received both TMA and GDP delays. When using the GDP model without virtual slots, there were a total of twenty-six internal departures that received both TMA and GDP delays, while simulations conducted with the GDP model with virtual slots resulted in twenty-nine internal departures with both types of delays. The number of internal departures that received multiple pre-departure delays were corresponds to 5.7% to 6.4% of all DFW arrivals. Though this is a small percentage of the total number of flights receiving both TMA and GDP delays, these flights unfairly receive pre-departure delays first by the GDP then by TMA. The reason for this is that for internal departures, TMA assigns a pre-departure delay to the flight, whereas the delay assigned to the airborne flights is assumed to be absorbed through speed and heading controls. Follow-on research that examines the extent to which internal departures receive multiple uncoordinated pre-departure delays would be beneficial, and analyses are warranted that validate these modeled results against operational data (e.g., compare the modeled results against the corresponding delays recorded in the FAA Aggregate Demand List and TMA logs). Overall, the findings from this set of experiments confirm field observations that Ground Delay Programs operated in conjunction with arrival scheduling can result in flights receiving multiple uncoordinated delays.
[a] [b] Figure 7. [a] TMA and GDP delays for all flights and [b] TMA and GDP delays for DFW internal departures. B. Playbook Rerouting Scenario During the seven hour and seventeen minute MW_2_DALLAS playbook scenario, there were a total of 405 flights arriving at DFW, and thirty-nine of these flights (or 9.6% of the flights) were rerouted on the MW_2_DALLAS playbook reroute. The maximum rerouting delay experienced by a flight was thirty-six min., while the minimum rerouting delay for any rerouted flight was 3.7 min. The average rerouting delay for all rerouted flights was 16.3 min. Each of these 405 flights was subsequently scheduled for arrival by the TMA. A histogram of the TMA delays is presented in Fig. 8 for the following scenarios: (a) no playbook reroute is implemented (solid black bars), (b) flights are rerouted on the MW_2_DALLAS playbook reroute (hashed bars), and (c) the operational TMA delays from September 2, 2009 (vertical striped bars). For the modeled results, 90% of the rerouted and non-rerouted flights (either modeled or actually observed) received ≤ two minutes of TMA delay, which indicates that the arrival demand was sufficiently low, even without the rerouting that the TMA constraints were seldom binding. This is an interesting finding because intuitively one might expect that the TMA delays would increase when additional flights are routed over the northwest arrival fix (BOIDS). However, since only a minimum inter-aircraft spacing constraint of five nautical miles was being imposed at the meter fixes, the primary binding constraint being considered by TMA was the wake vortex separation matrix, and as a result there was relatively little change in the modeled TMA delays. In general, the modeled and operational TMA delays are in reasonable agreement. For example, when considering the instances in which flights were delayed by ≤ two min, the modeled results were within 11.5% of the operationally observed delays. Finally, instances in which flights received high TMA delays (i.e., ≥ ten minutes of delay) are uncommon. For the modeled results, less than 1% of all flights received delays in excess of ten minutes.
11 American Institute of Aeronautics and Astronautics
Figure 8. Histogram of TMA delay distribution in minutes for flights scheduled to arrive at DFW when (a) no playbook rerouting is implemented (solid black bars), (b) the MW_2_DALLAS playbook rerouting is implemented (hashed bars), and (c) the operational TMA delays from Sept. 02, 2009 (vertical striped bars). The distribution of TMA delayed flights by arrival fix is presented in Fig. 9 for the following scenarios: (a) no playbook rerouting (solid black bars) and (b) with playbook rerouting (hashed bars). The effect of the reroute can be clearly seen in this plot by comparing the relative magnitudes of the bars in the columns labeled “KARLA SASIE” and “BOIDS GREGS.” As expected, the primary impact of the MW_2_DALLAS playbook reroute within DFW was to route flights from the northeast arrival fixes (KARLA and SASIE) to the northwest arrival fixes (BOIDS and GREGS).
Figure 9. Distribution of TMA delays by arrival fixes for flights scheduled to arrive at DFW. Lastly, Fig. 10 shows the TMA delays and rerouting delays for the 405 arrivals that were considered in the rerouting scenario. Approximately 7% of all arrivals received both reroutes and TMA delays. Nevertheless, even under the worst-case scenario, no rerouted flights were observed to receive more than four minutes of delay from the TMA. Based on the results of this scenario, it would appear as if the loosely coupled manner in which flights are rerouted at the national-level with playbook reroutes and subsequently scheduled with the TMA at the local-level 12 American Institute of Aeronautics and Astronautics
does not have an adverse impact on traffic flows. However, follow-on studies that consider a larger set of playbook scenarios, possibly at other ARTCCs, are warranted.
Figure 10.
TMA delays and delays resulting from the MW_2_DALLAS playbook reroute for all flights.
V.
Conclusions
The loosely coordinated sets of traffic management initiatives that are implemented at the national- and locallevels have the potential to under, over, and inconsistently control flights. This study is designed to explore these interactions through fast-time simulations with an emphasis on identifying situations in which flights receive multiple uncoordinated delays, as a result of initiatives implemented at both the national- and local-levels. Using operational traffic flow management logs and historical flight schedules, two scenarios were identified in which flights arriving into the Dallas/Fort Worth International Airport were first controlled at the national-level, either through a playbook reroute or a Ground Delay Program, and subsequently assigned arrival scheduling delays subject to meter fix, runway, airport, gate, and wake vortex separation constraints at the local-level. For the Ground Delay Program scenarios, which are based on the Ground Delay Program that was operationally implemented on May 14, 2009, between 51% and 53% of all Dallas/Fort Worth International Airport arrivals experience both pre-departure delays from the Ground Delay Program and arrival scheduling delays as calculated by the Traffic Management Advisor. Of this subset of flights that received multiple uncoordinated delays, between 5.7% and 6.4% of the flights were first assigned a pre-departure delay by the Ground Delay Program and subsequently assigned a pre-departure delay as a result of the arrival scheduling from Traffic Management Advisor. In an effort to validate the results, the modeled arrival scheduling delays were compared with the corresponding delays that were operationally reported on May 14, 2009. When considering the subset of flights that received ≤ two minutes of delay, which constituted between 71% and 91% of all flights, the modeled results were found to vary between 6.5% higher to 15% lower than the operationally recorded scheduling delays. Findings from this set of experiments confirm field observations that Ground Delay Programs operated in conjunction with arrival scheduling can result in flights receiving multiple uncoordinated delays. In the second set of scenarios, Dallas/Fort Worth International Airport arrivals were first assigned pre-departure reroutes based on the MW_2_DALLAS playbook plan that was operationally implemented on September 2, 2009. These flights were subsequently assigned arrival scheduling delays by the Traffic Management Advisor. Since operationally, the runway, airport and gate constraints in the Traffic Management Advisor are set to be unconstrained, the only binding constraint are the five nautical miles inter-aircraft spacing constraints at the meter fixes and the wake vortex separation constraint at the runway. Since the MW_2_DALLAS playbook plan did not alter the number of flights or significantly alter the order in which flights arrived at the Dallas Forth Worth International Airport only 7% of the arrivals were observed to receive both rerouting and arrival scheduling delays. As a result, the loosely coordinated manner in which flights are rerouted on playbook routes at the national-level and 13 American Institute of Aeronautics and Astronautics
subsequently assigned arrival scheduling delays at the local-level were not observed to exhibit an adverse impact on flights.
Acknowledgments The authors are indebted to Mr. Liang Chen and Mrs. Cynthia Freedman for sharing their expertise with NASA’s Center TRACON Automation System and the Traffic Management Advisor.
References 1
Swenson, H. N., Hoang, T., Engelland, S., Vincent, D., Sanders, T., Sanford, B., and Heere, K., “Design and Operational Evaluation of the Traffic Management Advisor at the Fort Worth Air Route Traffic Control Center,” 1st Eurocontrol/FAA ATM R&D Seminar, Saclay, France, June 17-19, 1997. 2 Farley, T. C., Foster, J. D., Hoang, T., Lee, K. K., “A Time-Based Approach to Metering Arrival Traffic to Philadelphia,” 1st AIAA Aviation Technology, Integration, and Operations (ATIO) Conference, Los Angeles, CA, AIAA Paper 2001-5241, Oct. 1688, 2001. 3 Farley, T. C., Landry, S. J., Hoang, T., Nickelson, M., Levin, K. M., Rowe, D., and Welch, J. D., “Multi-Center Traffic Management Advisor: Operational Test Results,” 5th AIAA Aviation Technology, Integration, and Operations (ATIO) Conference, Arlington, VA, AIAA Paper 2005-7300, Sep. 26-28, 2008. 4 Odoni, A. R., “The Flow Management Problem in Air Traffic Control,” Flow Control of Congested Networks, edited by A. A. R. Odoni, L. Bianco, and G. Szego, Springer-Verlag, New York, 1987, pp. 269-288. 5 Ball, M. O., Hoffman, R., Odoni, A. R., and Rifkin, R., “A Stochastic Integer Program with Dual Network Structure and its Application to the Ground-Holding Program,” Operations Research, Vol. 51, pp. 167-171, 2003. 6 Richetta, O. and Odoni A. R., “Dynamic Solution to the Ground-Holding Problem in Air Traffic Control,” Transportation Research Part A, Vol. 89, No. 3, pp. 167-185, 1994. 7 Mukherjee, A. and Hansen, M., “A Dynamic Stochastic Model for the Single Airport Ground Holding Problem,” Transportation Science, Vol. 41, No. 4, pp. 444-456, 2007. 8 Sridhar, B., Chatterji, G. B., Grabbe, S. R., and Sheth, K., “Integration of Traffic Flow Management Decisions,” AIAA Guidance, Navigation and Control Conference, Monterey, CA, AIAA Paper 2002-5014, Aug 5-8, 2002. 9 Bilimoria, K. D., Sridhar, B., Chatterji, G., Sheth, K.S., and Grabbe, S. R., “Future ATM Concepts Evaluation Tool,” Air Traffic Control Quarterly, Vol. 9, No. 1, March 2001. 10 “Enhanced Traffic Management System (ETMS),” Report No. VNTSC-DTS56-TMS-002, Volpe National Transportation Center, U.S. Department of Transportation, Cambridge, MA, Oct. 2005. 11 Grabbe, S., Sridhar, B., and Mukherjee, A., “Sequential Traffic Flow Optimization with Tactical Flight Control Heuristics,” AIAA Journal of Guidance, Control and Dynamics, Vol. 32, No. 3, pgs. 810-820, May-June 2009. 12 Wong, G. L., “The Dynamic Planner: The Sequencer, Scheduler, and Runway Allocator for Air Traffic Control Automation,” NASA TM-2000-209586, April 2000.
14 American Institute of Aeronautics and Astronautics