Interaction Factors In Software Development Performance In Distributed Student Groups In Computer Science Martha L. Hause The Open University Milton Keynes, UK
[email protected]
Vicki L. Almstrum University of Texas at Austin Austin, TX
[email protected]
Mary Z. Last St. Edward’s University Austin, TX
[email protected]
M. R. Woodroffe The Open University Milton Keynes, UK
[email protected]
Abstract This paper compares the characteristics of high and low performance distributed student teams doing software development in Computer Science. The distributed student teams were involved in a software development project that was part of a Computer Science course at two universities located in different countries. We developed a set of categories to examine the email communication of distributed student teams. This paper tracks the progression and changes in the categories coded for each team’s communication throughout the project’s timeline, particularly during key decision periods in the software development cycle. 1 Introduction Communication and interaction among team members is both inevitable and necessary if a team is to be successful in achieving the goal or the purpose for which they came together as a group. Many problems can occur in teamwork that would threaten the team’s success. This is especially true in the area of software development, where approximately two−thirds of software projects are late [11]. Criteria for team success can range from the timely completion of a project in industry to a result of high performance in an educational project.
Studies have shown that a group’s performance can be affected by factors such as the group’s interaction and behaviour [7]. A number of studies have looked at factors that affect high and low performance in different types of projects [2, 10, 11]. In this paper, we consider the role of communication in high and low−performing teams. We classify communications based on a validated system of categories. 2 The Runestone Project The case study used in this investigation is drawn from the Runestone Project, an international collaboration between Uppsala University in Sweden and Grand Valley State University in Michigan, USA. The Runestone Project is a three−year project sponsored by the Swedish Council for Renewal of Undergraduate Education and encompasses the years 1998 through 2000. The primary aim for the Runestone Project is to introduce “international experience into undergraduate Computer Science education in a way that has value for all participants” [4]. This aim is accomplished by incorporating an international project into courses at both Uppsala University and Grand Valley State University. Students are required to work in groups of 5−6 people. Each group includes members from each university. Students collaborate closely with their foreign counterparts using appropriate technology to complete a software development project. This remote communication
encompasses Runestone’s secondary aim, to “identify effective support structures for remote international collaboration, encompassing strategies for communication, management and technology use” [4]. For more complete details of the Runestone project, see [4, 6]. The investigation reported here has focused on the communication and interactions of a high− performing and a low performing team. All references to assessment, data collection, team formation, and technology are related to Runestone 2000.
2.1 Student Demographics The 2000 instance of the Runestone project involved a total of ninety−three students, 47 from Uppsala University and 46 from Grand Valley State University. The students were organized into sixteen teams, thirteen of which had six members (three from each university) and three of which had five members. The American students were in their third or fourth year of university study and Swedish students were in their third year of university study. 2.2 Team Formation and Operation Local sub−groups of two or three students were formed by the instructors with the aim of creating teams that were well−balanced with respect to technical abilities and interpersonal skills such as leadership and enthusiasm. Once the sub−groups were set up, the two instructors methodically yet arbitrarily assigned half of the local sub−groups in each university to choose a team leader. Sub−groups with team leaders were arbitrarily matched with foreign sub−groups that did not have a team leader. This resulted in internationally distributed teams with half the team leaders in each of the universities. The development followed a fairly traditional waterfall model with a series of external milestones set by the instructors over the course of the semester. All teams worked on the same project. The team’s first external milestone was to report on the team’s roles, decision−making
strategies, election process, interactions to date and problems to date. As part of this milestone, the teams were encouraged to get to know each other by completing a team building exercise and placing the results on the web. At the completion of each external milestone, each team was required to make a presentation. Team members were required to take turns leading a presentation and all team members had to present at least once. Normally, the student who presented was also the student who had the main responsibility for the task that was being presented. All team members were required to take on the role of developers. The role of leader was clearly defined as an extended role where the person taking on that role would need to coordinate work as it progressed while still contributing work as a developer. 2.3 Communication Media Students were required to hold weekly meetings and were encouraged to maintain regular contact with their instructors and other team members, both local and remote. For regular team meetings, students used Internet Relay Chat (IRC), while they used email for other types of correspondence (for example with instructors or with either local or remote team members). Web pages were used initially for introductions within the teams and to share personal information. The web pages were later used to publish and make available project documents to the entire team. In general, while email correspondence was the most frequently used form of communication, email messages tended to be short and to the point. IRC correspondence was much lengthier and seemed to provide a venue for discussion and interaction. Teams tended to use web pages for sharing information that did not require an immediate response. 2.4 Data Collection Data from the Runestone Project was collected in a variety of forms and was carried out throughout the project. Sources of data included all types of
interaction between team members except for informal face−to−face meetings. The following data were collected: background questionnaire, project logs, journals, student email and Internet Relay Chat (IRC) archives, web pages, peer evaluations, instructor interviews. Students were informed that the Runestone data would not be shared with the course instructors until after the course was completed and grades were assigned. 3 A Study of Two Teams For this study, we carefully investigated the email communication of two hand−picked teams. The teams were selected by the authors according to individual final grade and overall team grade. The high−performing team was rated as the best team by the US instructor. The low−performing team was not rated as the worst team but overall team grades were average and below−average for each external milestone. 3.1 Team Profiles The high−performing team (team A) in this study was composed of 6 students (5 males and 1 female). The low−performing team (team B) had 5 students (3 males and 2 females.) Specific major grade point averages (GPAs) are available only for the US students. Students in Team A had GPAs (on a 4.0 scale) that ranged from 3.3 to 3.9 and all students in the team were between the ages of 21 and 29. Students in Team B had GPAs that ranged from 3.1 to 3.7. Team B had a wider range of ages, with four of the students between the ages of 21 and 29 and one student older than 40. Each student received an individual grade for the course. To simplify the explanation, we give all final grades using the US grading scale of A+ (highest) to F (lowest). Grades for students in Team A ranged from A+ to B− while the grades for students in Team B ranged from B to D+. 3.2 Category Framework Many studies have developed and used categories to analyse group communications in order to identify team interaction and behaviour in
problem solving and in managing and coordinating their activities [1, 5, 8]. Using data driven analysis, it was initially recognised that the data could be organised into specific categories. These categories would help in the identification of both the software and group development processes, and in the classification of interaction types. In earlier work with Runestone data, the first author, using discourse analysis, developed and validated a set of categories to be used in classifying interactions among team members. Discourse analysis focuses on the ways people construct individual versions of events through their conversation [3]. We coded each team’s email communications by classifying phrases from the messages according to the relevant categories. We logged each phrase, the category, the author of the email message, and the timestamp/date. After all of the messages were categorized, we analyzed the frequency of each category against the timestamp of the message where the phrase occurred. We then compared the frequency of categories throughout the project timeline for each team. Disputes about the interpretation or understanding of the meanings were discussed with an independent coder until a satisfactory meaning was reached. We used twelve categories to classify content of the two team’s emails. The twelve categories are: Planning Work (C1), Planning Admin (C2), Decisions (C3), Roles (C4), Conflict (C5), Social/Get to Know (C6), Humour (C7), Graphical Expressions (C8), Ideas (C9), Identification (C10), Task/Work Specific (C11), and Goals (C12). We also developed sub− categories for each category as we carried out the analysis. For example, a particular phrase could be classified under the general category of Planning Work (C1), while details of the phrase showed that the purpose of the phrase was to identify tasks or to request updates of work. Therefore, a meaning and example was added to each sub−category to enable common interpretation. The C1 subcategory, Request for Work Update, is defined as one teammate asking
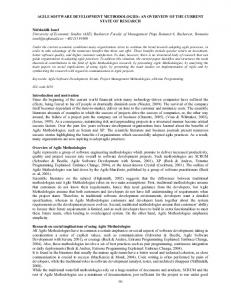
the others to provide an update of how much they have accomplished in their tasks. A sample phrase for this subcategory is “email from EVERYONE telling me what you have done as far as implementation is concerned”. 4 Results We analyzed both the volume and the content of the email messages. Team A generated 93 emails while team B had 115 emails. Although the content of the IRC chats have not been analysed as of this writing, it is significant to note that Team A had 42 IRC chats while Team B had only 4 IRC chats. The most frequent poster in Team A contributed 54% of the email communication, with the next most frequent poster contributing 20%. Neither of these two individuals was the team leader. For Team B, the most frequent poster was the team leader, who contributed 60% of the communications. The next two most frequent posters in Team B had 12% each. One of the factors that the authors felt might be significant was the amount of social interaction. How much time did students spend getting to know each other? We wanted to test whether a team that had a higher number of social/humour interactions would perform better. As Figure 1 shows, for the 12 categories, there was very little difference in the frequency of categories between the two groups. Category Percentages 40 35 30 25 Team A
20
Team B
15 10 5
C1 1
C9
C7
C5
C3
C1
0
Figure 1 Category Totals
Figure 1 does show that in both groups more than
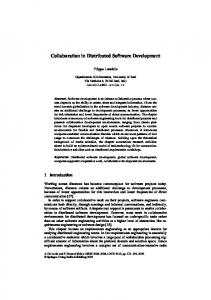
30% of the phrases in the messages concerned some type of social interaction. What was significant was the relationship between frequency of Planning Work (C1) and time period. The time periods correspond to deadlines for the three major deliverables. Team B messages had significantly more phrases related to planning in the last stages of the project than Team A messages, as shown in Figure 2. Planning by Time Period 50 45 40 35 30 25 20 15 10 5 0
Team A Team B
Period 1
Period 2
Period 3
Figure 2 Planning by Time Period
Team A did 76% of their planning in the first two time periods while Team B did 79% of their planning in the last two time periods. 5 Conclusion Two ways that we as teachers identify factors that influence the success of a team are informal student feedback and peer evaluations. Indeed, previous studies (such as [9]) have relied on peer evaluations to illuminate factors that influence team performance. Peer evaluations and student feedback are both inherently subjective. It would be more advantageous to researchers if there was a more objective method of identifying factors that affect team performance. Because the teams being studied here were distributed teams that communicated electronically, we were able to log, quantify, and analyse the communications by category and over time. This allowed an objective method for identifying factors that influence team performance. Our intent was to look not just at
what the students said but what they did and when they did it (timing of actions). Based on our analysis of the emails, we can conclude that communication among all members is indeed crucial but more importantly that the timing of specific categories of communications impacts a team’s performance. Planning is one area that showed differences between the high−performing and low− performing teams. Results showed clearly that planning should be done at the beginning of the project. Messages concerned with planning toward the end of the project may indicate the team’s lack of focus or direction. Indeed, one member of Team B commented a few weeks after the project started: I guess I am still slightly confused about this whole class and how everything is supposed to go. Are you all just as confused or am I the only one? To underline the importance of communication and social interaction, it is worth noting that the individual who received the highest grade in each team was the individual who was the most frequent poster and whose messages had the highest number of phrases rated in the Social/Get to Know (C6) category. The results of this study suggest that we, as teachers, need to reinforce the practical reasons for software project planning. Perhaps, more frequent and smaller deliverables would help our students learn the value of planning in the software development process. 6 Acknowledgements The Runestone project involves students and faculty at Uppsala University (Sweden), and Grand Valley State University (Michigan, USA), and researchers from the Open University (UK), the University of Kent (UK), St. Edward’s University and the University of Texas at Austin (Texas, US). The contributions of Bruce Klein and Mats Daniels as well as Carl Erickson and Arnold Pears have been invaluable. A very special thank you to all the students who have participated in the Runestone project.
References [1] Bales, R.F. & Strodtbeck, F.L. (1951). Phas es in Group Problem−Solving. Journal of Abnormal and Social Psychology, 46, 485− 495. [2] Belbin, R.M. (1996). Management Teams: Why they succeed or fail. Oxford: Butterworth−Heinemann. [3] Coolican, H. (1999). Research Methods and Statistics in Psychology. Second Edition. Lo ndon: Hodder & Stoughton. [4] Daniels, M., Petre, M., Almstrum, V., Asplund, L., Bjorkman, C., Erickson, C., Klein, B., Last, M. (1998). RUNESTONE, an International Student Collaboration Project. In Proceedings of IEEE Frontiers in Education Conference. Tempe, AZ . [5] Danziger, K. (1976). Interpersonal Communication. Exeter: Pergamon Press Inc. [6] Last, M.Z., Almstrum, V.L., Daniels, M., Erickson, C., Klein, B., An International Student/Faculty Collaboration: The Runestone Project. SIGCSE Bulletin 32(3), September 2000, pp 128−131. [7] Mills, T.M. (1967). The Sociology of Small Groups. New Jersey: Prentice−Hall. [8] Olson, G.M., Olson, J.S., Carter, M.R., Storrosten, M. (1992). Small Group Design Meetings: An Analysis of Collaboration. Human−Computer Interaction, 7, 347−374. [9] Pournaghsband, Hassan. The Students’ Problems in Courses with Team Projects. Proceediings of the 21st SIGCSE Technical Symposium, SIGCSE Bulletin 22(1), February 1990, pp44−47. [10] Taplin, M., Yum, J.C.K., Jegede, O., Fan, R.Y.K., Chan, M.S. Help−seeking Strategies Used by High−Achieving and Low− Achieving Distance Education Students. Pap er presented at 13th Annual Conference of the Asian Association of Open Universities, Beijing. 1999. [11] Teasley, S., Covi, L., Krishnan, M.S., Olson, J.S.. How does radical collocation help a team succeed? CHI 2000 Proceedings.
2000.