Exp Brain Res (2000) 130:67–72 Digital Object Identifier (DOI) 10.1007/s002219900232
© Springer-Verlag 2000
R E S E A R C H A RT I C L E
Laurence R. Harris · Andrew T. Smith
Interactions between first- and second-order motion revealed by optokinetic nystagmus
Received: 3 May 1999 / Accepted: 19 August 1999 / Published online: 21 September 1999
Abstract A previous study has suggested that secondorder motion is ineffective at driving optokinetic nystagmus (OKN) when presented alone. First- and second-order motion cues interact in creating the perception of motion. Is there an interaction between first- and secondorder cues in the control of eye movements? We presented combinations of first- and second-order cues moving in the same or opposite directions and measured the eye movements evoked, to look for a modification of the oculomotor response to first-order motion by simultaneously presented second-order cues. Dynamic random noise was used as a carrier for first- and second-order drifting gratings (13.4°/s; 0.25 cycles/°; 64×48° screen viewed at 28.5 cm). Second-order gratings were defined by spatial modulation of the luminance flicker frequency of noise pixels of constant contrast (50%). A first-order, luminance-defined grating (13.4°/s; 0.25 cycles/°; variable contrast from 4–50%) was moved in either the same or the opposite direction. Eye movements were recorded by video-oculography from six subjects as they looked straight ahead. The gain (eye velocity/stimulus velocity) of first-order-evoked OKN increased with contrast. The presence of flicker-defined second-order motion in the opposite direction attenuated this OKN below a first-order contrast of 15%, although it had little effect at higher contrasts. When first- and second-order motion were in the same direction, there was an enhancement of the OKN response. We conclude that second-order motion can modify the optokinetic response to simultaneously presented first-order motion.
L.R. Harris (✉) Department of Psychology, York University, Toronto, Ontario, Canada M3 J 1P3 e-mail:
[email protected] Tel.: +1-416-736-2100 Ext. 66108, Fax: +1-416-736-5814 A.T. Smith Department of Psychology, Royal Holloway College, University of London, Egham TW20 0EX, UK
Key words Second-order motion · Optokinetic nystagmus · Eye movements · Contrast threshold
Introduction The processing of visual motion requires correlating visual information across time. Motion detection can operate on the distribution of luminance information present in the optic nerve, or even within the retina itself in some species (Michael 1968; Oyster et al. 1972). Motion extracted from sequential correlation of patterns defined by luminance variation has been described as first-order motion. But the correlation of the sequential appearance of other aspects of the retinal image, such as patterns defined by contrast or flicker, can also result in the sensation of motion. Because these features need to be extracted from luminance-defined patterns, and by analogy with statistics, this has been described as second-order motion (see Smith 1994 for review). In natural circumstances, first- and second-order motion usually occur simultaneously. In the laboratory, however, first- and second-order motion cues can be manipulated quite independently and stimuli can be generated that have second-order motion but no first-order motion and visa versa. Examples of pure second-order motion stimuli include ones in which the motion is defined only by spatio-temporal changes in contrast or flicker frequency (Derrington and Badcock 1985; Chubb and Sperling 1988). In such stimuli, moving local features or boundaries are defined by variations in some particular second-order attribute, whilst luminance changes carry no net movement information. Recent evidence suggests that first- and second-order motion are detected by independent mechanisms (Derrington and Badcock 1985; Derrington et al. 1992; Mather and West 1993; Ledgeway and Smith 1994; Lu and Sperling 1995; Nishida et al. 1997; Smith and Ledgeway 1997) and possibly at different brain sites (Smith et al. 1998). The first- and second-order motion processing mechanisms interact in generating the perception of motion.
68
For example, plaids made up of first- and second-order components moving in different directions cohere like plaids made up of two first-order components when the contrasts of the components are appropriately adjusted (Stoner and Albright 1992). Although pure second-order motion stimuli are relatively ineffective at evoking optokinetic eye movements (Lelkens and Koenderink 1984; Harris and Smith 1992), could there be some interaction between first- and second-order systems in eye movement control? To investigate this we recorded eye movements evoked by combinations of first- and second-order stimuli. These findings have been reported in abstract form (Harris and Smith 1997, 1998).
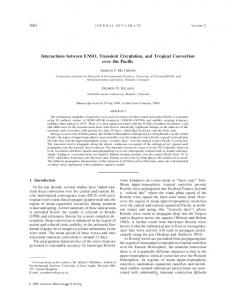
Materials and methods Visual stimulus Stimuli were presented on a 17-in. monitor (Applevision 1710AV) which was positioned at 28.5 cm from the subject and therefore subtended 64° horizontally × 48° vertically. The mean luminance was approximately 20 cd/m2. The screen resolution was set to 640×480 so that each pixel subtended 0.1°. Across the centre of the screen was a 5°-wide, horizontal black band to attenuate the contribution of smooth pursuit. Both the first- and second-order components of the stimuli had a spatial frequency of 0.25 cycles/° and a drift rate of 13.4°/s (3.35 Hz) to either the left or right. The first-order component was a vertical sinusoidal grating with a Michelson contrast that could be varied between 5 and 50% (see Fig. 1a). The second-order motion component was carried on dynamic random noise (binary, two-dimensional, pixel size 0.2°, contrast 50%) which was present in all images so that first-order motion was never presented in the absence of noise. The second-order component consisted of a vertical, square wave grating made up of alternating 2°-wide vertical strips in which the noise flickered at either 16.75 or 3.35 Hz (see Fig. 1b). The noise contrast was spatially and temporally uniform (50%) so that any one frame consisted simply of noise with no grating. Flicker-frequency-modulated noise was used in preference to contrast-modulated noise because it eliminates the possibility of unwanted first-order components arising from imperfect gamma correction, including the uncorrectable spatial variations in the gamma factor of the monitor that are problematic when a large image is used. Compound images (Fig. 1c) were generated by first spatiotemporally modulating the noise carrier to produce the second-order component and then adding a sinusoidal luminance modulation. The phases of the two modulations were varied independently over time to produce the desired motion combination. The mean
luminances of the two components were adjusted such that the final images all had the same mean luminance when combined, irrespective of contrast. Control of smooth pursuit and fixation We were anxious that interpretation of our results might be complicated by either the presence of smooth pursuit (which might be mistaken for optokinetic nystagmus) or fixation (which might suppress optokinetic nystagmus). We controlled for smooth pursuit and fixation by two simultaneous means. First we employed dynamic visual noise. This reduced the chances of fixation considerably, since there were no static features that could anchor fixation. However, this measure alone did not stop pursuit, and fixation on the flickering, static borders of individual pixels was still a possibility. Therefore we used a second technique of masking off the central 5° of the stimulus, across its entire width. Such a mask makes fixation and pursuit very difficult, since both rely on foveal information (Howard and Ohmi 1984; Van Die and Collewijn 1986), whilst having almost no effect on optokinetic nystagmus (Murasugi et al. 1986). The band had no fixation points and the edges were smooth and provided no landmarks. Eye movement recording and calibration Horizontal and vertical eye movements were recorded by an SMI video-oculographic eye monitoring system (Sensori Motoric InFig. 1a–c Space-time plots illustrating the second-order stimulus used. Each of the three plots represents a horizontal section through the image seen at successive points in time (represented vertically). a The first-order motion stimulus was created by sinusoidally luminance-modulating the two-dimensional dynamic noise. The sine wave was drifted across the screen at 13.4°/s. b The second-order motion stimulus was created by varying the replacement frequency of the randomly distributed pixels across the screen. The screen was divided into 2°-wide vertical strips and was updated at 16.75 and 3.35 Hz in alternating strips. The strips were then moved across the screen at 13.4°/s. Each individual frame consists of binary, two-dimensional noise of uniform contrast with no spatial structure visible within it. c First- and secondorder motion were presented simultaneously by sinusoidally modulating the luminance of the display shown in b. The phases of the luminance and flicker-frequency modulating waveforms were varied independently over time to produce the desired motion combination. The mean luminances of the two components were adjusted such that the final image had the same mean luminance as the components. The screen subtended 64×48° and was viewed at 28.5 cm. A 5°-high, horizontal black band stretched horizontally across the centre of the screen which cannot be illustrated on a space-time plot
69 struments, Berlin). Calibration trials were obtained by asking subjects to look in turn at each of an array of precisely positioned targets on the screen. Subjects’ heads were restrained by rigidly mounted dental-acrylic bite bars. Eye position was sampled at 250 Hz and the horizontal and vertical positions calculated relative to the calibration points by an algorithm involving pupil shape analysis. The resulting positional eye movement traces were differentiated and scanned by an algorithm that detected, marked and reported the frequency of fast eye movements identified by their velocity and acceleration profiles (Eyelink; Sensori Motoric Instruments). The remaining non-fastphase periods of fixation or slow-phase activity were averaged together over typical sections of each record and presented as a mean and standard deviation for each trial for each subject. We applied the criteria of Crognale and Schor (1996) to distinguish optokinetic nystagmus (OKN) from smooth pursuit where possible, but criteria based on fast-phase frequency were difficult to apply to some of the very weak eye movements evoked by our stimuli.
Results
Subjects and experimental design
Fig. 2 Optokinetic nystagmus (OKN) evoked by first-order movement. The variation of the average, slow-phase velocity of OKN with stimulus contrast is shown for individual subjects (left hand panel; each subject is shown by a different symbol) and as an average of all subjects with standard errors (right hand panel). Since the stimulus velocity was fixed at 13.4°/s (indicated by a horizontal dashed line) the data have been left in °/s. A regression line plotted through the data has a slope of 8.37°/s per log unit of contrast and indicates a threshold contrast value for evoking OKN of 3.5%. The simple regression model predicts that eye velocity will not equal stimulus velocity until contrast reaches the impossible value of 141%. The fastest OKN (evoked by 100% contrast) is predicted to be 12.2°/s, a maximum gain (response/stimulus) of 0.91
All experiments were conducted in accordance with principles embodied in the Declaration of Helsinki (Code of Ethics of the World Medical Association). Five na subjects and one of the authors were used. All subjects used bite bars and all recording was done with the room lights dimmed. Drifting stimuli were switched on from an equiluminant blank screen at the same time as the eye movement recorder was started. Stimuli were presented for 30 s or 1 min and there was an equal period of time between trials for recovery. Subjects were instructed to look in the centre of the black bar and were asked to attempt to look straight ahead at the centre of the black band but not to try to suppress “involuntary” eye movements.
OKN evoked by first-order motion First-order motion presented alone evoked a vigorous OKN with a build-up time of around 5 s confirming that the horizontal black band was effective in removing the contribution of smooth pursuit. Smooth pursuit is distinguishable from slow-build-up OKN by its initial buildup time (Crognale and Schor 1996). Here the response was clearly dominated by the slow-build-up component. After removing the fast phases from the eye movement trace, the average slow-phase steady-state velocity was measured (see Materials and methods). Figure 2
70
Fig. 3 OKN evoked by combinations of first- and second-order movement. Average slow-phase eye velocity of evoked by first-order motion presented alone (filled circles; replotted from Fig. 2), in the same direction (open triangles) as the second-order motion and in the opposite direction (filled squares) are plotted as a function of first-order stimulus contrast. Standard error bars are shown for lower contrast values, there is clearly an effect of the secondorder stimulus, either enhancing when they are in the same direction or inhibiting when they are in opposite directions
shows the variation of average slow-phase velocity with stimulus contrast for each subject. The left hand panel shows that there was considerable intersubject variability. The data are averaged in the right hand panel. The regression line through this linear-log plot has a slope of 8.4°/s per log unit of contrast and crosses the contrast axis at 3.5% contrast indicating the average threshold value of contrast for evoking OKN under these stimulus conditions. Individual thresholds varied from 1 to 6.4% with an average of 3.8% and a standard deviation of ±2%. OKN evoked by second-order motion When second-order motion was presented alone and subjects were instructed not to try to suppress eye movements, we observed periods in which OKN was clearly visible. The average velocity was 2.3°/s (±2.2°/s) corresponding to an oculomotor gain of 0.17 with considerable intersubject variability (0.2–8.3°/s). In all cases the OKN was interrupted by periods of fixation although no fixation point was provided.
OKN evoked by simultaneous luminance-defined (first-order) and flicker-frequency-defined (second-order) motion Figure 3 plots the average steady-state slow-phase eye velocities associated with three experimental conditions: first-order motion only (replotted from Fig. 2), first- and second-order motion in the same direction and first- and second-order motion in the opposite directions. Analysis of variance showed a significant main effect of condition [F(2151)=21.07; P