INTERACTIVE PROGRAMMING IN MATLAB USING MATLAB WEB SERVER A. Pavelka and A. Proch´ azka Institute of Chemical Technology, Department of Computing and Control Engineering Abstract The paper is devoted to the presentation of possibilities of the MATLAB environment using the MATLAB Web Server. WWW pages and MATLAB programs have been created giving the opportunity to try simple programming only using the Internet browser. It is obvious that this approach to MATLAB has its own specific limitations and it does not replace MATLAB environment by itself. In this way it is very suitable for presentation of fundamental MATLAB structures and for courses devoted to studies of basic algorithms and main programming principles.
1
Introduction
To increase the efficiency of educational process and to enable remote access to selected programming tools it is possible to create a special e-learning web portal grouping various scientific branches studied at the Institute of Chemical Technology, Prague. This approach can be realized by various methods including application of the MATLAB Web Server. The paper presents special techniques enabling the use of information techniques for study of algorithmisation and programming mostly in the MATLAB environment. The main goal of this method is to provide students the possibility to try simple MATLAB programming not only at the school but even at home.
2 2.1
Information Technologies Used for Web Server Application HTML Programming
Simple HTML programming almost without any graphical elements has been applied for creation of given web pages. This very simple form mostly based on the
command has been chosen to enable the short downloading time of proposed pages. The main reason of this approach was caused by the trial to minimize the time necessary for the user to work on-line as all calculations in MATLAB are executed in real-time and they can take some time according to the complexity of the given problem. As users have to wait during calculations we try at least to reduce the time for presentation of basic web pages.
2.2
JavaScript Applications
Properties and possibilities of JavaScript language has been used for creation of proposed web pages. The design of these pages have been motivated by the trial of the development of simple and user-friendly environment. The sufficient solution resulted in the application of the JavaScript. This language has been used for example during automatic opening and closing of window with MATLAB figure, for the opening separate window with help, in process of automatic filling of form by the pre-prepared examples and so on. We shall describe the scripts for automatic opening and closing of window with MATLAB figure here in detail. The 1st row stands for the definition of function named as launchfigwin. The
3rd row defines the variable img fig with its value equal to the dynamical variable $figure$, value of which is setup by MATLAB during the evaluation process and it represents the path to JPEG picture that will be shown. The 4th row defines the variable figyes with its value equal to the dynamical variable $figyes$, value of which is setup by MATLAB during the evaluation process detecting the existence of a figure. In the case of the presence of a figure the expression on the 5th row has the logical value equal to true and all following rows are executed. In the case that the expression on the 5th row has its value equal to false no operation is performed. The 7th row contains a command used to open a new window represented by variable figwin and named as with exact size of 790x600 pixels. The 8th row of the JavaScript function creates a HTML document with a centered figure that is physically located on the place represented by the variable img fig. The last three lines raise the newly opened window to the front and “close” the window for next changes. 1 2 3 4 5 6 7 8 9 10 11 12 13
function launchfigwin() {
}
var img_fig = "$figure$"; var figyes = "$figyes$"; if (figyes == 1) { figwin=window.open(’’, ’as’,"width=790,height=600"); figwin.document.write("
"); figwin.creator=parent; figwin.focus(); figwin.document.close(); }
The following JavaScript named closefigwin is very simple and it closes window of the figwin variable. 1 2 3 4
function closefigwin() { figwin.window.close(); }
The purpose of this process has been in the trial of opening a new window with a figure when the result page is loaded and its closing after the result page is changed or closed. To meet this goal we have to put both scripts as events of the body of the resulting HTML page as shown bellow. 1
3
MATLAB Background Processing
The primary goal of the study was to design flexible enough and user-friendly environment close to the original MATLAB features. The purpose was not to overload the user with the MATLAB syntax but to design pages in some parts very flexible as for user inputs and very strict as for possibilities of their processing. To meet these goals we had to create a dynamical system by strict rules. We used in advance MATLAB commands as try, catch – for preventing unexpected errors, eval – for evaluating of desired “user defined” functions and MATLAB commands, fread, fopen, fprintf, fclose – for operation with text files which store parts of dynamically created HTML pages. To describe the system the selected part of the MATLAB source code is shown. The following part of the programm presents the function graph used on the web page in its section containing Graphics Operations. The 1st up to the 4th row represent standard beginning of the function applied for the MATLAB Web Server. The designed function is called graph in our case.
1 2 3 4
function rs = graph(h,out) mlid = getfield(h, ’mlid’); cd(h.mldir);
On the 6th up to the 10th row the code for reading simple text file (e.g. see 6th row, reading gra out start.txt file) is defined forming the first part of final HTML page. The file is placed in corresponding char array variable. Its size is 1xlength, where length is the total number of characters in the text file + 2 characters per one line as CR and LF (on the Windows platform). The 12th and 13th row is filling the empty space for eventual non-error evaluation. The 15th row forms the beginning of the created final HTML page by adding the first part. 5 6 7 8 9 10 11 12 13 14 15
% loading parts of future HTML page out_start = char(fread(fopen(’gra_out_start.txt’,’r’))’); out_x = char(fread(fopen(’gra_out_x.txt’,’r’))’); out_graph = char(fread(fopen(’gra_out_graph.txt’,’r’))’); out_title = char(fread(fopen(’gra_out_title.txt’,’r’))’); out_end = char(fread(fopen(’gra_out_end.txt’,’r’))’); out.errorx = ’ ’; out.errorgraph=’ ’; out.html =[out_start];
The next part uses the safety sequence try – catch, in case that an error during the evaluation of rows 18 up to the 22 occurs the variable out.errorx announces error evaluation. The condition on the 18th row is true when the contents of the variable h.x is not empty. Value of the variable h.x has been gained from the HTML document, that call this function graph and includes some user input named x. This value is on the 19th row set in the local MATLAB variable x. On the next row the value h.x is copied into the output variable out.x and on the 21st row a part dedicated to the given variable x is added in the future final HTML document. 16 17 18 19 20 21 22 23 24 25
% is anything in x ? try if not(isempty(h.x)) eval([’x=’,h.x,’;’]) out.x=h.x; out.html = [out.html out_x]; end catch out.errorx=’Error occurred during calculation of x’; end
The following part of the code is evaluated in alike conditions like in the previous part. The 28th row contains the decision whether some plotting function is selected and the 30th row evaluates it with parameters hidden in the variable h.graphvar. A very close operation to that is on rows 34 up to 38 where the title of just plotted graph is added. Rows 29 and rows 40 up to 43 are necessary for the creation of figures under MATLAB Web Server. On the 44th row the important information for JavaScript is set – a figure has been successfully created and exists. 26 27 28 29 30 31 32 33 34 35 36 37 38 39 40 41 42 43 44 45 46 47 48
% draw figure and all the rest staff try if not(isempty(h.graph)) f = figure(’visible’,’off’); eval([h.graph,’(’,h.graphvar,’)’]); out.graph=h.graph; out.graphvar=h.graphvar; out.html = [out.html out_graph]; if not(isempty(h.title)) eval([’title(’,h.title,’)’]) out.title = h.title; out.html = [out.html out_title]; end drawnow; out.figure = sprintf(’../icons/%sgraph.jpeg’, mlid); wsprintjpeg(f, out.figure); close all; out.figyes = 1; end catch out.errorgraph=’Error occurred during calculation of graphical output’; end
In the last part of source code on the 49th row the final part of dynamically created result web page is added. The 53rd up to 55th row contains the export variable out.html into file graph out.html representing the final result page. The 57th up to 58th row contain typical last rows of a function created for the MATLAB Web Server and they cause the replacement of fields like $x$, $graph$, $graphvar$ written in HTML document graph out.html by real values from structure array out.x, out.graph, out.graphvar. Two commands for changing directory on the 52nd and 59th row presented as all *.m files are in sub-directory named m considering to location of HTML pages. 49 50 51 52 53 54 55 56 57 58 59
out.html = [out.html out_end]; % Write out.html in real HTML page cd .. fid = fopen(’graph_out.html’,’w’); fprintf(fid,out.html); fclose(fid); templatefile = which(’graph_out.html’); rs = htmlrep(out, templatefile); cd m
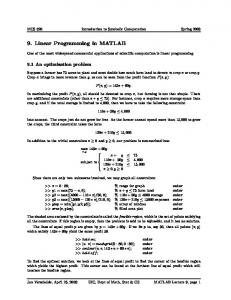
Figure 1 presents basis windows used for interactive processing of selected mathematical problems using environment described above.
Figure 1: Selected web pages
4
Summary
The fully functional web site dedicated to interactive programming in MATLAB has been successfully created. At present it forms a good basis for future upgrading of the whole web site. Next goals will cover more complicated tasks as loops, conditions and so on. The described web page is located at http://dsp.vscht.cz.
References [1] Anonymous. The MathWorks-Online Documentation. The MathWorks, Inc., Natick, MA, 13 edition, 2002. http://www.mathworks.com. [2] Pavel Mikle. Referenˇcn´ı pˇr´ıruˇcka DHTML - dynamick´e HTML. UNIS Publishing, s.r.o., Brno, 2. edition, 2001.
Prof. Aleˇs Proch´azka, Ing. Aleˇs Pavelka Institute of Chemical Technology, Prague Department of Computing and Control Engineering Technick´a 1905, 166 28 Prague 6 Phone.: 00420-2-2435 4198, Fax: 00420-2-2435 5053 E-mail:
[email protected],
[email protected] WWW: http://dsp.vscht.cz