ADVANCES IN ATMOSPHERIC SCIENCES, VOL. 25, NO. 1, 2008, 24–30
Interdecadal Change in the Connection Between Hadley Circulation and Winter Temperature in East Asia ZHOU Botao∗1,2,3 (周波涛) and WANG Huijun2 (王会军) 1
Laboratory for Climate Studies, National Climate Center, China Meteorological Administration, Beijing 100081 2
Nansen-Zhu International Research Center, Institute of Atmospheric Physics, Chinese Academy of Sciences, Beijing 100029 3
Graduate University of Chinese Academy of Sciences, Beijing 100049 (Received 23 May 2006; revised 27 March 2007) ABSTRACT
Based on NCEP/NCAR reanalysis data, the interdecadal variability of Hadley circulation (HC) and its association with East Asian temperature in winter are investigated. Results indicate that the Northern Hemisphere winter HC underwent apparent change in the 1970s, with transition occurring around 1976/77. Along with interdecadal variability of HC, its linkage to surface air temperature (SAT) in East Asia also varied decadally, from weak relations to strong relations. Such a change may be related to the interaction between HC and the atmospheric circulation system over the Philippines, which is associated with the East Asian winter monsoon (EAWM). Before the 1970s, the connection between HC and the anticyclonic circulation around the Philippines was insignificant, but after the late 1970s their linkage entered a strong regime. The intensification of this connection may therefore be responsible for the strong relations between HC and East Asian winter temperatures after the late 1970s. Key words: Hadley circulation, East Asian temperature, interdecadal change, anticyclonic circulation, Philippines DOI: 10.1007/s00376-008-0024-6
1.
Introduction
Global climate change has attracted the attention of scientists in the past few years. Previous studies have suggested that global climate has experienced a warming process, with global surface air temperature (SAT) rising by 0.6◦ C in the 20th century (Jones et al., 1999; Folland et al., 2001), with the warming trend having been most striking since the 1980s. It has also been documented that there have been two abrupt warming periods during the past 100 years (Fu and Wang, 1990; Lin et al., 1995). One was during the 1920s–1940s and the other from the 1970s till now. However, temperature change has not taken place uniformly across the globe, but varied from region to region. Wang (2001b) found that, since 1976, winter temperatures have tended to increase over continental regions in the mid to high latitudes of the ∗ Corresponding
author: ZHOU Botao,
[email protected]
Northern Hemisphere, but decrease over Greenland, the mid Pacific, northeastern North America, and the mid latitudes of the Atlantic. Although many factors can lead to temperature anomalies, atmospheric circulation, as the basic feature of the atmosphere, is the fundamental driving force for the formation and development of climate. Climate anomalies are always connected to changes in atmospheric circulation. Moreover, interdecadal variability of atmospheric circulation can, in certain regions, influence interdecadal climate change as well. For example, Li and Li (2000) showed that abrupt climate change may be closely related to anomalies of North Atlantic Oscillation (NAO) and North Pacific Oscillation (NPO). Wu and Huang (1999) proposed that NAO can give rise to anomalous East Asian temperatures through its influence on the Siberian high. Gong et al. (2001) described an apparent significant in-phase relationship
NO. 1
ZHOU AND WANG
wind and zonal wind (10 m). The pressure level data are 17-layer meridional winds. The period for the analysis is 1954–2003, wintertime. In this paper, wintertime refers to the period from December to the February of the following year.
(a)
3.
(b)
—UF ---
UB
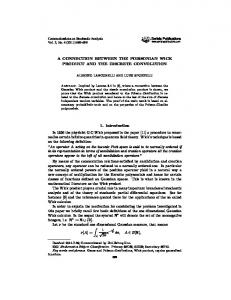
Fig. 1. (a) Time series of the HC index (bar) and its 11-year running mean curve (solid line) and linear trend (dashed line). (b) Mann-Kendall test for the winter HC index.
between Arctic Oscillation (AO) and East Asian winter temperatures. Work by Ju and Ren (2003) also proved that variations of AO have a great effect on increasing winter temperatures in East Asia. Due to the unique location of East Asia, climate change in this region is affected not only by the abovementioned atmospheric circulation in the high latitudes, but also by that in the low latitudes. Hadley circulation (HC) in the tropics, which plays an important role in atmospheric circulation, can exert an impact on temperature anomalies in the high latitudes and in East Asia (Oort and Peixoto, 1983; Li, 1990; Chang, 1995; Hou and Molod, 1995). Recently, many studies have suggested that interdecadal changes in atmospheric circulation existed in the 1970s (Trenberth, 1990; Trenberth and Hurrell, 1994; Chang et al., 2000; Wang, 2001a). The motivation of this work is to address the interdecadal variation of winter HC and its links to East Asian winter temperatures. 2.
25
Data
The dataset employed in this study is the atmospheric reanalysis data provided by the National Centers for Environmental Prediction/National Center for Atmospheric Research (NCEP/NCAR) (Kalnay et al., 1996). The surface quantities include SAT, meridional
Relationship between HC and East Asian temperatures in winter
First of all, the temporal variations of Northern Hemisphere winter HC are analyzed. In order to describe its variations, the definition of a HC index by Oort and Yienger (1996) is adopted, which defines the maximum positive value of the zonal mean mass streamfunction occurring within the latitudinal zone of 0◦ –30◦ N to measure HC intensity. As can be seen from Fig. 1a, HC exhibits not only interannual but also interdecadal variability. Before the mid 1970s, the HC index almost lies in the negative phase, and HC is weak. After the mid 1970s, the HC index is mainly in the positive phase, and HC is strong. The interdecadal variations of HC can be well reflected by 11-year running mean curve. As shown by the solid line, values are negative for the period 1959–1977 and positive for 1978–1998, which demonstrates noticeable interdecadal variability of HC. Additionally, an upward trend of HC can be found from the linear trend line in Fig. 1a, which is consistent with the results of previous studies (Chen et al., 2002; Quan et al., 2004; Tanaka et al., 2004). In order to detect the climate transition of winter HC in the 1970s, a Mann-Kendall test was performed on the HC index (Fig. 1b). It may be concluded from the intersection of the UF line and UB line that the transition of HC occurred at around 1976/77. In addition, it can be seen from the UF line that winter HC had an ascending trend at the 99% level from the late 1970s onwards. However, because spurious trends can be produced by reanalysis data, the validity of this may be questioned. Recently, Mitas and Clement (2005) examined HC structure and intensity in various commonly used datasets, including NCEP/NCAR reanalysis (NCEP1), the National Centers for Environmental Prediction/Department of Energy (NCEPDOE) reanalysis (NCEP2), the European Center for Medium range Weather Forecasting (ECMWF) 40year reanalysis (ERA40), rawinsonde data, and one set of model simulations. This work indicated that both NCEP1 and ERA40 show an upward tendency of HC over the last few decades, albeit with different trend values, which conforms to observed satellite radiation measurements. The fact that there has been an increase in HC over the entire period implies that
26
INTERDECADAL CHANGE BETWEEN HC AND WINTER SAT IN EAST ASIA
(a)
(b)
Fig. 2. Correlations between the HC index and SAT in winter during (a) 1954–1976 and (b) 1981–2003. Regions above the 95% significance level are shaded.
Table 1. Correlations between the winter HC index, SAT and vorticity. Winter HC index
SAT Vorticity
1954–2003
1954–1976
1981–2003
0.32 −0.18
−0.11 −0.05
0.45 −0.57
it is not an artifact of the inclusion of the satellite data in the post-1979 period because the trend exists both before and after 1979. This is in contrast to trends in temperature and humidity in the ERA40 reanalysis, which have been attributed to the inclusion of satellite data by Bengtsson et al. (2004). Besides, the ensemble of the model simulations shows a statistically significant intensification over the period 1950–2000, though it is smaller in magnitude than that in the NCEP1 and ERA40 reanalyses. Nevertheless, the NECP2 reanalysis exhibits no intensification in HC over its period. The rawinsonde data also displays no discernible long-
VOL. 25
term trend because of spatial coverage indicated by Waliser et al. (1999). Due to discrepancies among the abovementioned datasets, the robustness of the trend in HC must be refined. Figures 2a and 2b present the spatial distribution of correlations between the HC index and SAT during weak and strong HC stages, respectively. To ensure the equal sample number in each stage, we take 1954–1976 as the weak HC stage and 1981–2003 as the strong HC stage in this study. Comparing these two figures, it can be seen that during the period 1954– 1976 winter HC is positively and significantly correlated to SAT over Sumatra and Kalimantan, and negatively correlated to SAT from the southeast of China to the north flank of Japan; however, the negatives over China are not predominant, not passing the 95% significance level. During the period 1981–2003, a southwest-northeast oriented belt distribution of significant in-phase correlations exists from the low latitudes to the high latitudes (shaded in Fig. 2b). Particularly, the positives are prominent along the coast of China with a maximum value of 0.5, implying SAT in this region gets warmer when winter HC is stronger. To further illustrate the relationship of HC with East Asian SAT on an interdecadal timescale, the correlation coefficient between the HC index and SAT averaged over the region (20◦ –40◦ N, 110◦ –140◦ E) was calculated (see Table 1). This indicates significant correlation over both the entire period and the strong HC decades. The coefficients during the periods 1954– 2003 and 1981–2003 are 0.32 and 0.45, respectively. Nevertheless, during the weak HC decades, winter HC is not significantly related to East Asian SAT, with a value of only −0.11. It is therefore demonstrated that the links between HC and East Asian SAT in winter changes decadally. 4.
Possible reason for the interdecadal change of the connection between HC and East Asian SAT
It is well known that the intensity of the East Asian winter monsoon (EAWM) is one of the crucial factors that impacts upon East Asian temperatures. So far, there are many indices that represent EAWM activity. In this study, the definition of the EAWM index by Chen et al. (2000), which is the averaged meridional component of surface wind (10 m) over the area (25◦ – 40◦ N, 120◦ –140◦ E) and (10◦ –25◦ N, 110◦ –130◦ E), is exploited. A negative EAWM index indicates a strong winter monsoon year when the regional mean northerlies are strong enough to influence the region south of the Yangtze River valley, and vice versa. Figure 3 presents correlations between the EAWM index and
NO. 1
27
ZHOU AND WANG
)a Ph (t hg ie H
Fig. 3. Correlations between the EAWM index and winter SAT. Regions above the 95% significance level are shaded.
Fig. 5. Latitude-height cross section showing correlations between the HC index, meridional wind and vertical velocity along 110◦ –150◦ E during 1981–2003. Shading indicates correlations between the HC index and vertical velocity above the 95% significance level.
A
A Fig. 4. Correlations between the EAWM index and the surface wind field. Regions where correlations of the EAWM index with meridional wind exceed the 95% significance level are shaded.
SAT. Evidently, the positives are predominant over the region south of 50◦ N in East Asia with a maximum coefficient above 0.7. It is implied that cold air southward is weakened and East Asian SAT will be warmed under the conditions of a weak EAWM, and the case is adverse in the strong EAWM. Correlations of the EAWM index with the surface wind field are shown in Fig. 4. It is clear that accompanying the weak (strong) EAWM, an anomalous anticyclonic (cyclonic) circulation appears around the Philippines and southerly (northerly) anomalies are dominant over the Indo-China Peninsula, the South China Sea, and East Asia. This result reflects those of Chen et al. (2000) and Li et al. (2005). Figure 5 shows simultaneous correlation between the HC index and local meridional circulation along
Fig. 6. Correlations between the HC index and the surface wind field during 1981–2003. Regions where correlations between the HC index and meridional wind exceed the 95% significance level are shaded.
110◦ –150◦ E in the strong HC decades. Corresponding to stronger HC, anomalous local meridional circulation is clearly obvious in the low latitudes. Concurrently, downward motion occupies almost the whole troposphere south of 20◦ N, which may result in the strengthening of the anticyclonic circulation anomaly over the Philippines. This agrees well with the direct correlations of winter HC with the surface wind field (Fig. 6). As shown in Fig. 6, an anomalous anticyclonic circulation exists around the Philippines in the
28
INTERDECADAL CHANGE BETWEEN HC AND WINTER SAT IN EAST ASIA
(a)
(b)
Fig. 7. Correlations between HC and vorticity during (a) 1954–1976 and (b) 1981–2003. Regions above the 95% significance level are shaded. Table 2. Correlations between the EAWM index, SAT and vorticity.
VOL. 25
phase correlations around the Philippines are significant during strong HC decades. To further analyze the relationship of the anticyclonic circulation with HC and the EAWM, the running correlations of vorticity averaged in the region (7.5◦ –20◦ N, 125◦ –140◦ E, shown as the rectangle in Fig. 7) with the HC index and the EAWM index are displayed in Fig. 8. The correlations were calculated using a 19-year sliding window from 1954–1972 to 1995–2003. The year on the abscissa indicates the first year of the window, i.e., 1954, labels the period 1954–1972. As seen from Fig. 8, the out-of-phase relationship between vorticity and the EAWM index seems to be very stable, significant at the 95% level during the whole period. Unlike the correlations of vorticity with the EAWM, vorticity is unsteadily related to the HC index. Before the mid 1960s, their correlations are relatively small, almost fluctuating around zero. After that, negative correlations are amplified and significant at the 95% level from the late 1970s. This demonstrates that corresponding to the transition of HC from a low index to a high index, the relationship between HC and vorticity near the Philippines experiences interdecadal change. This can also be confirmed by the direct correlation of vorticity with HC (Table 1) and the EAWM (Table 2) during two stages. Whether during 1954–1976 or 1981–2003, vorticity is always negatively and significantly correlated with the EAWM. However, the correlation coefficient between HC and vorticity is only −0.05, with almost linear independence during 1954–1976, whereas during 1981– 2003 the correlation coefficient between them is −0.57 at the 99% level. Therefore, the affinitive connection of HC with the EAWM and East Asian SAT in winter after the late 1970s can be demonstrated via the anticyclonic circulation east of the Philippines, which could link HC and the EAWM.
EAWM
SAT Vorticity
1954–2003
1954–1976
1981–2003
0.71 −0.67
0.81 −0.71
0.67 −0.66
strong HC stage; that is, when HC is in a positive phase, the anticyclonic circulation anomaly appears east of the Philippines. This is not the case, however, during weak HC stages (figure not shown). The descending branch south of 20◦ N does not exist, and thus the anticyclonic circulation anomaly does not come into being around the Philippines. These features can also be proved by the correlations between the HC index and vorticity at 10 m during two stages shown in Fig. 7. The correlations over the Philippines are not significant during weak HC decades, whereas out-of-
90% level
95% level
Fig. 8. 19-year running correlations of vorticity with the HC index (solid line with dots) and the EAWM index (dashed line).
NO. 1
5.
ZHOU AND WANG
Discussion and conclusions
The interdecadal variability of Northern Hemisphere winter HC and its links to East Asian winter SAT have been examined. Conclusions can be drawn as follows: Winter HC exhibits not only interannual variability but also interdecadal variability. HC changed in the mid 1970s, having previously been in a negative phase before progressing into a positive phase after this time. The transition took place around 1976/77. The results also show that the association of HC with East Asian SAT in winter goes through an interdacadal change from weak to strong relations. Their relationship is prominent in the strong HC decades, while less conspicuous in weak HC decades. A possible reason why the connection between HC and East Asian SAT in winter changes decadally was preliminarily identified in this study. Naturally, the changes of East Asian SAT are affected by the EAWM. The relationship between HC and the EAWM was also analyzed through correlation analysis, which showed that winter HC is closely related to the anticyclonic circulation system around the Philippines, which is linked to the EAWM after the late 1970s, while before this time their connection was not significant. Therefore, the close relationship between HC and East Asian SAT after the late 1970s is thought to be attributable to the intensified interaction between winter HC and the anticyclonic circulation around the Philippines. However, the results are based on correlation analysis, and because correlations do not establish causality, the dynamic mechanism of the process is not very clear. In addition, other processes may also be related to the links of winter HC to the EAWM and East Asian SAT. Also, what gives rise to the interdecadal change of the interaction between HC and the atmospheric circulation system around the Philippines remains unknown. All of these issues should be studied further in future research. Acknowledgements. The authors would like to thank the anonymous reviewers for their valuable comments and helpful suggestions. This work was jointly supported by the Chinese Academy of Sciences Key Program under Grant No. KZCX3-SW-221 and the National Natural Science Foundation of China under Grant No. 40620130113. REFERENCES Bengtsson, L., S. Hagemann, and K. I. Hodges, 2004: Can climate trends be calculated from reanalysis data? J. Geophys. Res., 109, D11111, doi:10.1029/2004JD004536.
29
Chang, C. P., Y. S. Zhang, and T. Li, 2000: Interannual and interdecadal variations of the East Asian summer monsoon and tropical Pacific SSTs. Part I: Roles of the subtropical ridge. J. Climate, 13, 4310–4325. Chang, E. K. M., 1995: The influence of Hadley circulation intensity changes on extratropical climate in an idealized model. J. Atmos. Sci., 52, 2006–2024. Chen, J. Y., B. E. Carlson, and A. D. Genio, 2002: Evidence for strengthening of the tropical general circulation in the 1990s. Science, 295, 838–841. Chen, W., H. F. Graf, and R. H. Huang, 2000: The interannual variability of East Asian winter monsoon and its relation to the summer monsoon. Adv. Atmos. Sci., 17, 48–60. Folland, C. K., and Coauthors, 2001: Observed climate variability and change. Climate Change 2001: The Scientific Basis. Houghton et al., Eds., Cambridge University Press, New York, 99–181. Fu, C. B., and Q. Wang, 1990: On the abrupt change in south Asian summer monsoon climate and its synchronism with the global rapid warming. Science in China (Series B), 6, 666–672. (in Chinese) Gong, D. Y., S. W. Wang, and J. H. Zhu, 2001: East Asian winter monsoon and Arctic oscillation. Geophys. Res. Lett., 28, 2073–2076. Hou, A. Y., and A. Molod, 1995: Modulation of dynamic heating in the winter extratropics associated with the cross-equatorial Hadley circulation. J. Atmos. Sci., 52, 2609–2626. Jones, P. D., M. New, D. E. Parker, S. Martin, and I. G. Rigor, 1999: Surface air temperature and its changes over the past 150 years. Rev. Geophys., 37, 173–200. Ju, J. H., and J. Z. Ren, 2003: Effect of interdecadal variation of Arctic Oscillation on temperature increasing in north of East Asian winter. Journal of Yunnan University, 25, 518–524. (in Chinese) Kalnay, E., and Coauthors, 1996: NCEP/NCAR 40-year reanalysis project. Bull. Amer. Meteor. Soc., 77, 437–471. Li, C. Y., 1990: Interaction between anomalous winter Monsoon in East Asia and El Ni˜ no events. Adv. Atmos. Sci., 7, 36–46. Li, C. Y., and G. L. Li, 2000: The NPO/NAO and interdecadal climate variation in China. Adv. Atmos. Sci., 17, 555–561. Li, C. Y., S. Q. Pei, and Y. Pu, 2005: Dynamical impact of anomalous East-Asian winter monsoon on zonal wind over the equatorial western Pacific. Chinese Science Bulletin, 50, 1520–1526. Lin, X. C., S. Q. Yu, and G. L. Tang, 1995: Series of average air temperature over China for the last 100-year period. Scientia Atmospherica Sinica, 19, 525–532. (in Chinese) Mitas, C. M., and A. Clement, 2005: Has the Hadley cell been strengthening in recent decades? Geophys. Res. Lett., 32, L03809, doi:10.1029/2004GL021765. Oort, A. H., and J. P. Peixoto, 1983: Global angular momentum and energy balance requirements from observations. Advances in Geophysics, 25, 355–490.
30
INTERDECADAL CHANGE BETWEEN HC AND WINTER SAT IN EAST ASIA
Oort, A. H., and J. J. Yienger, 1996: Observed international variability in the Hadley circulation and its connection to ENSO. J. Climate, 9, 2751–2767. Quan, X. W., H. F. Diaz, and M. P. Hoerling, 2004: Change of the Hadley circulation since 1950. The Hadley Circulation: Past, Present, and Future. H. F. Diaz and R. S. Bradley, Eds., Kluwer Academic Publishers, Dordrecht, 85–120. Tanaka, H. L., N. Ishizaki, and A. Kitoh, 2004: Trend and interannual variability of Walker, monsoon and Hadley circulations defined by velocity potential in the upper troposphere. Tellus, 56A, 250–29. Trenberth, K. E., 1990: Recent observed interdecadal climate change in the Northern Hemisphere. Bull. Amer. Meteor. Soc., 71, 988–993. Trenberth, K. E., and J. W. Hurrell, 1994: Decadal
VOL. 25
atmosphere-ocean variations in the Pacific. Climate Dyn., 9, 303–319. Waliser, D. E., Z. Shi, J. R. Lanzante, and A. H. Oort, 1999: The Hadley circulation: Assessing NCEP/NCAR reanalysis and sparse in situ estimates. Climate Dyn., 15, 719–735. Wang, H. J., 2001a: The weakening of the Asian monsoon circulation after the end of 1970s. Adv. Atmos. Sci., 18, 376–386. Wang, S. W., 2001b: Advances in the Study of Modern Climatology. China Meteorological Press, Beijing, 458pp. (in Chinese) Wu, B. Y., and R. H. Huang, 1999: Effects of the extremes in the North Atlantic Oscillation on East Asian winter monsoon. Chinese J. Atmos. Sci., 23, 641–651. (in Chinese)