zation often are increased when microbial predators are present (Anderson .... of soil organic matter as described in the Tramin model (Juma and Paul,.
Geoderma, 57 (1993) 3-30 Elsevier Science Publishers B.V., Amsterdam
3
Interrelationships between soil structure/texture, soil biota/soil organic matter and crop production Noorallah G. Juma Department of Soil Science, Universityof Alberta, Edmonton, Alta. AB TG6 2E3, Canada (Received March 28, 1992; accepted after revision August 27, 1992)
ABSTRACT Juma, N.G., 1993. Interrelationships between soil structure/texture, soil biota/soil organic matter and crop production. In: L. Brussaard and M.J. Kooistra (Editors), Int. Workshop on Methods of Research on Soil Structure/Soil Biota Interrelationships. Geoderma, 57: 3-30. Interrelationships between soil structure/texture, soil biota/soil organic matter and crop productivity occur from a scale of micrometres to metres. In this paper an attempt has been made to integrate and quantify these interrelationships by using the themes of C and N mineralization and porosity using data from soils in western Canada. Although the concept of soil porosity (texture and structure) has been used to describe water and air movement in soil, it has not been fully explored to describe microbial, faunal and plant interactions. Future work has to incorporate the effects of soil porosity on biological processes in agro-ecosystems.
INTRODUCTION
Net primary production is an integrative measurement of numerous physical, chemical and biological processes operating within and outside the soil. In the field of soil microbiology and biochemistry, an understanding of the composition of soil microorganisms and their role in decomposition and nutrient cycling in agro-ecosystems has received a great deal of attention in the past 30 years. Measurement of the activity of organisms and their impact on various processes has led to a development of a variety of simulation models which have been used as tools of integrating existing knowledge and for testing hypotheses. In contrast, work in soil zoology and micromorphology has examined the role of fauna and plant roots in soil structure formation and alteration of porosity. Observations of soil thin section show clear evidence of plant root and faunal activity but quantification of soil porosity and its Correspondence to: N.G. Juma, Department of Soil Science, University of Alberta, Edmonton, Alta. TG6 2E3, Canada.
0016-7061/93/$06.00 © 1993 Elsevier Science Publishers B.V. All rights reserved.
4
N.G. JUMA Plant Production
Soil Texture and Structure
SoIl Biota and Organic Matter
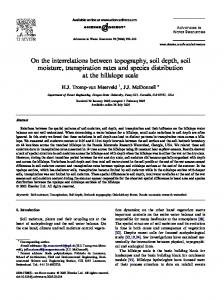
Fig. 1. A conceptual framework for studying the interrelationships of soil structure/texture, soil biota/soil organic matter and plant growth using the themes of porosity and mineralization of C and N. The impact of soil texture and structure on various processes occurs through changes in porosity.
impact on soil processes has been achieved to a limited extent. Porosity affects the microbial-faunal interactions, aeration and water relations, thus soil fauna and plants may have direct and indirect effects on a number of soil processes. There is a need to develop concepts to integrate information obtained at various scales of resolution and from various disciplines to understand controls on crop production. The objective of this work was to develop a framework to quantify the interrelationships between soil structure/texture, soil biota/soil organic matter and crop production by using porosity and mineralization of carbon and nitrogen as integrating themes (Fig. 1 ). HOW TO ASSESS INTERRELATIONSHIPS BETWEEN SOIL STRUCTURE/TEXTURE AND SOIL MICROBIAL-FAUNAL ACTIVITY THROUGH CARBON AND NITROGEN TRANSFORMATIONS
In order to understand some of the interrelationships between soil structure and texture on microbial and faunal activity, it is necessary to quantify pore size distribution, microbial and faunal populations, and C and N dynamics. Although a number of microscopic and submicroscopic techniques are available to study the organisms, organic and inorganic components, and pore size distributions, a coarser-scale of resolution was chosen to integrate the information because it allowed the use of knowledge from other disciplines of soil science, especially soil physics.
Literature review of methods used Texture and structure affect pore space, bacterial and faunal populations and their activity in soil. Pore size distribution may be determined by image
SOIL STRUCTURE/TEXTURE, SOIL BIOTA/SOIL ORGANIC MATTER AND CROP PRODUCTION
5
analysis or by camera lucida (Darbyshire et al., 1985, 1989). Effective pore size distribution may be estimated from the soil moisture retention curve by the capillary rise equation (Hattori and Hattori, 1976; Papendick and Campbell, 1981; EUiott et al., 1984). Papendick and Campbell ( 1981 ) showed that the proportion of pores equal or less than 3/tm were 72% for clay, 40% for silt and 22% for sandy soils. Fine-textured soils generally have a larger proportion of small pores than coarse-textured soils. Habitable pore space accounts for a small portion of total pore space and affects bacterial and faunal distribution in soils. Microorganisms and small fauna require water films, hence most decomposition of organic matter occurs within water-filled pores (Bamforth, 1988 ). Bacteria probably have the most favorable environment in aggregates with small diameter pores. These pores retain water longer in a drying soil and may offer better protection from faunal predators than larger pores and aggregate surfaces (Hattori and Hattori, 1976; Vargas and Hattori, 1986; Foster, 1988 ). Up to 60% of soil bacteria pass through a 0.8/lm membrane filter (Bakken and Olsen, 1987 ). Since there is approximately a 3:1 ratio between the diameter of pores and the diameter of bacteria (Kilbertus, 1980), a large proportion of bacteria may occupy pores < 2.4/zm diameter. This small pore size may restrict predation of bacteria by some fauna, such as nematodes and large ciliates. However, some small protozoa can occupy pores down to 2/~m diameter (Bamforth, 1985 ), potentially allowing them to be effective predators of many bacteria. Bacteria contained within pores < 2 #m would be "protected" from protozoan predation. More research is needed to elucidate the effects of pore space on bacterial population size and grazer activity (Elliott et al., 1980). In arable soils free-living protozoa affect the number of bacteria and influence nutrient cycling in the short term (Clarholm, 1984; Bamforth, 1985). Microcosm studies have shown that microbial turnover rates and mineralization often are increased when microbial predators are present (Anderson et al., 1981; Coleman et al., 1984; Clarholm, 1985; Griffiths, 1986; Kuikman and Van Veen, 1989). When fauna respire CO2-C, N should be mineralized because the C:N ratio of fauna are similar to the bacteria that are grazed (Coleman et al., 1984). Nitrogen mineralized by protozoa makes N more available to microbes and plants under N limiting conditions and may be important in decreasing the limitation on plant growth or microbial decomposition rate of high C / N ratio substrates (Anderson et al., 1981; Clarholm, 1985; Robinson et al., 1989). Turnover of C and N within the microbial biomass is faster in coarse-textured soils than in fine-textured soils (Van Veen et al., 1984, 1985; Merckx et al., 1985 ). Textural effects may impose physical restrictions on the ability of fauna to graze on microbes, therefore texture may play a role in faunal-induced mineralization of microbial C and N. Elliott et al. (1980) found, in part, that amoeba grazed bacteria more in a sandy loam subsoil than in a clay
6
N.G. JUMA
subsoil. This was characterized by higher amoebal numbers and a greater increase in CO2-C evolution in the sandy loam. The effect of texture on N mineralization was not reported. Gupta and Germida (1989), studying the protozoa-induced mineralization of bacterial sulfur, found that amoeba in a loamy sand soil reduced bacterial numbers more than in a sandy clay loam soil. The rate of CO2-C production in the loamy sand increased more than in the sandy clay loam when protozoa were added. They thought that a higher number of large pores in the loamy sand soil could explain the larger grazing effect compared to the sandy clay loam soil. In order to generalize results, it is necessary to link the dynamics of microbial and faunal populations to soil processes (Richards, 1974). One approach is through simulation modelling. A variety of simulation models describing the mineralization and immobilization of N (Frissel and Van Veen, 1981; Juma and Paul, 1981; McGill et al., 1981; Voroney et al., 1981; Van Veen et al., 1984; Parton et al., 1988) and food webs (Hunt et al., 1984, 1987, 1989; Moore et al., 1990) already exist. Most soil organic N models emphasize the dynamics of microbial biomass. In contrast, soil food web models describe the microbial-faunal interactions explicitly but do not describe soil organic matter dynamics adequately. Few studies have reported the effects of soil texture on bacterial-protozoan interactions in soil, including C and N mineralization (Rutherford, 1991 ). Effect of texture~structure on microbial and faunal interactions and C and N dynamics An integrated study to measure the effects of texture on dynamics of bacteria, C and N mineralization in the presence and absence of predators, and quantify the effect of predators on the flux of C and N in soils with different textures was conducted by Rutherford and Juma ( 1992a-d). A summary of the approach and results obtained is presented below. The microcosm experiment consisted of samples from three sterilized Typic Cryoborolls (SIC, CL and SL texture) (Table 1 ) inoculated with Pseudomonas bacteria, two treatments (with and without protozoa), and five sampling dates. The Pseudomonas population was labelled in situ by adding glucoseJ 4C and KNO3J 5N (Day 0). A species of Acanthamoeba was added to the microcosms on Day 2. Detailed descriptions of the experimental design and procedures are given by Rutherford and Juma ( 1992a, b). The initial effective pores between 0.75 and 2.0/zm effective diameter made up 4.3, 3.1 and 2.4% of the soil volume for Soil A, Soil B and Soil C, respectively. It was assumed that bacteria contained within this pore size range were protected from protozoa predation. Pores between 2.0 and 9.7/zm effective diameter made up 7.0, 5.6 and 3.4% of the soil volume for Soil A, Soil B and Soil C, respectively. It was assumed that protozoa would inhabit pores within
SOIL STRUCTURE/TEXTURE, SOIL BIOTA/SOILORGANIC MATTERAND CROP PRODUCTION
7
TABLE 1 Selected chemical and physical properties of the three Typic Cryoborolls Soil
pH a
C (%)
N (%)
Sand (%)
Silt (%)
Clay (%)
Texture b
Bulk density ( g c m -3)
A B C
6.7 6,8 6.5
8.19 5.14 2.60
0.62 0.42 0.31
9 37 74
46 31 9
45 32 17
SiC CL SL
0.85 0.95 1.02
a 1:2 soil:water. bParticle size analysis was done by the hydrometer method.
this range. The ratio of "protected" pore volume (0.75-2.0 #m effective diameter) to "non-protected" pore volume (2.0-9.7/tm effective diameter) was 1.6, 1.8 and 1.4 for Soil A, Soil B and Soil C, respectively. On Day 4 bacterial numbers in all three soils were approximately 3 × 10⁹ g- ~soil. The greatest reduction of bacteria due to protozoan grazing occurred between Day 4 and Day 7 (Rutherford and Juma, 1992b). Compared to the protozoa-minus treatment, bacteria in the protozoa-plus treatment were reduced by 68, 50, and 75% in Soil A, Soil B and Soil C, respectively. On Day 4, two days after protozoa inoculation, protozoa were all active. Numbers were 10,330, 4760 and 15,380 g-~ soil for Soil A, Soil B and Soil C, respectively. Between Day 4 and Day 7, the period of greatest bacterial decline, total protozoa increased greatly to 150,480, 96,160, and 192,100 g-1 soil for the three soils, respectively. Most protozoa became encysted by Day 7. Our resuits support the hypothesis that bacteria are more protected from protozoan predation in fine-textured soil than in coarse-textured soil. All soils showed increased significant CO2-~4C evolution and NH4-15N mineralization due to protozoan grazing. The mineralization rate of labelled N in the Soil C was much greater than in Soils A and B. Protozoan induced effects were transient in the soils studied and were most apparent in the coarsetextured soil (Rutherford and Juma, 1992b). Experiments described above led to the development of a new model to describe bacterial-protozoan interactions and their impact on C and N cycling in two soils with different textures. This model integrated the concepts of soil organic matter as described in the Tramin model (Juma and Paul, 1981 ) and the bacteria-protozoa component of the food web model (Hunt et al., 1984). The unique features of this model are: (i) it combines the food chain with specific soil C and N pools, and (ii) it simultaneously traces the flows of C, 14C, N and ~SN. A simplified flow chart is presented in Fig. 2.
Linkage of physical characteristics to biological processes in soil In order to link the physical characteristics of soils to the biological pro-
8
N.G.JUMA Glucose
C
_1
C
Amoebal C
E I Bacterial N r I
Amoobal N
~--I vI
Bacterial
[
I Soluble C
Stable
C
Active C
I~"
j-
Soluble N
StableN ~
ActlveN I~
Fig. 2. Flow chart of C and N transfers in the simulation model describing bacterial amoebal interactions and organic matter dynamics in soil.
cesses in soil and to simulate the predation of bacteria by protozoa in a clay loam soil, we described the consumption (P) of bacteria (pg C g- t soil day- ~) by protozoa with a Type III sigmoid functional response (Hunt et al., 1984 ):
P= VA/[ 1+ (K/B)") ]
( 1)
where Vis the relative maximum feeding rate of protozoa on bacteria (day- 1); A is amoebal C (/zg C g- ~ soil ); B is bacterial C (/zg C g- ~ soil); K is the half saturation constant for protozoan consumption of bacteria (#g C g-1 soil); and n is a nondimensional shape parameter set to 10. This equation gives near maximum grazing when B>>K, but reduces grazing disproportionally when B < K. It was possible to produce a model that fitted the data observed for the clay loam soil. The simulated CO2-C evolved during the first 12 clays was mainly due to glucose addition ( 171/zg C g- t soil) and internal cycling of C in the soil ( 160 #g C g- ~soil ). During this interval, bacterial C uptake was 5.5-fold greater than the initial bacterial C pool size (Rutherford and Juma, 1992c). Protozoan addition to soil directly increased total COz-C evolution by 11%
SOIL STRUCTURE/TEXTURE, SOIL BIOTA/SOIL ORGANIC MATTER AND CROP PRODUCTION
9
and mineralized twice as much NH4-N as did bacteria during the first 12 days compared to the protozoa-minus treatment. Mineralization of C and N was rapid when bacterial numbers were increased as a result of glucose addition. Model performance was also tested with the data set obtained for a sandy loam (Rutherford and Juma, 1992d). We lowered the value of the half saturation constant for the protozoan consumption of bacteria from 175 to 50 (/tg C g- ~soil ) and initialized the state variables with measured initial values for this soil. The CO2-C evolved during the first 12 days was mainly due to glucose addition ( 180/lg C g- 1 soil) and internal cycling of C in the soil ( 130 #g C g- 1 soil ). During this interval, C inputs into bacteria were 14-fold greater than the inital pool size. Protozoa increased total CO2-C evolution by 16% and increased net NH4-N mineralization 3.5-fold compared to the protozoaminus treatment. Mineralization of C and N was more rapid in the sandy loam than in the clay loam when bacterial numbers were increased due to glucose addition. The model represented the hypothesis put forward by Rutherford and Juma (1992b) that protozoa more effectively grazed bacteria and mineralized more C as CO2-C and N as NHa-N in a coarse-textured soil than in a fine-textured soil, and was a good way to check the internal consistency of several hypotheses about pools and flow rates and provided additional information on the flows of C and N within various soil pools which could not be determined experimentally. For example, in fine-textured soil the largest 15N pool on Day 12 was the active pool, followed by the stable, bacterial, amoebal and soluble pools (Fig. 3). However, in the coarse-textured soil the largest 15N pool was the stable pool, followed by the active, amoebal, bacterial and soluble pools (Fig. 3 ). Thus, soil texture affected bacterial-protozoan interactions and the dynamics and partitioning of added N. Mathematical modelling of the microcosm experiment provided a rigorous link between soil organism populations and the processes in the C and N cycles. Differences in soil texture, which impacted on bacterial-protozoan interactions, were incorporated into the model to predict the effect that texture had on protozoan-induced mineralization of bacterial N. The link between the biological interactions within different physical environments in the two soils (Soil B, a clay loam; Soil C, a sandy loam) were explored with a Type III sigmoid functional response of bacterial grazing by protozoa (eq. 1 ). Reduction of the half saturation constant (K) for the protozoan consumption of bacteria effectively adapted the model from a soil in which bacteria were well protected from protozoan predation (Soil B ) to a soil in which they were not well protected (Soil C). Future research Several physical (texture, structure, pore size distribution), chemical (cation exchange capacity, mineralogy) and biological (mobility of organisms,
10
N.G.JUMA 100
'
80'
60
8
40
• [] [] D
Amoebal Bacterial Amoabal Bacterial
CO 2 - C CO 2 - C C C
•
Active C
[]
Soluble C
m [] I~ [q [] • [] •
Arnoabal NH 4 - N Be,cterial NH 4 - N Arnoebal N Bacterial N Stable N Active N Soluble N NO:)- N
20
100 80 v ~' >= o
60 40
z 20 (]
Bacteria
Bacteria Bacteria + Protozoa
Bacteria + Protozoa
Soil B
Soil C
(clay loam)
(sandy loam)
Fig. 3. Model simulation of ~4C and tSN distribution on Day 12 for Soil B and Soil C, with and without protozoa.
types of fauna) factors affect K. Future research to develop an explicit link between these factors and predator-prey activities in soil is needed to link the impact of soil porosity on mineralization of C and N by soil organisms. HOW TO ASSESS INTERRELATIONSHIPS BETWEEN SOIL MICROBIAL-FAUNAL ACTIVITY AND SOIL ORGANIC MATTER THROUGH CARBON AND NITROGEN TRANSFORMATIONS UNDER CONTROLLED CONDITIONS
The amount of N mineralized over a ~owing season is influenced by many factors such as climate, crop residues, previous management, biological activity and soil type. Mineralization and immobilization of N are continuous simultaneous processes which are mediated by soil organisms (Jansson and Persson, 1982). Microbial biomass serves two major purposes: (i) it is a source and sink of N, and (ii) it is a transformation agent for soil N (Anderson and Domsch, 1980; Paul and Voroney, 1980). Internal cycling of C and N occurs during microbial growth and death in soil. In this section, the approaches used to measure mineralization and immobilization of N in samples from the surface horizons of cultivated soils are presented. The description of micro-
SOIL STRUCTURE/TEXTURE, SOIL BIOTA/SOIL ORGANIC MATTER AND CROP PRODUCTION
11
bial faunal interactions is not presented at this scale of resolution because data for soil fauna are less available than those for microbial biomass.
Methods for quantifying pools and dynamics of soil organic matter The dynamics of soil organic C and N have been studied by four main approaches over the past 100 years: (i) acid hydrolysis; (ii) classical humic fractionation techniques; (iii) particle size fractionation; and (iv) the kinetic approach, which categorizes heterogeneous organic materials by their decomposition rates and disregards their chemical identity. The kinetic approach, developed by Paul and Juma ( 1981 ), advanced the pioneering work of Jansson ( 1958 ) and Jenkinson ( 1966 ) by dividing soil organic N into four pools: (i) microbial biomass (mainly bacteria and fungi); (ii) non-microbial active N; (iii) stabilized fraction; and (iv) old organic matter. This approach has been successful at predicting mineralization-immobilization turnover of N in soils (Juma and McGill, 1986). The advantage of this method of organic matter study is thai the chloroform fumigation method for determination of microbial C and N (Jenkinson and Powlson, 1976) can be used to directly link the decomposer food web with elemental cycling. Use of 14C and 15N tracers allows the dynamics and partitioning of amended C and N to be followed amongst various pools in the plant-soil system (Paul and Juma, 1981 ). The advantages of these methods and representative examples have been reviewed by Juma and McGill ( 1986 ).
Use of simulation models Many simulation models have been developed to describe the N cycle in soil (Frissel and Van Veen, 1981 ). Internal cycling of C and N occurs during microbial growth and death in soil. The size and activity of microbial biomass is explicitly defined in most mechanistic models describing C and N dynamics. The role of soil fauna in communition, grazing and nutrient cycling may be defined or implied (Hunt and Parton, 1986). The relation of activity of soil fauna either directly to the decomposition of residues and soil organic matter or indirectly through alteration of soil porosity have not been well quantified. Therefore, many models do not include faunal activity to describe the internal cycling of C and N. A systematic analysis of the models based on the mechanisms used and the accuracy of description of different processes have not been made. This is partly due to lack of scientific knowledge and partly due to the different approaches used to study the C and N cycles in soil. We compared the mineralization and immobilization submodel of the Phoenix model (McGill et al., 1981 ) and the Tramin model (Juma and Paul, 1981 ) using a common experimental data set. A comparison of features of
l2
N.G.JUMA
the models and results of model performance are given by Juma and McGill ( 1986 ). The simulated net changes calculated by both models were similar to the experimental data but the inputs and outputs from various pools were markedly different. A summary of results is shown in Fig. 4. The microbial growth calculated with the Phoenix model is higher than that of Tramin because all organic N was directly incorporated into the bacterial and fungal biomass. In contrast, turnover of NH~- calculated using the Tramin model was greater than that of Phoenix because all N was mineralized outside the microbial cells and only a small portion of NH~- was taken up to meet the needs of microbial biomass. The rest of NH + was nitrified. Nitrate uptake was calculated in the Tramin model and was zero because the soil was in net mineralization conditions and enough NH~- was present to meet microbial needs. Microbial biomass decomposition and net mineralization were similar in both models. The models showed that net mineralization was almost onehalf of actual mineralization. Most simulation models are validated against different data sets; however, a rigorous examination of the mechanisms used to describe the dynamics of C and N through different pools has not been made. In addition, only a few models have simulated the flow of ~4C, ~2C, 14N and 15N. In spite of simulating three isotopes ( ~2C, 14N and 15N) with Phoenix and Tramin models, we found marked differences in the inputs and outputs from various pools. A synthesis of basic knowledge and documentation of inputs and outputs from various pools used in different models is urgently needed. Phoenix Model
5.0 I Or0an'o"
M'crobia'"
"","
16.0
TreminModel
OrganicN~(-t Micr°bialNt ~
NH4+ } ~
NO3
22.2 Fig. 4. Comparisons of N flux (g/m 2) through various pools of Weirdale loam soil calculated with Phoenix and Tramin models.
SOIL STRUCTURE/TEXTURE, SOIL BIOTA/SOIL ORGANIC MATTER AND CROP PRODUCTION
13
Description of the effect of texture on C and N cycling in simulation models Recently, the effect of clay content has been incorporated in soil organic matter models (Van Veen et al., 1984; Parton et al., 1988; Verberne et al., 1990). Clay content influences the amount of the "protected biomass" in soil (Verberne et al., 1990) and also the availability of substrates to soil organisms. Clay content also affects the porosity of soil and the nitches for microorganisms and soil fauna. The lack of information on the dynamics of soil porosity in the presence of larger fauna and plants has hindered modellers to incorporate porosity as a dynamic variable in the simulation models.
Future research Although mineralization and immobilization processes have been studied in a wide variety of soils, the effect of porosity on microbial and faunal activity has not been directly incorporated into the simulation models. Mathematical representation of porosity is needed to further understand the dynamics of processes in soil C and N cycle. HOW TO ASSESS INTERRELATIONSHIPS BETWEEN SOIL MICROBIAL-FAUNAL ACTIVITY, SOIL ORGANIC MATTER AND CROP PRODUCTIVITY THROUGH CARBON AND NITROGEN TRANSFORMATIONS UNDER FIELD CONDITIONS
The five kingdoms of organisms (Monera, Fungi, Protista, Animalia, Plantae) are represented in soil (Price, 1988). The numerous roles of soil organisms have been described (Mitchell and Nakas, 1986; Edwards et al., 1988; Paul and Clark, 1989). Root inputs and litter inputs from higher plants provide most of the energy and carbon inputs for the free-living heterotrophs of the decomposer food web. The activities of the soil bacteria and fungi, in their search for energy and carbon (C), are largely responsible for the mineralization-immobilization turnover of soil N (Jansson and Persson, 1982 ). Even though soil fauna are responsible for less than 10% of soil respiration (Petersen and Luxton, 1982) they may play an important role by regulating the size and activity of the microbial biomass (EUiott et al., 1984), in C and N mineralization (Coleman et al., 1983) and in the alteration of soil porosity (Pawluk, 1986). Fauna may have a relatively larger direct contribution to N mineralization than C mineralization because the C/N ratio of fauna is high compared to the C/N ratio of their food (i.e. microbes).
Approaches used to study the effect of soil type on soil biota and organic matter dynamics In order to understand the impact of soil structure/texture on soil biota and organic matter and plant productivity, field experiments were conducted on
14
N.G. JUMA
TABLE 2
Soil climate classification (Government of Alberta and University of Alberta, 1969), climatic normals for 1951-1980 period (Atmospheric Enironmental Service, 1982a-c) and soil characteristics at Ellerslie and Breton, Alberta (Crown and Greenlee, 1978)
Soil-climate
Ellerslie
Breton
Cryoboreal/subhumid
Cryoboreal/subhumid
Climate Annual precipitation (mm) Mean max. temperature July ( ° C) Mean min. temperature July ( ° C) Mean frost-free days Degree days > 5 ° C
Soil
pH
Organic C (g/kg) Organic N (g/kg) CEC (cmol ( + ) / k g ) Bulk density ( M g / m 3 )
452 22.4 9.6 109 1230
547 -21.2 8.8 80 1060
Horizon
Horizon Ap
Ae
Btl
Ap
Ae
Bt
6.4 52 5.0 400 0.9
6.2 9 1.0 160 I. 1
6.3 3 0.4 170 1.2
6.0 14 1.2 150 1.1
5.7 4 0.4 100 1.3
5.2 4 0.4 250 1.6
a Typic CryoboroU mapped as the Malmo silt loam series at the Ellerslie Research Station (53o25 , N, 113 °33'W) and on a Typic Cryoboralf mapped as the Breton loam series at the University of Alberta Breton Plots (53 o07'N, I 14 ° 28'W). Typic CryoboroUs are naturally endowed with a thick mollic epipedon which has granular structure, high nutrient and base status, and neutral pH. In contrast, Typic Cryoboralfs are acid, leached, degraded soils with an eluviated horizon. These soils are important for cereal production in Alberta and represent two extremes of natural fertility, crop productivity and biological, physical and chemical properties. Climatic characteristics and soil properties are given in Table 2. To determine the effects of soil type on the dynamics of soil organic matter, soil microbes and soil fauna, microplots (20 cm diameter, 30 cm depth) were set out at Ellerslie and Breton. Detailed information on microbial, faunal, and plant interactions, and on C and N cycling which has been reported by Rutherford and Juma ( 1989a, b) and Dinwoodie and Juma ( 1988a, b). The highlights of these papers are summarized below. Although microbial C (g m -E ) was greater at Ellerslie, microbial C made up a larger proportion of soil C (rag g - l soil C ) at Breton (Table 3 ). Protozoa (No. m - 2 ) were not significantly different between sites but were greater at Breton when expressed relative to soil C (No. g-~ soil C). The magnitude of
SOIL STRUCTURE/TEXTURE, SOIL BIOTA/SOILORGANIC MATTERAND CROP PRODUCTION
15
TABLE 3 Absolute and relative comparisons of selected variables in 0-10 cm depth at the two sites Variable
Absolute (per m 2 basis) SoilC ( g m -2) Microbial C (g m - 2 ) Protozoa (No. m -2) × 10 9 Nematodes (No. m -2) × 105 Acari (No. m -2) × 103 Collembola (No. m -2) × 102 CO2-C evolved (g m -2 10 days- l ) Relative (per g soil C or microbial C) Microbial C (mg g-~ soil C) Protozoa (No. g - l soil C) × 106 Nematodes (No. g-~ soil C) × 102 Acari (No. g - t soil C) Collembola (No. g-~ soil C) CO2- C evolved (mg g - ~ soil C 10 days - ~) CO2-C evolved (g g-~ microbial C 10 days-l )
Significance of site effect a
Site Ellerslie
Breton
5529 45.9 108 30.2 42.7 43 10.3
2376 26.4 211 6.9 19.7 9 10.7
8.2 19 5.5 7.7 0.80 1.9 0.23
11.1 88 2.9 8.3 0.36 4.5 0.41
*** * ns ** $ $ ns * * ns ns ns *** **
a S = p < 0 . 1 0 , * = p < 0.05, * * = p < 0 . 0 1 , * * * = p < 0.001, n s = not significant.
protozoa may be overestimated due to methodological problems. Acari, collembola and nematodes were greater at EUerslie when expressed on an area basis (No. m-2); however, did not significantly differ between sites when expressed relative to soil C (No. g-1 soil C). Soil C at Breton supported proportionally greater microbial C and protozoan populations and equal nematode and microarthropod populations compared to Ellerslie (Table 3 ). Tenday incubations of non-fumigated soil showed that CO2-C evolved was greater at Ellerslie ( 120/tg g-~ soil) than at Breton (97/tg g-~ soil); however, there was no significant difference in CO2-C evolution when expressed on an area basis (g m -2) between soils (Table 3). CO2-C evolution was greater from Breton soil samples when expressed as a proportion of soil C (mg g-1 soil C) or as a proportion of microbial C (mg g- ~ microbial C) (Table 3 ). Microbial N, non-microbial organic N (NMON) and mineral N made up a larger proportion of soil N at Breton compared to Ellerslie (Table 4). Net N mineralization was not different between soils when expressed as a proportion of microbial N; however, it was greater in soil from Ellerslie when expressed as a proportion of NMON. Net N mineralization was greater in soil from Breton when expressed as a proportion of total soil N. Net ~SN mineralization did not significantly differ between soils when expressed as a proportion of soil 15N (Table 4). A hypothesis was proposed by Rutherford and Juma (1989b) that the food
16
N.G. JUMA
TABLE 4 Absolute versus proportional N pool sizes and net N mineralized in 0-10 cm. Soil from Ellerslie and Breton Variable
Absolute (per m 2 or g soil basis) Soil N ( g m -2) Microbial N (g m -2) N M O N b ( g m -2) Total mineral N (g m - 2 ) Net N mineralized (/tg g - ~ soil 10 d a y s - ~) Net ~SN mineralized (/tg 100 g-~ soil 10 days - l ) Proportional (per unit N basis) Microbial N (% of soil N ) N M O N a (% of soil N ) Total mineral N (% o f soil N ) Net N mineralized (mg g - l microbial N 10 d a y s Net N mineralized ( m g g -~ N M A N 10 days -~ ) Net N mineralized (mg g - ~ soil N 10 d a y s - l ) Net 15N mineralized (% o f soil 15N 10 d a y s - t )
Site
Significance of site effect a
Ellerslie
Breton
456 5.5 46.1 0.98 10.4 4.2
206 4.1 66.2 0.83 7.2 3.0
*** ns ns ns * ns
1.2 10 0.21 17 2.4 0.20 4.8
2.0 32 0.40 20 1.5 0.39 3.2
** ** ** ns * ** ns
a * = p < 0.05, * * - - p < 0.01, * * * = p < 0.001, n s = n o t sxgnificant. bNon-microbial organic N.
web was more active at Breton cbmpared to Ellerslie in 1986. Differences in detrital trophic web structure affect C and N turnover in the soil and the size and activity of the active N pools. Expressed proportionally, high C activity and a large decomposer food web (Table 3 ) kept a larger proportion of soil N in the soil organisms at Breton compared to Ellerslie (Table 4 ). Rapid C turnover and greater microbial and faunal activity resulted in a greater proportional net N mineralization rate at Breton. Results from other experiments showed that the amount of N mineralized over 40 weeks under laboratory conditions from surface soil samples from Ellerslie was almost three times that of Breton; however, the proportion of total N mineralized from Breton was higher than that at Ellerslie (Fig. 5 ). These results support the hypothesis put forward by Rutherford and Juma (1989b). More research is needed to quantify the sizes and rate constants of biota and soil organic matter fractions undergoing mineralization in different soils. Interaction between crops and soils and above ground productivity The above ground productivity under conventional and alternative cropping systems at Ellerslie and Breton was studied by growing: (i) barley, (ii)
SOIL STRUCTURE/TEXTURE, SOIL BIOTA/SOILORGANIC MATTERAND CROP PRODUCTION
17
120 100 Z
=
=~
80
•-,1
z
0
60
2
2 @
= X
e 0
40
m
1
O
=.
~.
20
0
0 N mineralized
Proportion of Total N mineralized
Fig. 5. A m o u n t of N mineralized from surface soil samples from Ellerslie a n d Breton expressed on an absolute and relative basis.
barley intercropped with field pea, and (iii) faba bean continuously from 1986 to 1988 inclusively (Izaurralde et al., 1993 ). Under similar levels of management, the 3-year average C yield over all crops was higher at EUerslie ( 316 g m - 2 ) than at Breton (282 g m-2). The average barley C yield from fertilized plots at Breton was only 10% lower than that at Ellerslie (Fig. 6 ). In contrast, barley yield differences of up to 50% were observed between sites on unfertilized plots at Breton (M. Nyborg, pers. commun., 1992) emphasizing the importance of N inputs if comparable barley yields are to be attained. In the case of the intercrop, the yield differences between sites was 14% (Fig. 6 ). In contrast, the 3-year average C yield of faba bean (382 g m -2) was higher than at Ellerslie (328 g m-2). Without soil-water stress, the faba bean/Rhizobium symbiosis is capable of fixing high amounts of dinitrogen at Breton. Using e n r i c h e d - 15N isotope techniques, Gu ( 1988 ) reported up to 200 kg ha- ~of N fixed by faba bean at Breton. The amount of N uptake by barley represents N uptake from fertilizer N and from N mineralized from soil organic matter. Assuming half of N uptake in the barley crop is from fertilizer N, the amount of N which was mineralized and taken by crop ( 3.8 to 5.5 g m - 2 ) represents microbial and faunal activity. In addition to fertilizer and soil organic matter, biological N fixation in annual legumes increased above-ground yield by 1.5- to 2-fold compared with barley. Except for faba bean, annual fertilization with N and P as well as prevailing climatic conditions, masked to some extent the influence of inherent soil properties on crop yield and demonstrated the importance of hierarchical constraints (e.g., irradiance, temperature > water > nutrients) on crop productivity under cryoboreal conditions. The results of this 3-year study show that in spite of inherent differences in
18
N.G. JUMA 400
O4
300
E u (-
200
2 > 0 .0
1 O0
20.0
E
15.0
z "0 "- i
0
>
0 1-,
10.0
5.0
0.0 Barley
Badey+pea
Fababean
Crop
Fig. 6. Average above-ground C and N yields of three crops at Ellerslie and Breton.
soil properties (organic C and N, soil texture and structure, pH, etc. ), yields of barley, and barley-field pea intercrop fertilized with N and P at Breton were no more than 26% lower than those obtained at Ellerslie. At Breton, a special soil-climate-plant interaction resulted in a 16% higher faba bean yield than that obtained at Ellerslie. A rather favourable water regime at Breton, may have contributed to these results. Under field conditions, the primary productivity is affected by a number of variables. Fertilizer N is rapidly partitioned in the soil-plant system and some is lost by leaching and denitrification (Rutherford and Juma, 1989b, 1992e). The soil supplies N and water to the crops over the growing season. However, these constraints can be removed through management. The biological effects are generally masked by management practices in managed agroecosystems. Future research
In highly managed agroecosytems, the role of organisms to mineralize nutrients from soil organic matter is partially replaced by use of external inputs.
SOIL STRUCTURE/TEXTURE, SOIL BIOTA/SOIL ORGANIC MATTER AND CROP PRODUCTION
19
Activities of organisms and their effect on mineralization immobilization processes has to be studied in reduced-input or in improverished systems. This approach can yield knowledge on the biological potential of different soils. HOW TO ASSESS INTERRELATIONSHIPS BETWEEN PLANT PRODUCTIVITY AND SOIL STRUCTURE/TEXTURE THROUGH CARBON AND NITROGEN TRANSFORMATIONS UNDER CONTROLLED AND FIELD CONDITIONS
Roots are important for plant anchorage, water and nutrient uptake, storage of carbohydrates, synthesis of growth regulators and input of organic carbon into the soil. An understanding of these functions and processes involved are critical for improving plant performance and soil quality. Knowledge of root growth and distribution underpins our ability to understand root-shoot strategies for water and nutrient utilization, and organic matter dynamics. These strategies are important in determining the ability of a crop to successfully tolerate periods of excess or limited water, or nutrient stresses. The input of C into soil affects nutrient cycling and nutrient availability, microfloral and faunal activity, and soil structure formation. These in turn control the amount of plant available nutrients. Effect of different crops and cultivars on root~shoot ratios, root lengths and root mass
Information on below-ground productivity is important for constructing ecosystem budgets (Hansson and Andrrn, 1986) and studying plant-soil interactions. At Ellerslie and Breton, root mass of fababean at all depths was higher than barley (Izaurralde et al., 1993 ). Existing differences in chemical, physical properties between soils, however, appeared not to induce differences in root production during 1987. Root/shoot ratios for the species followed the same order on both sites: faba bean (0.32 and 0.25) and barley (0.12 and 0.12 ). On both soils, between 80 and 90% of barley- and faba-beanroot biomass was present in the 0-14 cm soil layer. Root biomass reflected crop characteristics rather than soil influences on root growth (Izaurralde et al., 1993). Results from an experiment in which four barley cultivars were grown in a Typic Cryoboroll at Ellerslie over a period of 2 years showed that there was a significant cultivar by growth stage interaction for root mass and root length (Fig. 7) (Xu and Juma, 1992). Root length dynamics did not follow trends in root mass dynamics through the whole growing season. Root length at ripening stage was significantly lower than root length at heading stage but there was no significant difference between root mass at heading and ripening stages. Perhaps this was mainly due to the decomposition of fine roots during the
20
N.G. JUMA
Growth Stage
4O
E 60-
Tillering
Stem Extension
i
i
Heading
Ripening
i
• o • []
¢a~k~ ~.~ a ~ . _
i
Abee Bonanza Harrington Samson
80 O
100
120
a
b b c
~
a
a a ab b
ab ab b
4 A
8
I'P
14
a ab b C
Fig. 7. Total root mass and root length of four barley cultivars at various growth stages over 1989 and 1990. The means of the cultivars bearing the different letters are significantly different in root mass or root length at the given growth stage ( p < 0 . 0 5 ) and refer to the magnitude of these variables from the lowest to the highest.
late period of the growing season. Thus, decomposition of fine roots affect root length more than root mass. The results of this study showed that: (1) shoot and root mass ofHarrington and Bonanza were not different from Abee and Samson but those of Abee were significantly greater than those of Samson indicating that the below ground input of organic matter could be a function of specific cultivar; (2) root mass increased rapidly until the heading stage, while the shoot mass increased at a higher rate than roots between the heading and ripening stages producing a widening of shoot/root ratios with time; and (3) decomposition of very small roots may have contributed to a more rapid decrease in root length than in root mass after heading stage (Xu and Juma, 1992). In order to assess the complete impact of root inputs into the soil ecosystem, more information is needed for other types of root-released organic materials such as root exudates, sloughed-off root cells and mucilage.
SOIL STRUCTURE/TEXTURE, SOIL BIOTA/SOIL ORGANIC MATTER AND CROP PRODUCTION
21
Effect of different barley cultivars on distribution of photosynthetically fixed 14C
The input of C through roots affects mineralization and immobilization processes and controls the activity of soil biota. Although the standing root mass at harvest may be only 10% of shoot mass, a quantity equal to about 3to 4-fold of standing root mass C at harvest is released into the soil over the growing season in form of root material, exudates and other soluble products (Sauerbeck and Johnen, 1977 ). Thus up to 33% of total C fixed by photosynthesis is used to build and maintain the root system. Van Veen et al. ( 1991 ) summarized previous work and reported that 60 to 90% of the total carbon assimilated by arable crops was stabilized in different pools of the crop-soil system and 10 to 40% of that was released from the roots into the soil. Estimations of annual input of carbon into soil by a growing crop ranged from 900 to 3000 kg h a - '. Large variations exist with plant species, cultivars and development stages and environmental conditions (Van Veen et al., 1991 ). The transformation of labelled carbon in two barley cultivars/soil systems in field conditions over the growing season using pulse '4C labelling technique was measured by Xu and Juma (1992). We hypothesized that cultivars which produce more soluble C rather than standing root mass would stabilize more C in microbial biomass and soil organic matter. For Abee, root '4C decreased significantly with time over the growing season, but for Samson it increased from tillering to stem extension stage, and then decreased till the ripening stage (Fig. 8). At the stem extension and heading stages, root '4C of Samson was significantly higher than that of Abee. The ratios of shoot '4C/root ~4C increased significantly with time over growing season for both cultivars, but the rate of increase was significantly higher for Abee than for Samson. At the tillering stage, the ratios of shoot 14C/root ~4C for the two cultivars were similar to each other, but from the stem extension stage, it increased faster for a
o
6OO
Abee
. I 0 0
Q
•
•.= o_ 500
Sams~/
~= 60 I
400
g ~ 300 n-
/
~ 4o! e-
200
.¢ 100
c
20
o
b ~ ? Tillering Stem HeadingRipening
0
Extension
a
b
Tillering Stem HeadingRipening Extension
Fig. 8. Root '4C and the ratios of shoot '4C/root '4C for two barley cultivars over growing season. The means of the cultivars bearing the different letters are significantly different at the given growth stage (p< 0.05).
22
N.G. JUMA
Abee than for Samson. At the ripening stage, the ratio of shoot 14C/root 14C of Abee was almost twice as much as that of Samson. Our results of 14C activity in soil were obtained 15 days after labelling and could reflect the C transformation characteristics of the barley-soil systems under steady-state conditions. The total C in root of Abee was greater than that of Samson, but 14C activity in shoot and root of Abee was lower than that of Samson. The ratios of total C in shoot over total C in root at ripening stage of Abee was about 1.1-fold higher than that of Samson, but the ratio of shoot 14C/root 14C at the same time was 2-fold higher for Samson than for Abee. This indicated that the photosynthetically fixed C was transferred and cycled faster in Samson than in Abee. The C translocation rate below-ground for Samson was also higher than for Abee. Overall, soil ~4C under Abee was significantly lower than that under Samson at the stem extension and heading stages but there were no significant differences at the tillering stage and ripening stages. These results suggest that the partitioning of C by different cultivars have to be considered in assessing the impact of translocated C on the amount of organic matter in soil. The decomposition of fine roots and exudates occurs at a microscale, therefore soil pore sturcture has to considered in understanding the dynamics of various processes in the rhizosphere.
Comparison of destructive and in situ methods for quantifyng root length and root mass of different crops The evolution of the minirhizotron from a qualitative to a quantitative tool enable one to compare the dynamics of root growth using destructive (core or monolith) and nondestructive methods (Upchurch, 1991 ). The studies by B6hm et al. (1977) and K6pke (1982) were the first attempts in comparing root study methods for soybean and oat root systems under field conditions. However, comparisons with the recently improved minirhizotron technique (Upchurch, 1987) are required for other crops and soils. We compared the minirhizotron, core and monolith methods in measuring root length distribution for barley [Hordeum vulgare (L.) cv. Bonanza] and faba bean syn. broadbean, fieldbean [ Vicia faba (L.) cv. Herz Freya] under greenhouse conditions. Linear regression analyses were used to describe the relationships for root mass density (RMD) and root length density (RLD) between different methods (Table 5 ). Each depth represented paired values since CVs in individual observations were large (Heeraman and Juma, 1993 ). Mean RLD by the minirhizotron was excluded in the top 10 cm layer in the regression analyses because estimates of RLD were lower than the monolith method. In general a positive linear relationship existed between the methods. Correlation coefficients were significant (p < 0.01 ) between monolith and core methods in barley and fababean for both RMD and RLD.
SOIL STRUCTURE/TEXTURE, SOIL BIOTA/SOILORGANIC MATTERAND CROP PRODUCTION
23
TABLE 5
Relationships between the minirhizotron ( M R ) , core (C) and monolith ( M ) methods in estimating root mass (mg c m - 3 ) and root length (cm c m - 3 ) density for barley and faba bean Crop
Depth
Regression equation"
rb
M = - 0 . 0 1 ( + 0 . 0 2 ) +0.73( + 0.29)C M = - 0 . 0 2 ( -+ 0.01 ) + 1.49( -+0.10)C
0.75* 0.99**
C = C = M= M= M= C= C= M= M= M=
0.39ns 0.77* 0.53ns 0.5 Ins 0.73* 0.01ns 0.52ns 0.06ns 0.46ns 0.99**
(cm) Root mass density Barley Fababean Root length density Barley
Fababean
0-70 0-70 0-70 10-70 0-70 10-70 0-70 0-70 10-70 0-70 10-70 0-70
- 2 . 3 1 ( + 0 . 9 0 ) - 0 . 7 3 ( + 0.76)MR - 0 . 8 1 (_+0.88) + 1.70( + 0 . 7 0 ) M R 1.85(_+0.80)-0.95(+0.68)MR - 0 . 6 4 ( _+ 1.07) +0.99( + 0.85)MR -0.15(_+0.42) +0.68( _+0.29)C 0.53(+0.50)-0.01(+0.42)MR 0.14(+0.19)+0.19(_+0.16)MR 0.66(+0.66)-0.08(_+0.56)MR 0 . 1 4 ( + 0 . 2 3 ) +0.19( + 0 . 1 9 ) M R - 0 . 0 9 ( + 0 . 0 5 ) + 1.31 ( + 0.08)C
aFigures in parentheses are standard errors. bCorrelation coefficients are significant at: * = p < 0.05; ** = p < 0.01; ns = not significant.
Comparison of monolith and core methods The correlation coefficients obtained between the monolith and core methods for root mass and root length densities were significant. The CV of root length and root mass of faba bean using the monolith method was lower than the core method. The CV of root mass of barley using the monolith method was lower than the core method; however, an opposite trend was found for root lengths. This suggests that the consistency of measurement using destructive sampling methods depends on the type of crop. In barley, root length estimates by the monolith method were lower in the upper 40 cm soil depth compared to the core method but were higher at all depths in faba bean. Hence, the monolith method was more consistent for faba bean than for barley. This is not surprising since the CV of root length for the whole profile obtained with the monolith method was higher in barley (42%) than in faba bean (24%). In comparison to faba bean, barley roots do not exhibit a random variation in diameter but fall in discrete bands related to the order of the root. Hackett (1968) estimated that the fine branch roots or primary laterals (diameter 0.2-0.5 m m ) can constitute up to 80% of total root length in the root system of barley. Loss of these fine roots from washing a larger sample in the upper 40 cm soil layer may explain lower RLD estimates compared to minirhizotron and core methods. Also, incomplete separation of live roots from organic material, loss in detection of fine roots from overcrowding and
24
N.G. JUMA
the resolution limit of the video-image analyzer can introduce errors during automated root length measurements (Cunningham et al., 1989). These errors were much smaller in faba bean than in barley because of a coarser and less dense root system. Vogt et al. ( 1989 ) also concluded the monolith to be unsuitable for fine root data collection compared to the core method. Root distribution can be quantified using destructive and non-destructive sampling methods. The results from this study has shown that the core and monolith methods can be used for different crops. However, the minirhizotron technique still needs to be calibrated against different methods especially in the top 10 cm layer. Destructive sampling still remains the method to quantify root growth in this layer which is a zone of intense microbial and faunal activity.
Use of micromorphological methods to study effects of biota and crops on soil microstructure Micromorphological investigations of cultivated soils at Ellerslie and Breton revealed marked differences in soil microstructure and fabric. The Typic Cryoboroll from Ellerslie had an inherent ultra fine and very fine granular microstructure that was very resilient to change through management practices. The different structural arrangements of these primary granular units reflected variable degrees of coalescence and disruption by both natural and human activity. The basic units of structure were approximately 50-70 am in diameter. Some of the units are made up entirely of humic material, some comprise strongly complexed humic substances and clay and some contain admixtures of fine silt. Their genetic origin is likely very complex since some units are well defined fecal pellets of microarthropods, some appear to reflect biochemical alteration of plant protoplasm and some reflect characteristics associated with physical processes of wetting and drying and freezing and thawing. Some of the smaller units have been incorporated into larger units through ingestion by larger arthropods. These fecal pellets may be discrete or strongly welded to form larger units ranging up to 1 mm or more in sizeand imparting to the soil a very fine and fine granular character. The smaller primary units of structure are also partially fused through compaction by tillage and root growth as well as by swelling through wetting and frequently intergrade to a spongy microstructure. Disruption through tillage in the upper soil layers breaks up these soil masses to form fragments and clods of highly variable size and shape. Drying below the cultivated layer results in shrinkage and the formation of intersecting vertical and horizontal fracture planes to impart a ultra and very fine blocky microstructure to the soil mass. In zones where the soil mass is relatively denser and moisture movement is somewhat impeded well developed horizontal and parallel planar voids develop through cycles of freezing and thawing and impart a platy microstructure to the soil
SOIL STRUCTURE/TEXTURE, SOIL BIOTA/SOIL ORGANIC MATTER AND CROP PRODUCTION
25
mass. Throughout this physical activity the integrity of the primary units is generally retained. The Typic Cryoboralf at Breton did not have similar primary units developed within their microstructure. Soil materials are highly porous in most cases with strongly interconnected vughs and metavughs that form a spongy microstructure. Few discrete micropeds are evident but frequently, near the surface, weak and moderately developed irregular shaped peds were discernible. Similar features were previously observed to occur through freeze thaw processes and appear to reflect an extreme point in the development of interconnected vughs. Spongy microfabrics also result from earthworm action. The stongly welded fecal material is generally much denser than the adjacent matrix material and the resulting granular units are coarse to very coarse granular in size. In zones where vughs are not interconnected the soil materials characteristically have a vughy microstructure that intergrades to blocky, subangular blocky, or platy. Cultural practices showed variable affects on microstructure. The roots of fababeans showed the greatest amount of compaction as reflected in the development of vughy and spongy microfabrics within a l to 2 cm zone. The greatest amount of earthworm activity was observed in the barley plots of both soils where the strongly welded casts imparted a coarse granular and spongy microstructure to the ingested materials. The best ultra fine and fine granular microstructures were observed in the pea plots where considerable microarthropod activity was evident (S. Pawluk, pers. commun., 1992) Future research To date, knowledge on shoot/root ratios, C inputs from different crops and cultivars is empirical. The partitioning of C in crops, the thickness of roots and amount of exudates are controlled by many factors (Van Veen et al., 1991 ). The thin-section techniques using florescence dyes may be one way to increase our understanding of soil biota, soil organic and inorganic components at a micrometre scale (Postma and Altemuller, 1990). Future research is needed to understand the synlocalization and synchronization of plant, microbial, and faunal activity in soils. An insight into effects of porosity on microbial, faunal and plant activity is needed. CONCLUSIONS
Interrelationships between soil texture/structure, soil biota/organic matter and crop production occur at different scales of resolution. At finer scales of resolution, experiments can be conducted to understand specific processes, however the detailed information has to be translated to the next level of resolution. Our work showed that these approaches can be used to link microbial
26
N.G. JUMA
and faunal activities to cycling of C and N in soils with different textures. At coarser scales of resolution, for example under field conditions, many other processes become important. Therefore, simple relationships between the numerous parameters have to identified and modelled. Porosity is controlled by a number of physical (wetting and drying, freezing and thawing), chemical (type and amount of clay and sesquioxides), biological (microbial, faunal and plant activity) processes and management practices (tillage, crop grown ). Mathematical representation of porosity is needed to further understand the dynamics of processes in soil C and N cycle. ACKNOWLEDGEMENTS
I would like to thank the Natural Sciences and Engineering Research Council of Canada for financial support; G. Dinwoodie, Dr. P.M. Rutherford, K. Haugen-Kozyra, Dr. R.C. Izaurralde, Dr. C.C. Mishra, Dr.K. Raverkar, Dr. M. Choudary, J. Xu and D. Heeraman for their dedication and creativity; and Dr. K. Zwart (Institute of Soil Fertility Research, Haren, The Netherlands) for sharing protozoa enumeration methodology; D. Donass, C. Nguyen, J. Konwicki, C. Figueiredo, P. Geib, Y. Wang, L. Toerper, J. Khatkar, C. Slupsky, K. Haugen, J. Brown and J. Thurston for technical assistance; Dr. S. Pawluk, Dr. W.B. McGill, Dr. M.J. Dudas, Dr. D. Chanasyk, Dr. P.H. Crown, Dr. M. Nyborg, Dr. R. Grant, and Dr. J.A. Robertson for their support.
REFERENCES Anderson, J.P.E. and Domsch, K.H,, 1980. Quantities of plant nutrients in the microbial biomass of selected soils. Soil Sci., 130:211-216. Anderson, R.V., Elliott, E.T., Coleman, D.C. and Cole, C.V., 1981. Effect of the nematodes Acrobeloides sp. and Mesodiplogaster lheritieri on substrate utilization and nitrogen and phosphorus mineralization in soil. Ecology, 62: 549- 555. Atmospheric Enivironmental Service, 1982a. Canadian Climate Normals, 1951-1980. Vol. 2. Temperature. Atmospheric Environment Service, Downsview. Atmospheric Enivironmental Service, 1982b. Canadian Climate Normals, 1951-1980. Vol. 3. Precipitation. Atmospheric Environment Service, Downsview. Atmospheric Enivironmental Service, 1982c. Canadian Climate Normals, 1951-1980. Vol. 4. Degree Days. Atmospheric Environment Service, Downsview. Bakken, L.R. and Olsen, R.A., 1987. The relationship between cell size and viability of soil bacteria. Microb. Ecol., 13:103-114. Bamforth, S.S., 1985. The role of protozoa in litters and soils. J. Protozool., 32: 404-409. Bamforth, S.S., 1988. Interactions between protozoa and other organisms. Agric. Ecosyst. Environ., 24: 229-234. Belford, R.K. and Henderson, F.K.G., 1984. Measurement of growth of wheat root using a TV camera system in the field. In: W. Day and R.K. Atkin (Editors), Wheat Growth and Modeling. Plenum Press, New York, pp. 99-105.
SOILSTRUCTURE/TEXTURE,SOILBIOTA/SOILORGANICMATTERANDCROPPRODUCTION
27
BShm, W., Maduakor, H. and Taylor, H.M., 1977. Comparison of five methods for characterizing soybean rooting intensity and development. Agron. J., 69:415-419. Clarholm, M., 1984. Heterotrophic free-living protozoa: neglected microorganisms with an important task in regulating bacterial populations. In: M.J. Klug and C.A. Reddy (Editors), Current Perspectives in Microbial Ecology. Am. Soc. for Microbiology, Washington, pp. 321326. Clarholm, M., 1985. Interactions of bacteria, protozoa and plants leading to the mineralization of soil nitrogen. Soil Biol. Biochem., 17:181-187. Coleman, D.C., Reid, C.P. and Cole, C.V., 1983. Biological strategies of nutrient cycling in soil systems. Adv. Ecol. Res., 13: 1-55. Coleman, D.C., Anderson, R.V., Cole, C.V., McClellan, J.F., Woods, L.E., Trofymow, J.A. and Elliott, E.T., 1984. Roles of protozoa and nematodes in nutrient cycling. In: R.L. Todd and J.E. Giddens (Editors), Microbial-Plant Interactions. Am. Soc. of Agronomy, Madison, WI, pp. 17-28. Crown, P.H. and Greenlee, G.M., 1978. Guidebook for Soils and Land Use in the Edmonton Region, Alberta. 1 lth Congr. Int. Soc. Soil Sci., Edmonton, Canada. Cunningham, M., Adams, M.B., Luxmoore, R.J., Post, W.M. and DeAngelis, D.L., 1989. Quick estimates of root length, using a video image analyzer. Can. J. For. Res., 19: 335-340. Darbyshire, J.F., Robertson, L., Mackie, L.A., 1985. A comparison of two methods of estimating the soil pore network available to protozoa. Soil Biol. Biochem., 17:619-624. Darbyshire, J.F., Griffiths, B.S., Davidson M.S. and McHardy, W.J., 1989. Ciliate distribution amongst soil aggregates. Rev. Ecol. Biol. Sol, 26: 47-56. Dinwoodie, G.D. and Juma, N.G., 1988a. Allocation and microbial utilization of C in two soils cropped to barley. Can. J. Soil Sci., 68: 495-505. Dinwoodie, G.D. and Juma, N.G., 1988b. Factors affecting the distribution and dynamics of ~4C in two soils cropped to barley. Plant Soil, 110:111-121. Edwards, C.A., Stinner B.R., Stinner, D. and Rabatin, S., 1988. Biological Interactions in Soil. Elsevier, Amsterdam. Elliott, E.T., Anderson, R.V., Coleman, D.C. and Cole, C.V. 1980. Habitable pore space and microbial trophic interaction. Oikos, 35: 327-335. Elliott, E.T., Coleman, D.C., Ingham, R.E. and Trofymow, J.A., 1984. Carbon and energy flow through the soil subsystem of terrestrial ecosystems. In: M.J. Klug and C.A. Reddy (Editors), Current Perspectives in Microbial Ecology. Am. Soc. Microbiol., Washington, pp. 424433. Foster, R.C., 1988. Microenvironments of soil microorganisms. Biol. Fert. Soils, 6:189-203. Frissel, M.J. and Van Veen, J.A., 1981. Simulation of Nitrogen Behavior in Soil-Plant Systems. Pudoc, Wageningen. Government of Alberta and University of Alberta, 1969. Atlas of Alberta. University of Alberta Press, Edmonton, Alta. Griffiths, B.S., 1986. Mineralization of nitrogen and phosphorus by mixed cultures of the ciliate protozoan Colpoda steinii, the nematode Rhabditis sp and the bacterium Pseudomonasfluorescens. Soil Biol. Biochem., 18:637-641. Gu, J., 1988. Carbon and nitrogen assimilation, dinitrogen fixation in faba bean (Vicia faba L.) and microbial biomass in soil-plant systems (faba bean, canola, barley and summer fallow) on a Gray Luvisol. M.Sc. thesis. Department of Sol Science, University of Alberta, Edmonton, Alta., unpubl. Gupta, V.V.S.R. and Germida, J.J., 1989. Influence ofbacterial-amoebal interactions on sulfur transformations in soil. Soil Biol. Biochem., 21: 921-930. Hackett, C., 1968. A study of the root system of barley. I. Effects of nutrition on two varieties. New Phytol., 67: 287-299.
28
N.G. JUMA
Hansson, A.C. and Andr6n O., 1986. Below-ground plant production in a perennial grass ley (Festuca pratensis Huds. ) assessed with different methods. J. Appl. Ecol., 23: 657-666. Hattori, T. and Hattori, R., 1976. The physical environment in soil microbiology: an attempt to extend principles of microbiology to soil microorganisms. Crit. Rev. Microbiol., 4: 423461. Heeraman, D.A. and Juma, N.G., 1993. A comparison of minirhizotron, core and monolith methods for quantifying barley (Hordeum vulgare L.) and fababean ( Viciafaba L.) root distribution. Plant Soil, 148:29-41. Hunt, H.W. and Parton, W.J., 1986. The role of modeling in research on microfloral and faunal interactions in natural and agroecosystems. In: M.J. Mitchell and J.P. Nakas (Editors), Microfloral and Faunal Interactions in Natural and Agro-ecosystems. Martinus Nijhoff/Dr. W. Junk Publishers, pp. 443-494. Hunt, H.W., Coleman, D.C., Cole, C.V., Ingham, R.E., Elliott, E.T. and Woods, L.E., 1984. Simulation model of a food web with bacteria, amoebae and nematodes in soil. In: M.J. Klug and C.A. Reddy (Editors), Current Perspectives in Microbial Ecology. Am. Soc. for Microbiology, Washington, pp. 346-352. Hunt, H.W., Coleman, D.C., Ingham, E.R., Ingham, R.E., Elliott, E.T., Moore, J.C., Rose, S.L., Reid, C.P.P. and Morley, C.R., 1987. The detrital food web in a shortgrass prairie. Biol. Fert. Soils, 3: 57-68. Hunt, H.W., Elliott, E.T. and Walter, D.E., 1989. Inferring trophic transfers from pulse-dynamics in detrital food webs. In: M. Clarholm and L. Bergstr6m (editors), Ecology of Arable Land: Perspectives and Challenges. Kluwer, Dordrecht, pp. 191-203. Izaurralde, R.C, Juma, N.G., McGill, W.B., Chanasyk, D.S., Pawluk, S. and Dudas, M.J., 1993. Performance of conventional and alternative cropping systems in cryoboreal subhumid central Alberta. J. Agric. Sci., 120: 33-41. Jansson, S.L., 1958. Tracer studies on nitrogen transformations in soil. Ann. R. Agric. Coll. Sweden, 24: 101-361. Jansson, S.L. and Persson, J., 1982. Mineralization immobilization of soil nitrogen. In: F.J. Stevenson (Editor), Nitrogen in Agricultural Soils. Agronomy, 22: 229-252. Jenkinson, D.S., 1966. Studies of the decomposition of plant material in soil. II. Partial sterilization of soil and the soil biomass. J. Soil Sci., 17: 280-302. Jenkinson, D.S. and Powlson, D.S., 1976. The effects of biocidal treatments on metabolism in soil. V. A method for measuring soil biomass. Soil Biol. Biochem., 8:209-213. Juma, N.G. and McGiU, W.B., 1986. Decomposition and nutrient cycling in agro-ecosystems. In: M.J. Mitchell and J.P. Nakas (Editors), Microfloral and Faunal Interactions in Natural and Agro-ecosystems. Martinus Nijhoff/Dr. W. Junk Publishers, Dordrecht, pp. 74-136. Juma, N.G. and Paul, E.A., 1981. Use of tracers and computer simulation techniques to assess mineralization and immobilization of soil nitrogen. In: M.J. Frissel and J.A. Van Veen (Editors). Simulation of Nitrogen Behavior in Soil-Plant Systems. Pudoc, Wageningen, pp. 145154. Kilbertus, G., 1980. Etude des microhabitats contenus dans les agr6gats du sol. Leur relation avec la biomasse bact6rienne et la taille des procaryotes pr6sents. Rev. Ecol. Biol. Sol 17: 543-557. K6pke, U., 1982. A comparison of methods for measuring root growth of field crops. Z. Acker Pflanzenbau, 150: 39-49. Kuikman, P.J. and Van Veen, J.A., 1989. The impact of protozoa orr the availability of bacterial nitrogen to plants. Biol. Fert. Soils, 8:13-18. McGill, W.B., Hunt, H.W., Woodmansee, R.G. and Reuss, J.O., 1981. Phoenix - A model of the dynamics of carbon and nitrogen in grassland soils. In: F.E. Clark and T. Rosswall (Editors), Terrestrial Nitrogen Cycles. Ecol. Bull. (Stockholm), 33:49-115. Merckx, R., Den Hartog, A. and Van Veen, J.A., 1985. Turnover of root-derived material and
SOIL STRUCTURE/TEXTURE, SOIL BIOTA/SOIL ORGANIC MATTER AND CROP PRODUCTION
29
related microbial biomass formation in soils of different texture. Soil Biol. Biochem., 17: 565-569. Mitchell, M.J. and Nakas, J.P., 1986. Microfloral and Faunal Interactions in Natural and Agroecosystems. Martinus Nijhoff/Dr. W. Junk Publishers, Dordrecht. Moore, J.C., Zwetsloot, H.J.C. and De Ruiter, P.C., 1990. Statistical analysis and simulation modelling of the below-ground food webs of two winter wheat management practices. Neth. J. Agric. Sci., 38: 303-316. Papendick, R.I. and Campbell, G.S. 1981. Theory and measurement of water potential, ln: J.F. Parr, W.R. Gardener and L.F. Elliott (Editors), Water Potential Relations in Soil Microbiology. ASA Spec. Publ. No. 9, Am. Soc. Agron., Madison, WI, pp. 1-22. Parton, W.J., Stewart, J.W.B. and Cole, C.V., 1988. Dynamics of C, N, P and S in grassland soils: a model. Biogeochemistry, 5:109-131. Paul, E.A. and Clark, F.E., 1989. Soil Microbiology and Biochemistry. Academic Press, San Diego. Paul, E.A. and Juma, N.G., 1981. Mineralization and immobilization of soil nitrogen by soil microorganisms. In: F.E. Clarkand and T. Rosswall (Editors), Terrestrial Nitrogen Cycles. Ecol. Bull. (Stockholm), 33: 179-195. Paul, E.A. and Voroney, R.P., 1980. Nutrient and energy flows through soil microbial biomass. In: D.C. Ellwood, J.N. Hedger, M.S. Latham, J.M. Lynch and J.H. Slater (Editors), Contemporary Microbial Ecology. Academic Press, London, pp. 215-237. Pawluk, S., 1986. Vegetation and management effects upon some soil properties of Black Chernozemic soils of the Edmonton region. Can. J. Soil Sci., 66: 73-89. Petersen, H. and Luxton, M., 1982. A comparative analysis of soil fauna populations and their role in decomposition processes. Oikos, 39: 287-388. Postma, J. and Altemuller, H.J., 1990. Bacteria in thin soil sections stained with the fluorescent brightener calcofluor white M2R. Soil Biol. Biochem., 22: 89-96. Price, P.W., 1988. An overview of organismal interactions in ecosystems in evolutionary and ecological time. Agric. Ecosyst. Environ., 24: 369-377. Richards, B.N., 1974. Introduction to the Soil Ecosystem. Longman, London. Robinson, D., Griffiths, B., Ritz, K. and Wheatley, R., 1989. Root-induced nitrogen mineralization: a theoretical analysis. Plant Soil, I 17:185-193. Rutherford, P.M., 1991. Dynamics of microbial biomass, soil fauna and nitrogen in contrasting soils. Ph.D. Thesis. Dept. of Soil Science, Univ. of Alberta, Edmonton, Alta. Rutherford, P.M. and Juma, N.G., 1989a. Dynamics of microbial biomass and soil fauna in two contrasting soils cropped to barley (Hordeum vulgateL. ). Biol. Fert. Soils, 8: 144-153. Rutherford, P.M. and Juma, N.G., 1989b. Shoot, root, soil and microbial nitrogen dynamics in two contrasting soils cropped to barley (Hordeum vulgateL. ). Biol. Fert. Soils, 8:134-143. Rutherford, P.M. and Juma, N.G., 1992a. Influence of texture on habitable pore space and bacterial-protozoan populations in soil. Biol. Fert. Soils, 12:221-227. Rutherford, P.M. and Juma, N.G., 1992b. Influence of soil texture on protozoa-induced mineralization of bacterial carbon and nitrogen. Can. J. Soil Sci., 72: 183-200. Rutherford, P.M. and Juma, N.G., 1992c. Simulation of protozoa-induced mineralization of bacterial carbon and nitrogen. Can. J. Soil Sci., 72: 201-216. Rutherford, P.M. and Juma, N.G., 1992d. Performance of the model describing protozoa-induced mineralization of bacterial C and N in a sandy loam. Can. J. Soil Sci., 72:217-228. Rutherford, P.M. and Juma, N.G., 1992e. Effect of glucose amendment on microbial biomass, fertilizer ~N-recovery and distribution in a barley-soil-system. Biol. Fert. Soils, 12: 228232. Sanders, J.L. and Brown, D.A., 1979. Measurement of rooting patterns for determinate and indeterminate soybean genotypes with a fiber-optic scope. In: J.L. Harley and R.S. Russell (Editors), The soil-root interface. Academic Press, New York, pp. 369-379.
30
N.G. JUMA
Sauerbeck, D.R. and Johnen, B.G., 1977. Root formation and decomposition during plant growth. Soil Org. Matter Studies IAEA (Vienna), 1: 141-148. Upchurch, D.R., 1987. Conversion of minirhizotron-root intersections to root length density. In: H.M. Taylor (Editor), Minirhizotron Observation Tubes: Methods and Applications for Measuring Rhizosphere Dynamics. ASA Spec. Publ. No. 50, Am. Soc. Agron., Madison, WI, pp. 51-66. Van Noordwijk, M. and De Jager, A., 1985. Sampling schemes for estimating root density distribution in cropped fields. Neth. J. Agric. Sci., 33: 241-262. Van Veen, J.A., Ladd, J.N. and Frissel, M.J. 1984. Modelling C and N turnover through the microbial biomass in soil. Plant Soil, 76: 257-274. Van Veen, J.A., Ladd, J.N. and Amato, M., 1985. Turnover of carbon and nitrogen through the microbial biomass in a sandy loam and a clay soil incubated with [ 14C(U)]glucose and [ ~5N ] (NH4) 2SO4 under different moisture regimes. Soil Biol. Biochem., 17:747-756. Van Veen, J.A., Liljeroth E. and Lekkerkerk J.A., 1991. Carbon fluxes in plant-soil system at elevated atmospheric CO2 levels. Ecol. Appl., 12:175-181. Vargas, R. and Hattori, T., 1986. Protozoan predation of bacterial cells in soil aggregates. FEMS Microbiol. Ecol., 38: 233-242. Verberne, E.L.J., Hassink, J., De Willigen, P., Groot, J.J.R. and Van Veen, J.A., 1990. Modelling organic matter dynamics in different soils. Neth. J. Agfic. Sci., 38:221-238. Vogt, K.A., Vogt, D.J., Moore, E.E. and Sprugel, D.G., 1989. Methodological considerations in measuring biomass production, respiration and nutrient resorption for tree roots in natural ecosystems. In: J.G. Torrey and L.J. Winship (Editor), Applications of Continuous and Steady-State Methods to Root Biology. Kluwer, Dordrecht, pp. 217-232. Voroney R.P., Van Veen, J.A. and Paul E.A., 1981. Organic carbon dynamics in grassland soils. 2. Model validation and simulation of the long-term effects of cultivation and rainfall erosion. Can. J. Soil Sci., 61: 211-224. Vos, J. and Groenwold, J., 1987. The relation between root growth along observation tubes and in bulk soil. In: H.M. Taylor (Editor), Minirhizotron Observation Tubes: Methods and Applications for Measuring Rhizosphere Dynamics. ASA Spec. Publ. No. 50, Am. Soc. Agron., Madison, WI, pp. 39-51. Xu, J.G. and Juma, N.G., 1992. Above- and below-ground net primary production of four barley (Hordeum vulgareL. ) cultivars in western Canada. Can. J. Plant Sci., 1131-1140. Xu, J.G. and Juma, N.G., 1993. Above- and below-ground transformation of photosynthetically fixed t4Carbon by two barley (Hordeum vulgareL.) cultivars in a Typic Cryoboroll. Soil Biol. Biochem., in press.