Introducing Item Response Theory for Measuring Usability Inspection Processes Martin Schmettow University of Passau Chair Information Systems II 94032 Passau, Germany
[email protected] ABSTRACT
Usability evaluation methods have a long history of research. Latest contributions significantly raised the validity of method evaluation studies. But there is still a measurement model lacking that incorporates the relevant factors for inspection performance and accounts for the probabilistic nature of the process. This paper transfers a modern probabilistic approach from psychometric research, known as the Item Response Theory, to the domain of measuring usability evaluation processes. The basic concepts, assumptions and several advanced procedures are introduced and related to the domain of usability inspection. The practical use of the approach is exemplified in three scenarios from research and practice. These are also made available as simulation programs. Author Keywords
Usability Inspection, Measurement, Experiment, Latent Trait Model, Item Response Theory, Quality Process ACM Classification Keywords
H.5.2 User Interfaces (e.g. HCI): Evaluation/methodology MEASURING THE INSPECTION PROCESS: CURRENT PRACTICE
Usability inspections play a major role for early quality assurance in the development of interactive software. The focus is usually on identifying usability defects (as opposed to measuring certain qualities). Whereas usability testing is usually held to be the most effective method to identify defects, inspection methods are often preferred because of their assumed cost efficiency. However, low costs is one side of the coin. It is as well an obligation to prove that a particular inspection method yields sufficient detection performance to satisfy the goals of quality assurance processes. The measurement of detection performance is a sine qua non to plan, predict and monitor inspection processes. Last but not least, Reprint of a paper originally published at the CHI2008, Florence. Cite as: M. Schmettow and W. Vietze. Introducing item response theory for measuring usability inspection processes. In {\em CHI 2008 Proceedings}, pages 893–902. ACM SIGCHI, April 2008. Copyright 2008 ACM 978-1-60558-011-1/08/04. . .$5.00.
Wolfgang Vietze University of Passau Chair Statistics 94032 Passau, Germany
[email protected] measuring inspections may yield deeper insights into underlying processes and differences of inspection methods. Most topics raised throughout the paper can be interpreted for usability testing studies as well. In particular, the models in Predicting Process Outcome have equally been applied to data from user testing and expert inspections [21]. Here, the reason for focussing on inspections is that the approach we introduce is of specific value for comparing method performance. This is a critical question with inspection methods but not so much with the practice of user testing. Predicting Process Outcome
A primary aim of measuring inspection performance is to plan and control inspection processes. This is the case when a certain outcome of the process has to be guaranteed. In situations where usability is mission-critical (for example: web shops), stakeholders rely upon the inspection process to yield at least, for example, 95%, of the usability defects. The prediction of process outcome may be conducted prior to the process or adaptively as online monitoring during the process. The a priori prediction relies upon previously assessed performance measures in order to determine the number of estimators to achieve a certain goal. In contrast, online monitoring aims at estimating the proportion of defects currently found, which usually requires to estimate performance measures from the previous course of the process. The a priori measures are usually obtained under experimental conditions or with defined testing procedures. The earliest model of planning the inspection process for a guaranteed outcome was proposed by Virzi [39]. This model assumes a single parameter λ , which denotes the probability of one inspector identifying one defect. Formally, the identification of a defect is regarded as a series of Bernoulli experiments (one for each independent inspector) with p = λ until the defect is detected the first time. Under the assumptions of independent events and fixed λ this leads to the cumulative geometric distribution (also known as the curve of diminishing returns) with the basic formula:
P(identified at least once|n Inspectors, λ ) = 1 − (1 − λ )n The Virzi formula has later been approved and amended by
the claim that for usability tests λ is roughly 0.3 [26]. This led to the still ongoing debate of “Five users is (not) enough” in Usability Engineering, where many authors reported different values for λ , which usually were lower (e.g. [34, 41]). Lewis resolved this by estimating the actual λ for a study from the first few sessions [21], still retaining the assumption of all inspectors and defects having the same probability. There have already been a few suggestions how to incorporate inspector skills and defect detectability into the model. Caulton extended the model for heterogeneity of groups regarding defect detectability in usability testing [5]. He assumed that there exist distinct subgroups of test persons that are sensitive to certain subsets of usability defects. The assumption of distinct subgroups might eventually be required for usability testing, but we believe that for inspection it would for now suffice to assume a continuum of a general skill to detect defects (Indeed, Caulton already notes that “p for a problem in a subgroup will also be a continuous variable”). This would result in the following model for predicting the detection probability of defects:
n
P(identified at least once|λ1 . . . λn ) = 1 − ∏(1 − λi ) i=1
On the other hand, Cockton & Woolrych assumed an individual λ j for any usability defect j, which results in the following model to predict the percentage G of identified defects out of the certain set [41]:
n
G(n; λ1 . . . λn ) =
∑ 1 − (1 − λ j )n
j=1
Both approaches regard an additional source of variance and are likely to predict the inspection process better than the simple Virzi model. Nevertheless, at the moment there are no approaches known to us which take this one step further and account for both, the inspector skills and the defect detectability. And, as will be argued in the next section, the estimators for these parameters lack generalizability and thus are not comparable between different settings. Comparing Method Performance
In the early nineties the (still popular) Heuristic Evaluation [25] and several other known or not so known inspection methods appeared and promised what was termed “discount usability” – good enough usability efforts at low costs. It is remarkable that since then, measuring the performance of inspections has been a main research aim in Usability Engineering with numerous empirical studies being conducted (for an overview, see [6]). Unfortunately, many of these studies suffered from severe methodological flaws, which led to a harsh critique by Gray & Salzman in their well-recognized “Damaged Merchandize” paper [12]. In the meantime, several researchers es-
tablished a canonical model to validly measure the performance of inspection methods [13, 33]: The basic measures of an evaluation experiment resemble the categories known from the signal detection theory: Hit - a true defect was detected, false alarm - a defect is denoted with no usage problems truly arising, correct rejection - an element is correctly identified as defect-free, and miss - a true defect was not identified. The basic performance criteria are derived from these measures as:
hits existing defects hits Validity = hits + false alarms Effectiveness = Thoroughness × Validity
Thoroughness =
While this framework definitely is an advance, it still has several inherent problems: The method performance is expressed as a single score obtained in a single experiment with a particular sample of inspectors and a particular set of defects. With the previous assumption that inspectors vary in their skills to detect defects, the results from the study are not easily comparable to other groups of inspectors. To achieve unbiased location parameters for the performance measures would at least require a carefully assembled sample that is representative for all inspectors out there. Unfortunately, this is a catch-22 as the model does not provide any means to estimate individual inspectors’ skills which are independent of the set of defects under consideration. The same problem arises with defects: The experimenter had to test a representative sample of applications in order to gain an unbiased location parameter. Furthermore, for the purpose of reliably predicting inspection processes no estimators for standard errors have been published so far. These are required for statements of confidence. As a main drawback of restricted generalizability, inspection methods cannot easily be compared across studies regarding performance. Within-subjects studies would avoid individual differences, but are usually not adequate because of learning effects. Meta studies might mitigate this problem. But it is far more desirable to have a measurement model which deals with variability of both performance influencing factors right from the start. Anatomy of Inspection Methods
The “signal detection“ measurement framework accounts for performance on a set of defects with aggregated scores only. Consequently, comparison of inspection methods can only have the form of a single difference score between two methods. But this is only true under the assumption that two inspection methods do exactly the same but with a single effectiveness delta. This assumption appears unplausible regarding the very different ideas current inspection methods are based on. For example, the Heuristic Evaluation is usually treated as an universal instrument to predict usability prob-
lems, whereas the Cognitive Walkthrough focuses on learnability [40] and the proposed inspection method based on usability patterns has a strong notion on design features [29]. This makes it important to develop performance measures that are differential with respect to certain types of defects. An ontology of defect types could, for example, follow the Usability Problem Taxonomy, suggested and validated by Keenan et al. [19]. Indeed, the existence of differential detection profiles has been indirectly shown by an advantage of mixing methods in inspection groups [31]. It was argued there that assessing the differential anatomy of inspection methods would eventually allow for significantly improving inspection processes and would also inspire for improving inspection methods. Sure enough, this aim presupposes a measurement approach that reveals phenomena on the level of individual defects and inspectors. REQUIREMENTS FOR A MEASUREMENT APPROACH
As a preliminary remark, in the following sections we will only refer to the measure of thoroughness. Most arguments also hold for validity, usually under the opposite sign. In order to account for both sources of variance in the inspection process, a model is needed, which assigns an individual detection probability to each combination of inspectors and defects. This model has the complication that the detection probability is no longer a variable, but a function Λ which assigns a probability λi j to each combination of inspector ability θi ∈ Θ (his/her skills) and the defect’s inherent difficulty ε j ∈ E to be detected,
Λ : Θ × E → [0, 1] whereas one would certainly assume that λi j = Λ(θi, , ε j ) increases with θi and decreases with ε j (Req 1). And, because λi j is a probability, Θ and E must be measures on a metric scale level (Req 2). In addition, an estimation procedure for both parameters is required that yields standard errors. Only this allows for probabilistic statements regarding the process – especially the confidence of process predictions (Req 3).
same ability measures regardless of the tested set of defects, as well as defect difficulties regardless of the inspector group (Req 4). This allowed for comparing data from experiments with the set of defects held fixed, but different inspector populations. In case of method comparisons the remaining performance difference can then unambiguously be assigned to the contribution of different methods. On the other hand, the independence of inspector ability estimates from the set of defects will allow for valid performance tests for inspectors. With such a test the abilities in a team of inspectors can be assessed in advance and used for precisely planning an inspection process towards a guaranteed detection rate. Finally, the model should allow for easy incorporation of additional parameters (Req 5). One such parameter is the contribution of a particular method to the inspection performance, but others can be thought of, for example inspectors’ domain expertise. In the following, we introduce a model that meets all of these requirements and can thus significantly enhance measurement of inspection processes. It is known as the Item Response Theory (IRT), which has become popular in the field of psychometrics and recently econometrics. INTRODUCING THE RASCH MODEL
The Item Response Theory (IRT) has its origins in the field of psychometric testing. It appeared as an alternative to the so-called classical test theory (CTT). In contrast to CTT the formal model of IRT treats individual test items and persons as primitives, instead of summative test scores. This has several advantages which correspond to the requirements we have proposed for a measurement model of inspections. With respect to our assumptions that inspector and defect variability account for the outcome of an inspection process, the simplest appropriate model from IRT is the Rasch model. Accordingly, we will focus on this model. But we will also refer to alternative models in case the assumptions of the Rasch model are prone to certain violations. Basic Concepts
As said before, such a model is appropriate for user testing as well: The only difference lays in the interpretation of Θ, which appears as inspector skill for inspections or as a user’s proneness to stumble across a defect in user testing (one may call this user sensitivity). If measuring validity from the false alarms is at stake, Θ can be interpreted as the inspectors proneness (or oversensitivity) to falsely report pretended defects, whereas E reads as the property of a pretended defect to appear as a true defect.
The basic random variable considered in IRT models is the response of an individual person to a particular item in a test. In contrast, the signal detection measurement approach like the CTT views the complete test score, respectively inspection process outcome, as the basic random variable. The Rasch model restricts to dichotomous response categories like “correct/incorrect”. The responses on a set of items by a set of persons is organized in the response matrix (Items × Persons), which is the basic data structure for estimating parameters and checking the model fit. In the domain of inspections these responses can be denoted as usability defects, which are detected (+) or missed (−) by individual inspectors.
For enabling cross-study comparisons of methods, some degree of generalizability has to be achieved. As argued in Comparing Method Performance, it is unpractical to achieve this with a reference to the real distribution of inspectors or defects. Instead, a measurement approach must yield the
In contrast to the “signal detection” measurement model (and CTT alike), IRT assumes that the probability of a correct response is a function of a latent person ability θ and the difficulty ε of the item. In the Rasch model this takes the form of the logistic function
0.8 0.6
ε=0
ε = 1.5
0.2
0.4
ε = −1.5
0.0
Probability to Solve
1.0
the ability difference in two conditions of an inspection experiment can directly be interpreted as the performance gain (or loss) of different methods. This performance gain of a method can be introduced as an additional parameter µ in the summative part of the item characteristic function and would appear as horizontally shifting the complete set of ICCs:
−4
−2
0
2
4
Ability
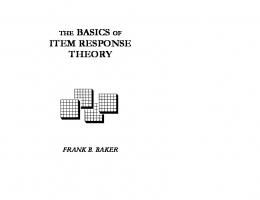
Figure 1. Item characteristic curves of a set of items show the probability of solving each item depending on the person ability θ .
P(+|θi , ε j ) =
eθi −ε j 1 + eθi −ε j
+ f j,k (θ |ε j , µk ) =
eθ +µk −ε j 1 + eθ +µk −ε j
This serves as one example for the ease of adding new parameters to the logistic model (Req. 5). Later, we will introduce the concept of differential item functioning, which provides powerful means to uncover differences in the ICCs between conditions. Basic Assumptions
The probability of an item j to be solved depending on the ability θ is called the item characteristic function.
f j+ (θ |ε j ) =
eθ −ε j 1 + eθ −ε j
A set of items can thus be depicted as a set of non-crossing sigmoid curves (item characteristic curves, ICC) giving the probability of solving each item depending on θ , as is illustrated in figure 1. There are some remarkable properties of the Rasch model, which are of large practical use for the problems of measuring inspections. First, the logistic function is a candidate for Λ as stated above (Req 1). A special property of the function is that θ and ε relate additively to each other. Therefore, it is possible to directly compare persons and items on one scale in that the ability of an individual inspector is expressed as a probability to solve a particular item (e.g., .5, which is exactly the steepest point of the sigmoid ICC). The Rasch model is usually held to measure on at least interval scale level, which fulfills our claim of metric scale measurement (Req 2). Irtel even claims ratio level scaling [18]. For a mathematically sound discussion of the scale level the reader is referred to [10]. Also, with the Rasch model there is no need to adjust the parameters with respect to a certain empirical distribution. (e.g., a normal distribution for inspectors ability, where the mean is defined as the median of the representative inspector population regarding their ability). Instead, they can be estimated from the set of correct/incorrect responses alone. This is one consequence from the property of specific objectivity, which the Rasch model fulfills [22]. In general, specific objectivity denotes that ability estimators are invariant to the subset of items chosen, and vice versa. This fulfills the requirement of generalizability (Req 4): Inspectors will get the same estimates of ability regardless of the set of defects that are tested (e.g. different software products). Consequently,
Response matrices are a typical outcome of inspection experiments, and it is quite plausible to assume defect detectability and inspector ability as the impacting factors. Thus, it appears obvious to transfer the concepts of IRT in order to advance the domain of inspection measurement. But IRT, and especially the Rasch model, is an axiomatic theory and poses strict assumptions to be fulfilled by the data at hand. In the following, we discuss these assumptions with respect to the domain of inspection processes. For many inspection experiments, restricting to a dichotomous response variable, as required by the Rasch model, fully suffices. But some inspection experiments included a severity rating for each defect (e.g. [41]). In this case a rating scale variant of the Rasch model is available [28]. As depicted in figure 1 the Rasch model assumes that the ICCs are monotonically increasing and that the slopes do not intersect (equal discrimination power of items). In the inspection realm this means that inspection outcome relies on one principal latent ability, which has a monotonic increasing impact on defect detection. The claim of equal discrimination may raise some concerns as this requires that every defect is prone to the same amount of additional random effects (i.e. noise). It has often been reported that there is also some impact of application domain knowledge on inspection success [2]. If domain knowledge affected certain defects differently, the assumption of equal sensitivity is violated, because the proportional impact of the principal detection ability differs. There are two solutions in case this violation comes true in real inspection experiments: First, under controlled experimental conditions it is possible to choose an application domain all inspectors are completely unfamiliar with. (Note that it does not suffice to hold the familiarity constant as this would not eliminate differential impact on defects.) This would, however, add a pessimistic bias to the measures, because inspectors are usually expected to acquire and utilize domain knowledge. Alternatively, one chooses a generalization of the Rasch model, which allows for differing sensitivity by adding a multiplicative parameter α to the ICC. This is known as the Birnbaum
model of the form:
f j+ (θ |ε j , α j ) =
eα j (θ −ε j ) 1 + eα j (θ −ε j )
Another property of the Rasch ICCs is that the slopes tend to zero with decreasing ability. This disallows for a chance of guessing the items right. This may happen in fixed-response multiple-choice questions, but is unlikely a problem with defect identification, which is a free-response task. The central assumption regarding the response matrix is local stochastic independence, which denotes that the probability of a person i solving an item j solely depends on the persons ability θi and the item difficulty ε j . In particular, this forbids any ordering effects. In the domain of inspections this assumption may be challenged: First, if inspection sessions are too long, the probability of finding a defect later in the walkthrough might increasingly suffer from fatigue. Second, the user interface designer might have introduced a set of quite similar defects (e.g. consistently using radio buttons for long option lists). If an inspector finds one of these defects he or she might more easily find similar defects, which introduces a stochastic dependence between events. These concerns are relevant, but they can be mitigated by adequately designing an inspection experiment. Obviously, the duration should be kept short enough to not introduce fatigue effects. In general, the experiment must not put any time restrictions, but it must allow each participant to encounter every defect. If this is not feasible, the coverage of each individual inspection has to be carefully tracked in order to exclude defects from the estimation that have not been reached. Basically this means to measure for effectiveness, whereas efficiency can easily be obtained by tracking the time each participant required. For learning between defects two approaches can be taken: Either the object and scope of inspection should be selected carefully so that all defects are pairwise unsimilar. Alternatively, detection events, where the defect is suspected to having a similar predecessor, are excluded ex post. And again, there is a Rasch model derivate available, where learning effects are explicitly handled [37]. Fortunately, there is usually no influence of previous inspectors in the current practice of inspection experiments and processes, where sessions are held independent. A central theorem in IRT is given by the proof of Andersen [3]: Roughly, it states that if the above assumptions hold true then the sum of correct responses in a given set of items is a minimal sufficient statistic. This means that the sum of correctly identified defects is indeed an appropriate measure of inspector ability. This is what the signal detection approach implicitly assumes as well. But in contrast, the IRT provides means to check for these assumptions and draws this as a conclusion in a mathematically exact manner. As we have argued, there might appear phenomena in inspection processes causing a violation of the Rasch model’s assumptions. In any case, this can be solved by either con-
trolling for these factors via experimental design or by choosing an appropriate derivate of the Rasch model. Last but not least, these concerns apply to the signal detection measurement model as well. But, in contrast, the IRT provides powerful means to expose and cope with these violations. Procedures of Analysis
We will now outline the basic and some advanced IRT procedures to estimate parameters, check assumptions and further analyse inspection outcomes. Most of these procedures are already available in dedicated software packages. This is why we focus on the underlying ideas. Raw Data Preparation
The basic data structure for the IRT is the response matrix. For the inspection realm we assume that a set of inspectors conducts an inspection on a certain application with the same method (e.g., Heuristic Evaluation). For now, we regard the dichotomous case only, where a defect is either detected or missed. As is typical for inspection processes, there has to follow a aggregation procedure, where similar reports of the inspectors are grouped under a single defect. Finally, the proposed defects have to be verified via the procedure of falsification testing [1] resulting in a verified response matrix. Note that falsification testing also yields a dichotomous matrix for false identifications, which can be analyzed quite analogously in order to measure the aspect of validity. Estimation of Parameters
The parameter vectors E = [ε1 , ..., εm ] and Θ = [θ1 , ..., θn ] are estimated from the response matrix. There exist several estimation procedures (esp. conditional maximum likelihood (CML), joint maximum likelihood (JML), marginal maximum likelihood (MML), see [24] for an overview). The preferable procedure is the CML estimation, which computes the item parameters first, then the person parameters. This is tightly connected to the existence of a minimal sufficient statistic for θ [22]. CML is known to be robust, does not presume a certain distribution type and is implemented in various tools for IRT analysis (e.g., [23]). Contrary to JML estimates, CML estimates are asymptotically consistent under mild conditions. Because of the exponential family, the estimated asymptotic covariance matrix can be obtained [24]. It was proven that the ML estimator (MLE) is asymptotically normally distributed [20]; more specifically, r L (MLE − θ ) ∑(Pi (1 − Pi ) → N(0, 1). i
This result can directly be used to construct level-α confidence intervals that are asymptotically correct [15] (Req.3): zα 2 MLE ± q ∑(Pi (1 − Pi ) i
This property of CML faciliates the testing of specific item fit as well as global model fit [23]. A particular disadvantage of CML compared to MML is that persons with a zero
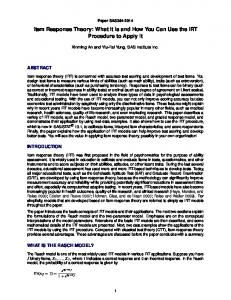
Wald test focus on meaningful subgroups of the sample of respondents. On item-level it is applied by splitting subjects into subgroups, either median split or with deliberate split. Furthermore, the data must conform to model assumptions about dimensionality. In case of the Rasch model the measured constructs are unidimensional. Which means that they have one prominent factor underlying them with all other factors being functionally insignificant. A technique specifically developed to check for unidimensionality in IRT models is the Dimtest [16]. Figure 2. Graphical Parameter Test - parameters are estimated for each subsample separately. In case of near-to-perfect correlation the Rasch model is fulfilled.
or perfect score are removed from the estimation process. We believe that to be a rare problem with inspection experiments, where the overall detection probability have moderate ranges from .21 to .60 [26]. Checking Model Assumptions
Another convenient property of CML estimates is that various model tests exist for checking the assumptions. An important consequence of the Rasch model is that consistent item parameter estimates can be obtained from a sample of any subgroup of the population. Thus, on item level sample independence must hold. If the sample is split in, e.g. two parts, and the corresponding item parameters are estimated for each part separately the parameters should be the same for each subsample. A first assessment of homogeneous item functioning is made by a graphical test, plotting the different parameter estimates as depicted in figure 2. Predictions, based on the estimated model, should be examined in cross-validation samples. Anderson’s LR (Likelihood Ratio) Test is specifically used with CML, because item parameters can be consistently estimated in any sample of the population, where the model applies [38]. As mentioned, if items fit the model, the parameter estimates are equal apart from random fluctuations in any subset of the sample. Figure 2 depicts how to conduct a graphical test based on this idea, where one item appears inconsistent. For a statistical test, assume that LC (βˆ ; X) is the conditional likelihood function evaluated by using the CML estimates of the item parameters obtained from all data X. Further assume that LC (βˆg ; Xg ) is the conditional likelihood function evaluated using the CML estimates of the item parameters obtained by using subgroup Xg . Then, having parameter estimators for different subgroups the following likelihoodratio statistic has an asymptotic χ 2 -distribution with d f = |βˆg | − |βˆ |:
G
LR = 2( ∑ lnLC (βˆg ; Xg )−lnLC (βˆ ; X)) g=1
The alternative Wald test has much in common with the LR test: One starts with defining a general model, and tests whether certain restrictions hold. Most applications of the
The analysis of real data from inspection experiments may reveal violations of certain assumptions of the Rasch model. As depicted above, a variety of derivates of the model with relaxed assumptions exist. E.g., in the Birnbaum model the ICC do not have to appear parallel by introducing a further parameter. In order to compare the fit of different models the Akaike Information Criterion (AIC) is available from the ML estimation. The AIC enables to choose the model that fits for the data at hand best with respect to parsimony. Differential Item Functioning
An issue with political impact in psychometric testing is the fairness of a particular item with respect to subgroups (e.g. gender, ethnical groups). This led to the concept of differential item functioning (DIF) accounting for the fact that items might function differently in different groups. The original goal is to expose these differences and eliminate unfair items [7]. Instead, in the domain of usability inspection measurement the concept of DIF is promising to analyse relevant differential phenomena. Obviously, the DIF concepts can be utilized to compare different inspection methods regarding the overall performance. DIF analysis can also reveal differences in sensitivity to certain defect types as we suggested in Anatomy of Inspection Methods. Further on, there are interesting questions regarding the impact of expertise and learning that could be explored via DIF. In general, the introduction of a particular inspection method can be regarded as a learning process, which changes the detection difficulty of defects. Several types of change can be proposed and tested via DIF: 1. A particular method adds a constant amount of detectability to the defects. This results in ICCs that are shifted horizontally without change in order or intervals. 2. A particular method equalizes the difficulty of defects, such that previously hard-to-detect defects are now easier being detected. This results in a horizontal shift of ICCs with closing intervals but ordering preserved. 3. Two methods have an arbitrary differential impact on defects, with different orderings of ICCs. This may reveal differences in the methods’ focus in certain defect types. Different approaches have been established to identify DIF between two subgroups: The non-parametric Mantel-Haens-
H0 : [R1m /W1m ] = [R2m /W2m ], m = 1, ..., M. If an item is “fair”, the odds of getting the item correct at a given level of the matching variable is the same in different groups across all M levels of the matching variable. The second approach utilizes the parameters of the IRT [36]: In order to identify the specific types of DIF, procedures for graphical analysis of ICCs have been suggested [35]. The difference between the two ICCs can be measured by the total area enclosed between the curves. This area represents the discrepancies in probabilities of correct responses between the two groups. For the convenience of calculation, the θ scale can be divided into very small discrete intervals at increments of δθ (e.g.,δθ = 0.005). In the Birnbaum Model the discrimination factor might differ in the groups so the ICCs can intersect each other. In this case it is required to calculate absolute values:
A1i = ∑ |PXi (θ j ) − PXi (θ j )| · δθ Further guidelines for evaluating particular hypotheses on DIF are given by [32]. A summary of three approaches to test for significant DIF is given by [16]: Likelihood ratio tests, Wald tests and Lagrange Multiplier tests. Each test can, in principle, be applied to a single item, a number of items or the test as a whole.
0.08 0.02
0.04
0.06
σ(θ) = 2 σ(θ) = 1 σ(θ) = 0.5
0.00
Variance of Group Result
zel (MH) test is applied to the response matrices in both conditions without the need to estimate the parameters first [8]. The MH procedure involves a comparison of the log-odds ratio of endorsing keyed responses for different groups, computed after partitioning the sample into categories on the basis of counting correct scores. The null DIF hypothesis for MH method comparing two groups can be expressed as:
2
4
6
8
10
Group Size
Figure 3. Variance in the process outcome depending on the number of inspectors with σ (θ ) = [.5, 1, 2]
In a recent study, the variance of evaluation outcome was examined based on real data [9], with the result that with increasing sample size the variance diminishes. This could as well have been shown with solely simulated data employing the Virzi formula. With the Rasch formula this can be taken one step further in that the impact of the variance of defect detectability and inspector ability on process variability can be analyzed. For ε we choose the distribution N(0, 1) and for θ a normal distribution with µ = −1.1. This yields an average detection probability of λi j ≈ .3, which is typical for inspections [26]. In order to investigate the impact of variance in inspector ability, a simulation is run with different σ (θ ) = [.5, 1, 2]. The variance of process outcome (group thoroughness) is measured for varying inspector team sizes n = [1, 2, . . . , 10]. As shown in figure 3, the variance in group thoroughness depends largely on the team size (which was the original result [9]), but with smaller groups (n < 6) there also appears a considerable impact of the variance of inspector ability. This has to be taken into account, if a guaranteed outcome of inspection processes is required. Here, it serves as one example that the Rasch formula is a powerful means to model, simulate and understand inspection processes.
APPLICATIONS OF THE ITEM RESPONSE MODEL
So far, we have transferred the basic and some advanced concepts of the IRT to the domain of inspection process measurement. Researchers and practitioners may apply the model to their data and verify whether the model is formally appropriate and provides practical added value. In order to ease the latter, we now present three basic application scenarios. Each scenario is accompanied by a demonstrator program employing the freely available R Statistical Computing Environment [27] and the extended Rasch modelling package eRm [23]. For the sake of space, the procedures and results of the scenarios are only outlined. Details can be obtained from the previous sections, general statistics textbooks or by running and inspecting the demonstrator programs, which are available for download [30] or on request. Simulating Inspection Processes
The most basic application of the IRT is using the Rasch formula (introduced in Basic Concepts) for modelling the core inspection process. This demonstrates the utility of the function λi j = Λ(θi , ε j ) for investigating the behavior of complex inspection processes accounting for both impact factors – difficulty and ability.
Testing Inspector Ability
A preliminary step for several further applications of Rasch measurement in inspection research and practice is a test for inspectors’ skills. In the following scenario a diagnostic instrument for assessing inspectors ability is set up, which, by the way, is close to the original purpose of the IRT approach. First, it is required to establish a test: A sample of participants (n = 30) may be asked to fully inspect a sample application with previously known usability defects (n = 30, verified via falsification testing [1]). For demonstration purpose this test is simulated like the previous scenario (θ ∼ N(−1.1, 1), ε ∼ N(0, 1)), yielding a 30 × 30- response matrix. From this matrix the defect difficulty parameters are estimated with the CML method. The model is then approved with the LR-test, which yields a LR-value of 20.25 (df = 22)1 and p = .57 for instance. The null hypothesis of the values of ε being equal in subgroups can be retained, which means the Rasch model holds. Alternatively, a graphical test or the Wald test may be conducted to identify and 1 Some items with full 0/1 response patterns in either subgroup excluded from the test
● ●
●
●
●
●
33 32 34
mean ε¯j of the defect parameters from the test construction scenario. To demonstrate the increased accuracy of prediction, we prepared a simulation of the inspection process with the samples from the test construction scenario above and compared the accuracy of prediction between two conditions: In the first condition, the prediction relies only on the mean values of the parameters and the expected outcome with n inspectors OV is computed with the homogeneous prediction formula (“Virzi predictor”):
● ●
−4
5
● ●
0 31
35
●
●
● ● ● ● ● ● ●
1
●
● ● ●
● ● ● ● ●
●
31
−1
●
−2
15 10
Defects
20
●
● ● ●
● ● ●
0
● ●
25
● ●
−3
30
●
32
33
34
35
ˆ
OV (λ ) = 1 − (1 − λ )n , λ =
ˆ
eθ1 ,...,θn −ε1 ,...,εm 1 + eθˆ1 ,...,θˆn −ε1 ,...,εm
Inspectors
Figure 4. Raw test results with five inspectors and distribution of inspector ability θ in the sample
eliminate individual items that violate the Rasch model. Finally, a table with each possible raw score (sum of correctly identified defects) and the associated person parameter is computed. This is possible due to the raw score being a sufficient statistic (see Basic Assumptions). As an application consider a team of five inspectors (for example in a usability consulting agency) to be tested. These participate in the test by conducting an inspection of the test application. Again, raw scores are computed and the person parameters are simply obtained from the test score table. Alternatively, the complete test construction procedure may be run with the added participants, which further improves the estimates due to the larger sample and yields standard errors for person parameter estimates. Figure 4 shows the test response matrix and the person parameters compared to the distribution of the calibration sample. The latter can now be employed to justify the need for additional training (e.g. the inspectors 32-34) or can be used to predict real inspection processes with this group of inspectors. The scenario can be enhanced in several ways. For observed response vectors the standard error of the person parameter can be obtained and can act as a criterion for reliability of an individual measure. Finally, any (reasonably large) subset of the defects can be selected for testing; for example, if one wants to assess the impact of training with a retest so that two different sets of items are required. Predicting Process Outcome
The outcome of an inspection process can be regarded as a three-fold random experiment: A sample of inspectors is chosen from the population, a sample of defects is chosen from the defect population and each pair undergoes a Bernoulli process. All three sources count for undeterminism of process outcome. In this final demonstration we show that the process is predicted more accurately, if the individual abilities in the sample of inspectors are assessed a priori. This is achieved by testing the inspectors as depicted in the previous scenario. Of course, the individual defect parameters cannot be estimated in advance. Thus, we choose the
In the second condition the outcome OR is predicted with the mean value of the defect parameters and the estimated inspector parameters θ1 , . . . , θn (“Rasch predictor”):
n
OR (λ1 , . . . , λn ) = 1 − ∏(1 − λi ), λi = i=1
ˆ
eθi −ε1 ,...,εm 1 + eθˆi −ε1 ,...,εm
We expect the latter model to better predict the outcome of the process. For demonstration, the test construction procedure from the above scenario was used; 100 groups of five inspectors were randomly chosen (θ ∼ N(−1.1, 1)) and tested to obtain the estimated person parameters θˆ . For each group an inspection experiment was simulated with 100 defects (ε ∼ N(0, 1)). This was repeated 300 times to gather data. Then a linear regression (predicted~observed) was conducted in both conditions. As can be seen in figure 5, the Virzi predictor predicted the average expected outcome quite well but does not account for the variance. In turn, the Rasch predictor accounts for the variance caused by individual θi and predicts the outcome much better. A subsequent analysis of variance reveals that the residual sum of squares with the Virzi predictor (RSSVirzi = 3.194) is about six times as large as in the Rasch condition (RSSRasch = 0.522). This means a much better prediction of the process, if inspector abilities are prior assessed with a Rasch-based test. Finally, this scenario shows that a reasonable sample size of 30 participants may suffice for the estimation of parameters in order to get results of practical value. CONCLUSION
We transferred the concepts of psychometric measurement with item response theory to the domain of measuring inspection processes. We regard this approach as a promising advance in the field for practical appliance and research on usability evaluation methods. It was demonstrated how the Rasch formula can be employed to study the inspection process under various conditions. For that purpose, we chose a simulation approach which is quite flexible and intuitive. In future, the simulation findings may lead to (more elegant) mathematical proofs of certain characteristics of this particular stochastic process. Close to its origin, the Rasch model can be employed for assessing the impact factors – primarily the skills of inspectors
Predicted
Known Individual Thetas 0.4 0.5 0.6 0.7 0.8 0.9
0.4 0.5 0.6 0.7 0.8 0.9
Known Distribution of Theta
4. Anne Boomsma, Marijtje A. J. van Duijn, and Tom A. B. Snijders, editors. Essays on Item Response Theory, volume 157 of Lecture Notes in Statistics. Springer, 2001. 0.4
RSS= 3.194
multiple-choice questionnaires. British Journal of Mathematical and Statistical Psychology, 26:31–44, 1973.
0.6
0.8
1.0
Rasch Predictor RSS= 0.522
Figure 5. Results from predicting the process outcome under (1) homogeneity assumption with known µ(θ ) and (2) with individual θi obtained from a Rasch-based test.
– according to the standards of psychometric testing. The major benefit is the opportunity for comparing performance measures across studies which results from the specific objectivity in IRT. Another advantage is the availability of standard errors of the parameters. This truly acknowledges the uncertainty underlying the inspection process and still allows for honest predictions. According Jared Spool (CEO of User Interface Engineering) in his keynote on the British HCI 2007 conference this is one of the major research challenges in Usability Engineering: In modern e-business applications usability becomes a mission-critical property and the question is no longer if testing 5 or 8 users suffice for an 80% detection rate, but if it suffices to identify 99% or even closer to 100% of the usability defects. As a next step, it is inevitable to investigate to what extent experimental data fulfills the strict axiomatic assumptions of the Rasch model. In case the Rasch model’s assumptions are not fully satisfied we directed several alternatives from the family of IRT models. Anyways, an advantage of IRT is that previously implicit assumptions can explicitly be tested. Even if certain violations are observed, this still yields deeper insight into the anatomy of inspection processes - for example the lack of objectivity when rating usability problems. This is taken one step further with the concept of differential item functioning. In usability research DIF analysis has the potential to resolve some outstanding questions about usability evaluation processes: in particular, the impact of expertise and sources of knowledge [2], the diversity of results from different methods and teams [14] or the synergy in mixed-method processes [31]. REFERENCES
1. Alan Woolrych, Gilbert Cockton, and Mark Hindmarch. Falsification Testing for Usability Inspection Method Assessment. In Proceedings of the HCI 2004, 2004. 2. Alan Woolrych, Gilbert Cockton, and Mark Hindmarch. Knowledge Resources in Usability Inspection. In Proceedings of the HCI 2005, 2005. 3. E. B. Andersen. Conditional inference for
5. David A. Caulton. Relaxing the homogeneity asssumption in usability testing. Behaviour & Information Technology, 20(1):1–7, 2001. 6. Gilbert Cockton, Darryn Lavery, and Alan Woolrych. Inspection-based evaluations. In Julie A. Jacko and Andrew Sears, editors, The human-computer interaction handbook: fundamentals, evolving technologies and emerging applications, pages 1118–1138. Lawrence Erlbaum Associates, Inc., Mahwah, NJ, USA, 2003. 7. Nancy S. Cole. History and Development of DIF, chapter 2, pages 25–29. In Holland and Wainer [17], 1993. 8. Neil J. Dorans and Paul W. Holland. DIF Detection and Description: Mantel-Haenszel and Standardization, chapter 3, pages 35–66. In Holland and Wainer [17], 1993. 9. Laura Faulkner. Beyond the five-user assumption: Benefits of increased sample sizes in usability testing. Behavior Research Methods, Instruments & Computers, 35(3):379–383, 2003. 10. Gerhard H. Fischer. Derivations of the Rasch Model. In Gerhard H. Fischer and Ivo W. Molenaar [11], pages 15–38. 11. Gerhard H. Fischer and Ivo W. Molenaar, editors. Rasch models: Foundations, recent developments and applications. Springer-Verlag, New York Berlin Heidelberg, 1995. 12. Wayne D. Gray and Marilyn C. Salzman. Damaged merchandise? A review of experiments that compare usability evaluation methods. Human-Computer Interaction, 13(3):203–261, 1998. 13. H. Rex Hartson, Terence S. Andre, and Robert C. Williges. Criteria for evaluating usability evaluation methods. International Journal of Human-Computer Interaction, 15(1):145–181, 2003. 14. Morten Hertzum, Niels Ebbe Jacobsen, and Rolf Molich. Usability inspections by groups of specialists: perceived agreement in spite of disparate observations. In CHI ’02: CHI ’02 extended abstracts on Human factors in computing systems, pages 662–663, New York, NY, USA, 2002. ACM Press. 15. Herber Hoijtink and Anne Boomsma. On Person Parameter Estimation in the Dichotomous Rasch Model, chapter 4, pages 53–68. In Gerhard H. Fischer and Ivo W. Molenaar [11], 1995.
16. Herbert Hoijtink. Conditional Independence and Differential Item Functioning in the Two-Parameter Logistic Model, chapter 6, pages 109–130. Volume 157 of Boomsma et al. [4], 2001. 17. Paul W. Holland and Howard Wainer, editors. Differential Item Functioning. Lawrence Erlbaum Associates, 1993. 18. Hans Irtel. The uniqueness structure of simple latent trait models. In G. H. Fischer and D. Laming, editors, Contributions to Mathematical Psychology, Psychometrics, and Methodology, pages 265–275. Springer, 1994. 19. Susan L. Keenan, H. Rex Hartson, Dennis G. Kafura, and Robert S. Schulman. The Usability Problem Taxonomy: A framework for classification and analysis. Empirical Software Engineering, 4(1):71–104, 1999. 20. K. C. Klauer. Asymptotic properties of the ML estimator of the ability parameter when item parameters are known. Methodika, 4:23–26, 1990. 21. James R. Lewis. Evaluation of procedures for adjusting problem-discovery rates estimated from small samples. International Journal of Human-Computer Interaction, 13(4):445–479, 2001. 22. Patrick Mair and Reinhold Hatzinger. CML based estimation of extended Rasch models with the eRm package in R. Psychology Science, 49(1):26–43, 2007. 23. Patrick Mair and Reinhold Hatzinger. Extended Rasch Modeling: The eRm Package for the Application of IRT Models in R. Journal of Statistical Software, 20(9):1–20, May 2007. 24. I. W. Molenaar. Estimation of Item Parameters, chapter 3, pages 39–52. In Gerhard H. Fischer and Ivo W. Molenaar [11], 1995. 25. Jakob Nielsen. Finding usability problems through heuristic evaluation. In CHI ’92: Proc. of the SIGCHI conference on Human factors in computing systems, pages 373–380, New York, NY, USA, 1992. ACM Press. 26. Jakob Nielsen and Thomas K. Landauer. A mathematical model of the finding of usability problems. In CHI ’93: Proceedings of the SIGCHI conference on Human factors in computing systems, pages 206–213, 1993. ACM Press. 27. R Development Core Team. R: A Language and Environment for Statistical Computing. R Foundation for Statistical Computing, Vienna, Austria, 2006. ISBN 3-900051-07-0. 28. Jürgen Rost. The Growing family of Rasch Models, chapter 2, pages 25–42. Volume 157 of Boomsma et al. [4], 2001.
29. Martin Schmettow. Towards a pattern based usability inspection method for industrial practitioners. In Proceedings of the Workshop on Integrating Software Engineering and Usability Engineering (held on Interact 2005), 2005. http://www.se-hci.org/bridging/ interact2005/03_Schmettow_Towards_UPI.pd%f. 30. Martin Schmettow. Introducing IRT for measuring usability inspection processes - accompaning programs. Website, September 2007. http://schmettow.info/IRT/. 31. Martin Schmettow and Sabine Niebuhr. A pattern-based usability inspection method: First empirical performance measures and future issues. In Devina Ramduny-Ellis and Dorothy Rachovides, editors, Proceedings of the HCI 2007, volume 2 of People and Computers, pages 99–102. BCS, September 2007. 32. Alicia P. Schmitt, Paul W. Holland, and Neil J. Dorans. Evaluating Hypotheses about Differential Item Functioning, chapter 14, pages 281–315. In Holland and Wainer [17], 1993. 33. Andrew Sears. Heuristic walkthroughs: Finding the problems without the noise. International Journal of Human-Computer Interaction, 9(3):213–234, 1997. 34. Jared Spool and Will Schroeder. Testing web sites: Five users is nowhere near enough. In Proceedings of ACM CHI Conference on Human Factors in Computing, Seattle, WA, USA, 2001. 35. Hoi K. Suen. Principles of Test Theories. Lawrence Erlbaum Associates, Hillsdale, New Jersey, 1990. 36. David Thissen, Lynne Steinberg, and Howard Wainer. Detection of Differential Item Functioning Using the Parameters of Item Response Model, chapter 4, pages 67–113. In Holland and Wainer [17], 1993. 37. N. D. Verhelst and C. A. D. Glas. A dynamic generalization of the Rasch model. Psychometrika, 58(3):395–415, 1993. 38. N. D. Verhelst and C. A. W. Glas. Testing the Rasch Model, chapter 5, pages 69–96. In Gerhard H. Fischer and Ivo W. Molenaar [11], 1995. 39. Robert A. Virzi. Refining the test phase of usability evaluation: How many subjects is enough? Human Factors, 34(4):457–468, 1992. 40. Cathleen Wharton, John Rieman, Clayton Lewis, and Peter Polson. The cognitive walkthough method: A practitioner’s guide. In Jakob Nielsen and Robert L. Mack, editors, Usability Inspection Methods, pages 105–140. John Wiley & Son, 1994. 41. A. Woolrych and G. Cockton. Why and when five test users aren’t enough. In J. Vanderdonckt, A. Blandford, and A. Derycke, editors, Proceedings of IHM-HCI 2001 Conference, volume 2, pages 105–108. Cepadeus, Toulouse, France, 2001.


![[PDF] Download Item Response Theory - Google Sites](https://m.moam.info/img/260x300/pdf-download-item-response-theory-google-sites_6478ad92097c474c228d661c.jpg)


