Journal of Family Psychology 2007, Vol. 21, No. 4, 572–583
Copyright 2007 by the American Psychological Association 0893-3200/07/$12.00 DOI: 10.1037/0893-3200.21.4.572
Testing the Ruler With Item Response Theory: Increasing Precision of Measurement for Relationship Satisfaction With the Couples Satisfaction Index Janette L. Funk and Ronald D. Rogge University of Rochester The present study took a critical look at a central construct in couples research: relationship satisfaction. Eight well-validated self-report measures of relationship satisfaction, including the Marital Adjustment Test (MAT; H. J. Locke & K. M. Wallace, 1959), the Dyadic Adjustment Scale (DAS; G. B. Spanier, 1976), and an additional 75 potential satisfaction items, were given to 5,315 online participants. Using item response theory, the authors demonstrated that the MAT and DAS provided relatively poor levels of precision in assessing satisfaction, particularly given the length of those scales. Principal-components analysis and item response theory applied to the larger item pool were used to develop the Couples Satisfaction Index (CSI) scales. Compared with the MAS and the DAS, the CSI scales were shown to have higher precision of measurement (less noise) and correspondingly greater power for detecting differences in levels of satisfaction. The CSI scales demonstrated strong convergent validity with other measures of satisfaction and excellent construct validity with anchor scales from the nomological net surrounding satisfaction, suggesting that they assess the same theoretical construct as do prior scales. Implications for research are discussed. Keywords: relationships, marriage, satisfaction, item response theory, measure development
Relationship satisfaction has become a central construct, both in the field of basic relationship research and in the marital treatment literature, serving as a cornerstone for our understanding of how relationships and marriages work. At present, the measurement of relationship satisfaction has been operationalized with self-report scales. Although these measures have a large body of literature supporting their construct validity (see Bradbury, Fincham, & Beach, 2000, for a review), they have never been systematically subjected to an item-level analysis in order to evaluate their current level of precision. This would be analogous to conducting 30 years of research on fevers and fever medications using the same brand of thermometers without knowing whether the thermometers were accurate to a single degree or to ⫾10°. Considering the widespread use of this construct and its central place in models of relationship functioning, it is important to take a critical look at the quality of relationship
satisfaction measures to see how well they actually assess satisfaction. The present study examined eight short and wellvalidated measures of relationship satisfaction, focusing primarily on scales that are freely available for research use. With 2,191 citations, the 32-item Dyadic Adjustment Scale (DAS; Spanier, 1976) is by far the most widely cited measure of relationship adjustment. Originally designed to optimally distinguish married from divorced spouses, the DAS has been used extensively in the marital treatment literature (e.g., Christensen et al., 2004). Despite its widespread use, the DAS has fallen under criticism by several researchers (e.g., Fincham & Bradbury, 1987; Heyman, Sayers, & Bellack, 1994; Norton, 1983), most notably for its heterogeneous item content that introduces possible confounding variance from constructs like communication. With 1,489 citations, the 15-item Marital Adjustment Test (MAT; Locke & Wallace, 1959) is the second most widely cited measure of satisfaction and also was developed to optimally distinguish between well-adjusted and distressed relationships. The MAT and the DAS contain substantially overlapping item content, sharing 12 nearly identical items. With 221 citations, the six-item Quality of Marriage Index (QMI; Norton, 1983) is the third most widely cited measure of satisfaction. Originally developed to address shortcomings in the DAS and MAT, the QMI contains only global satisfaction items, providing more homogeneous item content. The final two most widely cited measures in the literature are the seven-item Relationship Assessment Scale (RAS; Hendrick, 1988; 156 citations) and the three-item
Janette L. Funk, Department of Clinical and Social Sciences in Psychology, University of Rochester; Ronald D. Rogge, Department of Clinical and Social Sciences in Psychology, University of Rochester. This research was supported by an internal grant from the University of Rochester. We thank all of the respondents who participated in this study. Correspondence concerning this article should be addressed to Janette L. Funk, 472 Meliora Hall, Department of Clinical and Social Sciences in Psychology, University of Rochester, RC Box 270266, Rochester, NY 14627-0266. E-mail:
[email protected]
572
COUPLES SATISFACTION INDEX
Kansas Marital Satisfaction Scale (KMS; Schumm, Nichols, Schectman, & Grinsby, 1983; 155 citations). As with the QMI, the items of the RAS and the KMS are globally worded and relatively homogeneous. Beyond the five most cited measures of satisfaction, three additional scales bear discussion. To begin, multiple attempts have been undertaken to shorten the length of the DAS. In one of the early attempts, Sharpley and Cross (1982) created the DAS(7) by conducting discriminant, internal consistency, and factor analyses on the DAS to select the items that best discriminated between distressed and nondistressed spouses. More recently, Sabourin, Valois, and Lussier (2005) created the DAS(4) by using nonparametric IRT (Hambleton, Swaminathan, & Rogers, 1991) on the 32 items of the DAS (translated into French for a French–Canadian sample) to select the four items that consistently provided the most information at the distress threshold. In a novel approach to measuring satisfaction, Karney and Bradbury (1997) developed the 15-item Semantic Differential (SMD), assessing satisfaction by asking respondents to rate their relationships on 6-point scales between adjective pairs (e.g., good– bad, enjoyable– miserable). Although this measure has appeared in only four published studies, it has produced longitudinal results that are nearly identical to the MAT and the QMI with an array of constructs from the nomological net surrounding relationship satisfaction (Davila, Karney, Hall, & Bradbury, 2003; Johnson & Bradbury, 1999; Karney & Bradbury, 1997).
The Present Study The present study sought to bring a greater level of precision to the field of relationship research by developing a new set of satisfaction measures using IRT—a methodology typically used to create standardized tests like the Scholastic Aptitude Test. By simultaneously estimating latent trait scores for each respondent and response curves (based on those scores) for each item, IRT is able to estimate how much information or precision each item offers across the entire range of the latent trait being measured, creating an item information curve (IIC), or profile of the information provided by each item. These IICs can then be summed to create test information curves (TICs) to reveal the information provided by different scales. Although the number of parameters involved in IRT requires extremely large sample sizes, IRT offers a powerful tool for directly assessing the precision of measurement offered by different scales. To apply IRT to the task of optimizing the assessment of relationship satisfaction, a set of 180 potential satisfaction items were given to an online sample of 5,315 respondents. In the first step of analysis, the existing measures of satisfaction within that item pool were evaluated to determine the relative amount of information (or precision) provided by each measure. We hypothesized that given the focus of their designs (to accurately identify discordant couples), measures like the MAT, the DAS, the DAS(7), and the
573
DAS(4) would provide higher levels of information in the distressed range of relationship functioning and correspondingly lower levels of information at higher levels of relationship functioning. In the second step, we performed IRT analyses on a set of unidimensional satisfaction items within the larger item pool to identify the 32 (16 and 4) most effective items for assessing relationship satisfaction, creating three versions of a new satisfaction measure with lengths appropriate to a variety of different applications (from marital treatment studies requiring the increased precision offered by 32-item scales to national surveys requiring the brevity of four-item scales).
Method Participants A total of 6,389 individuals responded to an online survey1, resulting in a final sample of 5,315 respondents after cleaning (see details below).2 The participants were predominantly female (80.0%) and Caucasian (75.8%), with 5.0% African American, 5.1% Latino, and 4.1% Asian. The mean age was 26.0 years (SD ⫽ 10.5). The average income was $27,207 per year (SD ⫽ $2,673). A majority of the participants attended college (38.9% some college, 22.6% bachelor’s degree, 12.3% graduate degree), and 25.8% completed high school or less. A majority of the respondents (60.1%) were dating seriously, with 23.6% married and 16.3% engaged. The average length of relationship was 1.68 years (SD ⫽ 2.61) for the seriously dating couples, 9.02 years (SD ⫽ 8.68) for the married participants, and 3.05 years (SD ⫽ 2.31) for the engaged participants. Married respondents had been married an average of 6.27 years (SD ⫽ 8.98). The sample was modestly happy, with mean DAS (Spanier, 1976) scores of 113.2 (SD ⫽ 19.6) for dating participants, 107.5 (SD ⫽ 22.8) for married participants, and 116.8 (SD ⫽ 17.9) for engaged participants.
Procedure Respondents had to be at least 18 years old and currently in a romantic relationship to participate and were recruited via online forums (35%; e.g., www.theKnot.com), email lists (21%; e.g., alumni mailing lists), and online advertising 1 Using Internet protocol (IP) addresses, time stamps, and answers to open-ended questions within the survey, the data were screened for multiple submissions prior to arriving at this number of respondents. Multiple submissions were relatively rare (fewer than 1 in 100) and were typically a result of a participant clicking the final submit button more than once. 2 The survey did not directly assess whether both partners of a couple participated, raising the possibility of unmodeled dependencies within the data, which could have affected the results. However, as 93% of the respondents were heterosexual and 80% were female, the majority of the respondents should be independent of one another. Further, separate analyses with men and women produced results identical to those obtained in the full sample, suggesting that the results presented were not simply a by-product of unmodeled dependencies.
574
FUNK AND ROGGE
(29%; e.g., Google AdWords). The survey took 25–30 min to complete and contained roughly 280 questions: a pool of 146 relationship satisfaction items, 7 anchor scales representing constructs from the nomological net surrounding relationship satisfaction, and 2 validity scales that assess respondent attention and effort. Feedback on their relationship satisfaction was given at the end of the survey as a recruitment incentive.
Measures of Relationship Satisfaction and Quality DAS. The DAS (Spanier, 1976) is a 32-item measure of satisfaction. Higher scores indicate higher levels of satisfaction, and a cut-score of 97.5 has been validated in numerous studies to identify relationship distress (see Christensen et al., 2004). MAT. The MAT (Locke & Wallace, 1959) is a 15-item measure of satisfaction that uses a weighted scoring system. At an item level, 8 of the 15 items of the MAT are identical to those of the DAS and were not duplicated in the present survey. KMS. The KMS (Schumm et al., 1983) is a three-item measure that assesses satisfaction. The items were modified to be appropriate for dating relationships (e.g., “How satisfied are you with your marriage or partnership?” “How satisfied are you with your partner as a spouse or potential spouse?” and “How satisfied are you with your relationship with your partner?”) and were rated on 7-point Likert scales. QMI. The QMI (Norton, 1983) is a six-item measure of satisfaction, with higher scores indicating higher levels of satisfaction. The items assess global satisfaction (e.g., “We have a good relationship”) and are rated on 6- or 10-point Likert scales. RAS. The RAS (Hendrick, 1988) is a seven-item measure of global relationship satisfaction. The RAS items assess general satisfaction (e.g., “How much do you love your partner?”) and are rated on 5-point Likert scales. SMD. Karney and Bradbury (1997) developed a 15item measure of global relationship satisfaction using a semantic differential format. Thus, respondents were asked to rate their relationships on a series of 15 adjective pairs (e.g., bad– good, full– empty). Marital Status Inventory (MSI). The MSI (Weiss & Cerreto, 1980) is a 14-item scale used to assess behavioral steps taken toward divorce using a true/false response scale. The present study made use of the first 5 items of the scale (given their higher endorsement rates) as potential satisfaction items. To increase the information provided, the items were rated on a 6-point response scale ranging from never to all the time. The MSI demonstrated reasonable internal consistency, with a standardized Cronbach’s alpha of .92. Additional satisfaction items. An additional 71 satisfaction items were included: 25 items selected from less widely used measures of relationship satisfaction3 and 46 items written by the authors4 to increase the diversity of content in the item pool.
Measures of Anchor Scales From the Nomological Net Eros subscale of the Love Attitudes Scale (LAS). The Eros subscale of the LAS (Hendrick & Hendrick, 1986) is a seven-item measure of physical and emotional chemistry with a romantic partner. In the present study, the scale had reasonable internal consistency, with a Cronbach’s alpha of .88. Communication Patterns Questionnaire (CPQ-CC). The CPQ-CC (Heavey, Larson, Zumtobel, & Christensen, 1996) is a seven-item measure assessing couples’ communication. Rogge and Bradbury (1999) demonstrated that CPQ-CC scores were predictive of changes in satisfaction over the first 4 years of marriage. In the present study, the CPQ-CC demonstrated reasonable internal consistency, with a standardized Cronbach’s alpha of .84. Ineffective Arguing Inventory (IAI). The IAI (Kurdek, 1994) is an eight-item measure of communication in relationships. The items are worded at a general level (e.g., “Our arguments are left hanging and unresolved”) and are rated on a 6-point scale. Kurdek (1994) demonstrated strong associations between IAI scores and relationship satisfaction. In the present sample, the IAI demonstrated good internal consistency, with a standardized Cronbach’s alpha of .92. Marital Coping Inventory–Conflict subscale (MCI-C). In contrast to the globally worded items of the CPQ-CC and the IAI, the MCI-C (Bowman, 1990) is a 15-item measure assessing the frequency of specific hostile conflict behaviors (e.g., “I yell or shout at my partner”; “I nag”). Rogge and Bradbury (1999) demonstrated that the MCI-C is associated with changes in marital satisfaction over the first 4 years of marriage. The MCI-C demonstrated reasonable levels of internal consistency, with a standardized Cronbach’s alpha of .91. Eysenck’s Personality Questionnaire–Neuroticism subscale (EPQ-N). The EPQ-N (Eysenck & Eysenck, 1975) is a 23-item measure of general negativity. In the present study, the EPQ-N demonstrated good internal consistency, with a standardized alpha coefficient of .86. 3
The items were selected from the following scales: Rubin’s Love Scale (Rubin, 1970), the Rusbult Relationship Questionnaire (Rusbult, 1983), the Passionate Love Scale (Hatfield & Sprecher, 1986), the Davis-Todd Relationship Rating Scale (Davis & LattyMann, 1987), and Sternberg’s Triangular Love Scale (Sternberg, 1997). Items were selected on the basis of their previously reported psychometric properties as well as their brevity, clarity, and diversity of content. For example, the item “I have a warm and comfortable relationship with my partner” was an item taken from Sternberg’s Triangular Love Scale in order to increase the diversity of the item pool. 4 Thirty-five of these items were written from scratch, and 11 of these items were alternate versions of existing MAT and DAS items designed to improve their psychometric properties (by placing them on larger Likert scales) or to disentangle the information assessed in complex (confounded) items.
COUPLES SATISFACTION INDEX
Perceived Stress Scale (PSS). The PSS (Cohen, Karmarck, & Mermelstein, 1983) is a 14-item scale intended to assess participants’ perceptions of the subjective level of stress. Leonard and Roberts (1998) demonstrated that a composite variable containing the PSS was associated with changes in relationship satisfaction over the first year of marriage. In the present study, the PSS demonstrated reasonable internal consistency, with a standardized Cronbach’s alpha of .88. Personal Assessment Inventory (PAI) validity scales. Two validity scales from the PAI (Morey, 1991)—the 10item inconsistency subscale and the 8-item infrequency subscale—were used to help assess the quality of attention and effort respondents put into answering the survey questions. The inconsistent response scale was made up of five pairs of nearly identical items given at different points in the survey. The scale was scored by giving a point for each set of extremely contradictory answers (1 vs. 4 or 4 vs. 1), with a total score ranging from 0 to 5. The infrequent response scale was made up of eight items with such extreme distributions that 99% of respondents would provide the same one or two answers. The scale was scored by giving a point for each unlikely response, with a total score ranging from 0 to 8. In the present study, if a respondent had a score of 3 or higher on either scale, he or she was considered an invalid respondent (due to lack of attention or effort) and was omitted from subsequent analyses.
Data Cleaning Prior to data analysis, the data set was subjected to three main steps of data cleaning. First, 181 (2.8%) of the initial 6,389 respondents were identified as invalid, due to lack of effort or attention, using the PAI Inconsistency and Infrequency subscales. Second, 276 (4.4%) of the remaining responses were omitted for failing to complete 70% of the entire survey, and another 336 (5.4%) were deleted for leaving more than four satisfaction items blank. The incomplete responses demonstrated only minor demographic differences from the respondents retained.5 Finally, 281 (5.0%) of the remaining responses were identified as multivariate outliers, using Mahalanobis distances as outlined by Tabachnick and Fidell (2001)6 and demonstrated only minor demographic differences from the final sample.7 Ultimately, the data-cleaning process eliminated 1,074 respondents (16.8%), leaving a final sample of 5,315 participants.
Results IRT Assumptions and Model Evaluation A principal-components analysis (PCA) of the 69 items of the existing satisfaction measures produced a first eigenvalue (35.75) that was more than 10 times larger than the second eigenvalue (2.78), suggesting that the item set was sufficiently unidimensional. An interitem partial correlation matrix (covarying out the dominant satisfaction component) suggested that 66 of the items from the existing measures were sufficiently locally independent, meaning that they
575
were not excessively redundant with one another (as demonstrated by the fact that they did not continue to correlate when satisfaction variance was removed). However, the three items of the KMS were extremely redundant with one another by this test and were therefore dropped from subsequent analyses. To perform the IRT analyses, graded response model (GRM; Samejima, 1997) parameters for the resulting 66 satisfaction items were estimated simultaneously8 with Multilog 7.0 (Thissen, Chen, & Bock, 2002) using marginal maximum-likelihood estimation. To assess the quality of the model, we examined both residual and standardized residual plots for the 66 items (see Hambleton et al., 1991). As a set, these plots showed evidence of good fit.9 We also examined the stability of the item parameter estimates by developing separate models in subpopulations (random sample halves; men vs. women; married/engaged vs. dating) and found the item parameters to be highly stable (r ⫽ .99, across groups).
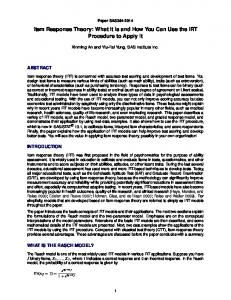
IRT Analysis of Existing Satisfaction Scales Figure 1 provides a range of IICs for items of the existing measures (plotted on a continuum of satisfaction from ⫺3 to 5 These respondents failed to demonstrate any differences from the subjects retained in the study on levels of satisfaction (MAT), levels of conflict, length of relationship, and neuroticism but tended to be somewhat less educated, F(1, 6156) ⫽ 10.4, p ⫽ .001, d ⫽ .13, had slightly lower incomes, F(1, 5321) ⫽ 7.08, p ⬍ .01, d ⫽ .14, were somewhat younger, F(1, 6132) ⫽ 7.08, p ⬍ .01, d ⫽ .11, and were slightly more likely to be non-Caucasian, 2(1, 5598) ⫽ 91.82, p ⬍ .001, ⌽ ⫽ .13, and male, 2(1, 6145) ⫽ 17.34, p ⬍ .001, ⌽ ⫽ .05. 6 Mahalanobis distances were calculated for each respondent on the basis of their scores on the 30 satisfaction and communication clusters described in the Results section. Given the large size of the data set, a threshold of p ⬍ .0001 was used to identify the participants whose responses were so markedly different from the central tendencies of the sample that their inclusion would have unduly distorted the multivariate findings. 7 These respondents failed to demonstrate any differences from the respondents retained on length of relationship, age, gender, or income but tended to be less educated, F(1, 5558) ⫽ 41.22, p ⬍ .001, d ⫽ .39, were less satisfied in their relationships, MAT F(1, 5590) ⫽ 240.45, p ⬍ .001, d ⫽ .90, were more negative, EPQ-N F(1, 5410) ⫽ 56.281, p ⬍ .001, d ⫽ .47, had slightly lower hostile conflict, F(1, 5791) ⫽ 7.85, p ⬍ .01, d ⫽ .14, and were slightly more likely to be non-Caucasian, 2(1, 5114) ⫽ 82.72, p ⬍ .001, ⌽ ⫽ .13. 8 Analyzing the items of all of the measures in a single analysis not only placed the item parameters of all the items onto the same scale, allowing for direct comparison between measures, but also helped to provide for a more stable IRT solution, as the 66 items provided more robust information to estimate individual subjects’ latent satisfaction scores than what could have been provided by smaller subsets of items (had the measures been analyzed separately). As the quality of the item parameter estimates is dependent on the quality of the latent satisfaction estimates, this strategy also served to improve the quality of the estimated item parameters. 9 To conserve space, these plots are not shown but are available from the authors on request.
Information
Information
Information
-1
0
1
2
Satisfaction (SD units)
-2
3
-3
-1
0
1
2
Satisfaction (SD units)
-2
3
0
1
2
3
4
0
1
2
3
4
-1
0
1
2
Satisfaction (SD units)
-2
3
-3
-1
0
1
2
Satisfaction (SD units)
-2
3
RAS-2 in general, how satisfied
-3
MAT-11 outside interests together
0
1
2
3
4
-3
DAS-31 overall happiness
DAS-2/MAT-3 agree on recreation
0
1
2
3
4
0
1
2
3
4
0
1
2
3
4
0
1
2
3
4
0
1
2
3
4
-1
0
1
2
Satisfaction (SD units)
-2
3
-1
0
1
2
Satisfaction (SD units)
-2
3
-1
0
1
2
Satisfaction (SD units)
-2
3
-3
-1
0
1
2
Satisfaction (SD units)
-2
3
RAS-6 how much do you love p.
-3
MAT-12 on-the-go / stay-at-home
-3
DAS/MAT-9 agree parents/in-laws
-3
DAS-18 feel things going well
-3
-1
0
1
2
Satisfaction (SD units)
-2
DAS-19 confide in mate
3
0
1
2
3
4
0
1
2
3
4
0
1
2
3
4
-1
0
1
2
Satisfaction (SD units)
-2
3
-1
0
1
2
Satisfaction (SD units)
-2
3
-3
-1
0
1
2
Satisfaction (SD units)
-2
3
SMD-11 enjoyable --- miserable
-3
QMI-1 have a good relationship
-3
DAS-15 agree on career decisions
0
1
2
3
4
0
1
2
3
4
0
1
2
3
4
0
1
2
3
4
0
1
2
3
4
-1
0
1
2
Satisfaction (SD units)
-2
3
-1
0
1
2
Satisfaction (SD units)
-2
3
-3
-3
0
1
2
-1
0
1
2
Satisfaction (SD units)
-2
SMD-1 boring --- interesting
-1
Satisfaction (SD units)
-2
3
3
QMI-5 part of a team with partner
-3
DAS-25 stim. exchange of ideas
-3
DAS-16 discuss/consider divorce
Figure 1. Item information curves for items from existing measures of satisfaction. DAS ⫽ Dyadic Adjustment Scale; MAT ⫽ Marital Adjustment Test; stim. ⫽ stimulating; QMI ⫽ Quality of Marriage Index; RAS ⫽ Relationship Assessment Scale; p. ⫽ partner; SMD ⫽ Semantic Differential.
Information
Information Information Information
Information
Information Information
Information Information
Information Information Information Information
576 FUNK AND ROGGE
COUPLES SATISFACTION INDEX
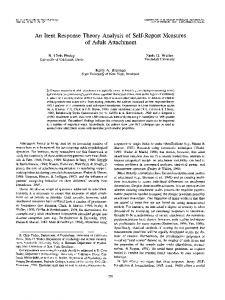
3 SDs from the mean). The globally worded items of the existing measures (e.g., DAS-31, RAS-2, and QMI-1) offered relatively high amounts of information for assessing satisfaction (having greater areas underneath their information curves). However, the existing scales also contain a large number of items offering markedly little information toward the assessment of relationship satisfaction, despite reasonably high item-to-total correlations with the sum of the 66 items (rtot ⫽ .42 to .72 for 9 of the 10 items in Figure 1 with lower ICCs). Not surprisingly, the item with the lowest item-to-total correlation (MAT-12, rtot ⫽ .20) offered the least information in the set. Shifting to a test-level analysis, the IICs were summed to create TICs for the existing measures of satisfaction. As shown in Figure 2A, the 15-item SMD contained the highest amount of information of all the measures assessed, even surpassing the 32-item DAS for all but the happiest respondents. Even the six-item QMI rivaled the information contributed by the DAS for all but the happiest respondents. The remaining shorter measures of satisfaction—RAS, DAS(4), and DAS(7)—provided either comparable or higher amounts of information than did the 15-item MAT. Thus, the two most widely used and cited measures of relationship satisfaction—the MAT and the DAS—fared rather poorly when compared directly with shorter global measures. It is also interesting to note that, for all measures (with the possible exception of the DAS), the amount of information provided sharply drops off at the highest levels of satisfaction. This is most likely due to a ceiling effect, as people with latent satisfaction greater than 1.5 SDs above the mean generally tend to have nearly perfect scores on these measures, reducing the ability of the measures to distinguish such couples from one another.
Creating a New Measure of Relationship Satisfaction To begin, we analyzed the properties of the 176 communication and satisfaction items in a PCA with the intent to extract a satisfaction and a communication factor, providing a tool to discriminate satisfaction items from the closely related construct of communication. To improve the distributions of the variables to be analyzed, we created three to eight item testlets of highly similar items (see Floyd & Widaman, 1995) using Ward’s (1963) cluster analysis. Specifically, we used a 30-cluster solution that provided highly parsimonious item partitioning, generating relatively small clusters of items with highly homogeneous content. The correlation matrix between these 30 clusters was then subjected to a PCA. The initial scree plot of the unrotated solution suggested two to three significant components, and so the analysis was repeated, extracting four factors. Given that the dimensions of satisfaction and communication could be expected to correlate, we used an oblique rotation strategy (oblimin with a delta of 0.0). After rotation, two dominant components emerged: a satisfaction component (eigenvalue1 ⫽ 67.4) and a hostile communication component (eigenvalue2 ⫽ 53.0; r12 ⫽ ⫺.48). To identify a set of unidimensional satisfaction items, we identified the 103
577
items that correlated at least .40 with the satisfaction component and that correlated more strongly with the satisfaction component than with the communication component. A number of items from the existing measures of satisfaction demonstrated patterns of association, suggesting that they either served as poor markers for the construct of satisfaction or were heavily confounded with variance from the construct of communication. As a result, 17 items from the existing measures of satisfaction were excluded from further analyses, including 13 items from the MAT and DAS. An interitem partial correlation matrix (covarying out the satisfaction component scores) on the remaining 103 items was used to identify excessively redundant item pairs (r ⫽ .4 or higher). For each set of redundant items, the item showing the strongest correlation with the satisfaction component was retained, resulting in a final item pool of 66 items for the IRT analyses. GRM item parameters were estimated for these final 66 satisfaction items. Residual and standardized residual plots for all of the items suggested a reasonable fit for the model (not shown), and the model demonstrated good stability across random sample halves, men respondents versus women respondents, and married/ engaged respondents versus dating respondents. IICs from the resulting model were evaluated using two criteria to select items for the final 32-item measure. We selected a majority of the items by identifying the items contributing the most information to the assessment of satisfaction. We also selected three slightly less informative items from the DAS (three agreement items), as they were some of the only items that provided information at the highest levels of relationship satisfaction. Unfortunately, the present item pool contained a limited number of items available to help enrich the assessment of relationship satisfaction in the upper range. When the 32 items of the Couples Satisfaction Index (CSI[32]) had been identified (see Appendix), the shorter versions of the measure were created by identifying the 16 and 4 CSI(32) items that provided the largest amount of information for the assessment of relationship satisfaction.
Precision and Power of the CSI Scales Figure 2B presents TICs comparing the CSI scales to the three existing measures of similar lengths. These TICs suggest that both the CSI(32) and the CSI(16) provide markedly greater amounts of information than do the existing measures for all but the highest levels of satisfaction. Even the CSI(4) contributes impressive amounts of information, surpassing the information contributed by the 15-item MAT and rivaling the information contributed by the DAS, despite having far fewer items. To further examine the increased precision afforded by the CSI scales, we grouped respondents into 20 groups based on their IRT-derived latent satisfaction scores. As the respondents in each of these groups have highly similar levels of satisfaction, any scatter in their satisfaction scores would be due largely to measurement error or “noise” in the scale being used. As shown in Figure 2C, the distributions of CSI(32) scores in each satisfaction group are not only tighter than are those
FUNK AND ROGGE
A)
60
SMD(15) QMI(6) DAS(32) RAS(7) MAT(15) DAS(7) DAS(4)
Information
50 40 30 20
B)
60
CSI(32) CSI(16) CSI(4) DAS(32) MAT(15) DAS(4)
50
Information
578
40 30 20 10
10
0
0 -3
-2
-1
0
1
2
-3
3
-2
-1
2.5 DAS 2
CSI(32)
1.5 1 0.5 0
2
3
4
5
6
7
8
9 10 11 12 13 14 15 16 17 18 19 20
Adjacent Satisfaction Group Contrasts
F) Effect Sizes (Cohen's d)
Effect Sizes (Cohen's d)
1
2
D)
C)
E)
0
Satisfaction (SD units)
Satisfaction (SD units)
2.5 MAT 2
CSI(16)
1.5 1 0.5 0
2
3
4
5
6
7
8
9 10 11 12 13 14 15 16 17 18 19 20
Adjacent Satisfaction Group Contrasts
Figure 2. Comparison of satisfaction scales on information, precision, and resulting power. SMD ⫽ Semantic Differential; QMI ⫽ Quality of Marriage Index; DAS ⫽ Dyadic Adjustment Scale; RAS ⫽ Relationship Assessment Scale; MAT ⫽ Marital Adjustment Test; CSI ⫽ Couples Satisfaction Index.
3
COUPLES SATISFACTION INDEX
shown for the DAS (containing less noise), but as a set, the distributions of CSI(32) scores do a better job of spanning the entire range of the measure than do the DAS distributions, offering a better range of discrimination at all levels of satisfaction. Similarly, the distributions of CSI(16) scores are more precise than are those of the MAT (see Figure 2D). To determine whether this increased precision of the CSI scales would translate to increased power for detecting subtle group differences, we calculated the effect sizes of each measure (Cohen’s d) for detecting differences between each satisfaction group and the satisfaction group just below it. As shown in Figure 2E, the CSI(32) offers markedly higher effect sizes than does the DAS across the entire range of satisfaction groups. Similarly, the CSI(16) offers notably higher effect sizes than does the MAT across the entire range of satisfaction (see Figure 2F). These results suggest that the CSI scales provide greater precision of measurement (lower levels of noise) and correspondingly higher levels of power for detecting differences than do the DAS and the MAT.
579
and the DAS, despite only nominal amounts of item overlap with those scales. Further, the CSI scales demonstrate patterns of association with anchors scales that are nearly identical to those seen with the existing measures of satisfaction, suggesting that the CSI scales offer researchers conceptual equivalents to the MAT and DAS, assessing the same construct with dramatically enhanced precision. In fact, the correlation matrices presented in Table 1 demonstrate a shortcoming of classical test theory, because at a test-level of analysis, the measures of satisfaction are virtually indiscernible from one another. Clearly all of the satisfaction scales, including the MAT and the DAS, are assessing the same construct and are able to produce nearly identical correlational results within the nomological net surrounding relationship satisfaction. However, the IRT results presented in Figure 2 tell a very different story. By carefully modeling each item’s performance at different levels of satisfaction, the IRT analyses revealed dramatic differences in the precision and power of measurement offered by the different satisfaction scales, providing compelling evidence for the superiority of the CSI scales.
Convergent and Construct Validity of the CSI Scales Discussion
As shown in Table 1, the CSI scales demonstrate excellent internal consistency. More important, the CSI scales demonstrated strong convergent validity with the existing measures of relationship satisfaction, showing appropriately strong correlations with those measures, even with the MAT
The present study used IRT to evaluate the quality of the information provided by a set of well-validated measures of relationship satisfaction. The results suggest that the present scales are not as informative or precise as they could be, as
Table 1 Psychometric Properties of the Satisfaction Scales Scale
Possible range M
SD
Distress ␣ cut score
1
2
3
4
5
6
7
8
9
10
11
— .86 .89 .85 .88 .89 .92 .92 .91
— .87 .84 .87 .88 .91 .90 .88
— .87 .91 .92 .94 .96 .93
— .88 .88 .90 .90 .89
— .92 .96 .95 .94
— .96 .98 .94
— .99 .97
— .97
—
Scale intercorrelations 1. 2. 3. 4. 5. 6. 7. 8. 9. 10. 11.
DAS(32) DAS(7) DAS(4) MAT(15) QMI(6) KMS(3) RAS(7) SMD(15) CSI(32) CSI(16) CSI(4)
0–151 112 20 0–36 25 5.7 0–21 16 3.9 0–158 111 30 0–39 29 9.5 0–18 14 4.2 0–35 26 6.5 0–75 58 17 0–161 121 32 0–81 61 17 0–21 16 4.7
.95 .84 .84 .88 .96 .97 .92 .98 .98 .98 .94
97.5 21.5 13.5 95.5 24.5 12.5 23.5 49.5 104.5 51.5 13.5
— .92 .88 .90 .85 .82 .86 .88 .91 .89 .87
— .82 .82 .81 .78 .81 .83 .87 .85 .84
Correlations with anchor scales Ineffective Arguing Inventory Marital Status Inventory CPQ–Positive Communication Perceived Stress Scale MCI–Hostile Conflict LAS–Sexual Chemistry (Eros) EPQ–Neuroticism
⫺.79 ⫺.72 ⫺.77 ⫺.76 ⫺.77 ⫺.72 ⫺.78 ⫺.81 ⫺.79 ⫺.80 ⫺.79 ⫺.74 ⫺.66 ⫺.77 ⫺.74 ⫺.75 ⫺.73 ⫺.78 ⫺.76 ⫺.78 ⫺.78 ⫺.75 .73 .66 .69 .68 .69 .65 .70 .72 .71 .71 .69 ⫺.52 ⫺.49 ⫺.51 ⫺.49 ⫺.51 ⫺.47 ⫺.52 ⫺.54 ⫺.52 ⫺.53 ⫺.52 ⫺.54 ⫺.45 ⫺.48 ⫺.49 ⫺.46 ⫺.43 ⫺.50 ⫺.50 ⫺.48 ⫺.49 ⫺.47 .42 .38 .39 .41 .39 .39 .42 .41 .45 .43 .41 ⫺.40 ⫺.36 ⫺.37 ⫺.38 ⫺.37 ⫺.34 ⫺.37 ⫺.40 ⫺.38 ⫺.38 ⫺.36
Note. Distress cut-scores were calculated with response-operating curves to optimize the sensitivity and specificity of each measure to accurately classify the 1,092 respondents falling below the well-validated DAS distress cut-score of 97.5. All correlations presented are significant at the p ⬍ .001 level. DAS ⫽ Dyadic Adjustment Scale, MAT ⫽ Marital Adjustment Test; QMI ⫽ Quality of Marriage Index; RAS ⫽ Relationship Assessment Scale; KMS ⫽ Kansas Marital Satisfaction Scale; SMD ⫽ Semantic Differential; CSI ⫽ Couples Satisfaction Index; CPQ ⫽ Communication Patterns Questionnaire; LAS ⫽ Love Attitudes Scale; EPQ ⫽ Eysenck’s Personality Questionnaire.
580
FUNK AND ROGGE
they contain a large number of items that contribute mostly error variance to the assessment of relationship satisfaction. Taking a systematic approach to this problem, we conducted PCA and IRT analyses on a large and diverse pool of potential satisfaction items, actively reducing contaminating variance and redundancy in the item pool and selecting items offering the greatest precision in assessing satisfaction, to create a new set of satisfaction measures: the CSI scales. These scales were shown to offer markedly increased precision and power in assessing relationship satisfaction over the existing measures while retaining strong convergent and construct validity with those measures.
Implications The results presented here suggest that the two most widely used measures of relationship satisfaction—the MAT and the DAS— contain surprisingly low amounts of information and relatively high levels of measurement error or noise, particularly for their respective lengths. Thus, the bulk of the relationship and marital literature is based on measures containing notably high levels of error variance or noise. That said, there is little doubt (and a massive body of literature indicating) that the MAT and DAS do in fact assess relationship satisfaction and do so well enough to reveal meaningful associations with other variables. The present results qualify that validity by revealing that the existing measures assess relationship satisfaction in a notably imprecise manner. Thus, although they do assess satisfaction, the noise inherent in those measures would markedly reduce their power for detecting differences in satisfaction between groups and might even reduce their power for detecting change in satisfaction over time. The increased precision of the CSI scales offers researchers a method of drastically reducing that measurement error and increasing power without increasing the length of assessment. This is of critical importance, as the results presented here would suggest that using the MAT and DAS in marital studies would be the equivalent of doing a series of studies on fevers and treatments for fevers using thermometers that only read temperatures in 5° or 10° intervals, whereas the CSI scales would offer accuracies equivalent to 1° or 2° increments, making it significantly easier to detect meaningful effects. Thus, by switching to the CSI scales, researchers should be able to detect meaningful differences between groups and relationships between variables in smaller samples, as the CSI scales provide greater power in all samples. The PCA results also suggest that the MAT and DAS contain a number of communication items. This is of particular concern in marital treatment studies, as it would contaminate outcome variables (satisfaction) with part of the manipulated variables (communication skills), thereby running the risk of spuriously inflating the results. The CSI scales were designed to offer methods of assessing satisfaction relatively free from contaminating communication variance by rigorously screening and eliminating communication items from the item pool.
Future Directions In future studies, it will be useful to examine how the CSI scales operate over time by determining the predictive validity of the CSI scales for identifying future relationship discord and assessing the scales’ sensitivity to detecting change in satisfaction over time. It will also be important for future studies to more closely examine the consistency of CSI item functioning across subgroups of participants (e.g., dating vs. engaged/married, Caucasian vs. non-Caucasian, male vs. female) to determine whether any differential item functioning exists. It is possible that specific items of the CSI may be more or less informative for certain subgroups of participants, and knowing those biases would aid in the appropriate interpretation of CSI scores for all groups. Finally, although the CSI scales offer precise and efficient methods of assessing satisfaction, their performance drops notably at the high end of satisfaction. It is unclear whether this finding is a limitation of the item pool (not containing items assessing satisfaction in that range) or whether this reflects a true substantive finding in the assessment of relationship satisfaction, suggesting that the highest levels of satisfaction might represent a heterogeneous phenomenon. Although couples might experience distress in similar manners, it may be that couples find extreme happiness in different ways, making it more difficult to assess that region of satisfaction across all couples. To address this issue, future studies should enrich their item pools with items designed to specifically target couples at the highest levels of satisfaction.
Limitations Despite the robust findings supporting the efficacy and validity of the CSI scales, the interpretation of these results is qualified by some limitations. To begin, the study was conducted entirely online. Although this provided a highly efficient and cost-effective method of amassing the large sample necessary for IRT analyses, it also allows for potentially spurious responses. To address this issue, we used stringent criteria for completeness of responses, attention/ effort exerted, and multivariate normality before running any analyses. A second concern with collecting data online is that participation requires a computer and access to the internet, possibly filtering out respondents of the lowest socioeconomic backgrounds. Future studies examining the CSI should strive to include a more diverse subject pool. A third important limitation is that the study was crosssectional, preventing the assessment of the operation of the CSI scales over time. Future studies on the CSI scales should make use of longitudinal designs to extend their validation. A fourth limitation of the present study is that only one member of each dyad participated in the study, prohibiting analyses examining the level of agreement of partners’ satisfaction. Future studies will need to examine the CSI scales within dyads in order to fully examine the dependency of that data. Despite these limitations, we feel the results presented here provide critical information on the shortcomings of the present measures of satisfaction exam-
COUPLES SATISFACTION INDEX
ined and provide considerable support for the use of the CSI scales as optimized measures of relationship satisfaction.
References Bowman, M. L. (1990). Coping efforts and marital satisfaction: Measuring marital coping and its correlates. Journal of Marriage and the Family, 52, 463– 474. Bradbury, T. N., Fincham, F. D., & Beach, S. R. H. (2000). Research on the nature and determinants of marital satisfaction: A decade in review. Journal of Marriage and the Family, 62, 964 –980. Christensen, A., Atkins, D. C., Berns, S., Wheeler, J., Baucom, D. H., & Simpson, L. E. (2004). Traditional versus integrative behavioral couple therapy for significantly and chronically distressed married couples. Journal of Consulting and Clinical Psychology, 72, 176 –191. Cohen, S., Karmarck, T., & Mermelstein, R. (1983). A global measure of perceived stress. Journal of Health and Social Behavior, 24, 385–396. Davila, J., Karney, B. R., Hall, T. W., & Bradbury, T. N. (2003). Depressive symptoms and marital satisfaction: Within-subject associations and the moderating effects of gender and neuroticism. Journal of Family Psychology, 17, 557–570. Davis, K. E., & Latty-Mann, H. (1987). Love styles and relationship quality: A contribution to validation. Journal of Social and Personal Relationships, 4, 409 – 428. Eysenck, H. J., & Eysenck, S. B. G. (1975). The Eysenck Personality Questionnaire manual. London: Hodder & Stoughton. Fincham, F. D., & Bradbury, T. N. (1987). The assessment of marital quality: A reevaluation. Journal of Marriage and the Family, 49, 797– 809. Floyd, F. J., & Widaman, K. F. (1995). Factor analysis in the development and refinement of clinical assessment instruments. Psychological Assessment, 7, 286 –299. Hambleton, R. K., Swaminathan, H., & Rogers, H. J. (1991). Fundamentals of item response theory. Newbury Park, CA: Sage. Hatfield, E., & Sprecher, S. (1986). Measuring passionate love in intimate relationships. Journal of Adolescence, 9, 383– 410. Heavey, C. L., Larson, B., Zumtobel, D. C., & Christensen, A. (1996). The Communication Patterns Questionnaire: The reliability and validity of a constructive communication subscale. Journal of Marriage and the Family, 58, 796 – 800. Hendrick, S. S. (1988). A generic measure of relationship satisfaction. Journal of Marriage and the Family, 50, 93–98. Hendrick, S. S., & Hendrick, C. (1986). A theory and method of love. Journal of Personality and Social Psychology, 50, 392– 402. Heyman, R. E., Sayers, S. L., & Bellack, A. S. (1994). Global satisfaction versus marital adjustment: An empirical comparison of three measures. Journal of Family Psychology, 8, 432– 446. Johnson, M. D., & Bradbury, T. N. (1999). Marital satisfaction and topographical assessment of marital interaction: A longitudinal analysis of newlywed couples. Personal Relationships, 6, 19 – 40. Karney, B. R., & Bradbury, T. N. (1997). Neuroticism, marital interaction, and the trajectory of marital satisfaction. Journal of Personality and Social Psychology, 72, 1075–1092.
581
Kurdek, L. A. (1994). Conflict resolution styles in gay, lesbian, heterosexual nonparent, and heterosexual parent couples. Journal of Marriage and the Family, 56, 705–722. Leonard, K. E., & Roberts, L. J. (1998). Marital aggression, quality, and stability in the first year of marriage: Findings from the Buffalo newlywed study. In T. N. Bradbury (Ed.), The developmental course of marital dysfunction (pp. 44 –73). New York: Cambridge University Press. Locke, H. J., & Wallace, K. M. (1959). Short marital adjustment and prediction tests: Their reliability and validity. Marriage and Family Living, 21, 251–255. Morey, L. C. (1991). Personality Assessment Inventory professional manual. Odessa, FL: Psychological Assessment Resources. Norton, R. (1983). Measuring marital quality: A critical look at the dependent variable. Journal of Marriage and the Family, 45,141–151. Rogge, R. D., & Bradbury, T. N. (1999). Till violence does us part: The differing roles of communication and aggression in predicting adverse marital outcomes. Journal of Consulting and Clinical Psychology, 67, 340 –351. Rubin, Z. (1970). Measurement of romantic love. Journal of Personality and Social Psychology, 16, 265–273. Rusbult, C. E. (1983). A longitudinal test of the investment model: The development (and deterioration) of satisfaction and commitment in heterosexual involvements. Journal of Personality and Social Psychology, 45, 101–117. Sabourin, S., Valois, P., & Lussier, Y. (2005). Development and validation of a brief version of the dyadic adjustment scale with a nonparametric item analysis model. Psychological Assessment, 17, 15–27. Samejima, F. (1997). Graded response model. In W. J. van der Linden & R. K. Hambleton (Eds.), Handbook of modern item response theory (pp. 85–100). New York: Springer. Schumm, W. A., Nichols, C. W., Schectman, K. L., & Grinsby, C. C. (1983). Characteristics of responses to the Kansas Marital Satisfaction Scale by a sample of 84 married mothers. Psychological Reports, 53, 567–572. Sharpley, C. F., & Cross, D. G. (1982). A psychometric evaluation of the Spanier Dyadic Adjustment Scale. Journal of Marriage and the Family, 44, 739 –741. Spanier, G. B. (1976). Measuring dyadic adjustment: New scales for assessing the quality of marriage and similar dyads. Journal of Marriage and the Family, 38, 15–28. Sternberg, R. J. (1997). Construct validation of a triangular love scale. European Journal of Social Psychology, 27, 313–335. Tabachnick, B. G., & Fidell, L. S. (2001). Using multivariate statistics (4th ed.). Boston: Allyn & Bacon. Thissen, D., Chen, W. H., & Bock, D. (2002). Multilog user’s guide: Multiple, categorical item and test scoring using item response theory (Version 7.0) [Computer software]. Lincolnwood, IL: Scientific Software International. Ward, H. J. (1963). Hierarchical grouping to optimize an objective function. Journal of the American Statistical Association, 58, 236 –244. Weiss, R. L., & Cerreto, M. C. (1980). The Marital Status Inventory: Development of a measure of dissolution potential. American Journal of Family Therapy, 8, 80 – 85.
(Appendix follows)
582
FUNK AND ROGGE
Appendix Couples Satisfaction Index Note. CSI(4) is made up of items 1, 12, 19, and 22. CSI(16) is made up of items 1, 5, 9, 11, 12, 17, 19, 20, 21, 22, 26, 27, 28, 30, 31, and 32. 1. Please indicate the degree of happiness, all things considered, of your relationship. Extremely Fairly A Little Unhappy Unhappy Unhappy 0 1 2
Happy 3
Very Happy 4
Extremely Happy 5
Perfect 6
Most people have disagreements in their relationships. Please indicate below the approximate extent of agreement or disagreement between you and your partner for each item on the following list.
2. Amount of time spent together 3. Making major decisions 4. Demonstrations of affection
5. In general, how often do you think that things between you and your partner are going well? 6. How often do you wish you hadn’t gotten into this relationship?
7. I still feel a strong connection with my partner 8. If I had my life to live over, I would marry (or live with/date) the same person 9. Our relationship is strong 10. I sometimes wonder if there is someone else out there for me 11. My relationship with my partner makes me happy 12. I have a warm and comfortable relationship with my partner 13. I can’t imagine ending my relationship with my partner 14. I feel that I can confide in my partner about virtually anything 15. I have had second thoughts about this relationship recently 16. For me, my partner is the perfect romantic partner 17. I really feel like part of a team with my partner 18. I cannot imagine another person making me as happy as my partner does
19. How rewarding is your relationship with your partner?
Always Agree 5 5 5
Almost Always Occasionally Agree Disagree 4 3 4 3 4 3
Almost Always Disagree 1 1 1
Always Disagree 0 0 0
All the time
Most of the time
Rarely
Never
5
4
3
2
1
0
0
1
2
3
4
5
Not at all True
A little True
Somewhat True
Mostly True
0
1
2
3
4
5
0 0
1 1
2 2
3 3
4 4
5 5
5
4
3
2
1
0
0
1
2
3
4
5
0
1
2
3
4
5
0
1
2
3
4
5
0
1
2
3
4
5
5
4
3
2
1
0
0
1
2
3
4
5
0
1
2
3
4
5
0
1
2
3
4
5
Not at all
A little
Somewhat
Mostly
0
1
2
3
Frequently Disagree 2 2 2
More often than not Occasionally
Almost Completely Completely True True
Almost Completely Completely 4
5
COUPLES SATISFACTION INDEX
583
Appendix (continued) 20. How well does your partner meet your needs? 21. To what extent has your relationship met your original expectations? 22. In general, how satisfied are you with your relationship?
0
1
2
3
4
5
0
1
2
3
4
5
0
1
2
3
4
5
Worse than all others (Extremely bad) 23. How good is your relationship compared to most?
24. Do you enjoy your partner’s company? 25. How often do you and your partner have fun together?
Better than all others (Extremely good)
0
1
2
3
4
5
Never
Less than once a month
Once or twice a month
Once or twice a week
Once a day
More often
0
1
2
3
4
5
0
1
2
3
4
5
For each of the following items, select the answer that best describes how you feel about your relationship. Base your responses on your first impressions and immediate feelings about the item. 26. 27. 28. 29. 30. 31. 32.
INTERESTING BAD FULL LONELY STURDY DISCOURAGING ENJOYABLE
5 0 5 0 5 0 5
4 1 4 1 4 1 4
3 2 3 2 3 2 3
2 3 2 3 2 3 2
1 4 1 4 1 4 1
0 5 0 5 0 5 0
BORING GOOD EMPTY FRIENDLY FRAGILE HOPEFUL MISERABLE
Received July 25, 2006 Revision received November 24, 2006 Accepted November 27, 2006
䡲


![[PDF] Download Item Response Theory - Google Sites](https://m.moam.info/img/260x300/pdf-download-item-response-theory-google-sites_6478ad92097c474c228d661c.jpg)


