Hunt et al., J Account Mark 2015, 4:1 http://dx.doi.or/10.4172/2168-9601.1000122
Accounting & Marketing Research Article
Open Access
Introducing the Semantic Organization Model for the Assessment of Social Media: Accuracy and Relevance of On-line Reviews James Hunt1, Wooyang Kim2 and Richard A Lancioni3* Associate Professor of Marketing and Supply Chain Management, Temple University, Philadelphia, USA Research Associate, Temple University, Philadelphia, USA 3 Professor of Marketing and Supply Chain Management, Temple University, Philadelphia, USA 1 2
Abstract The Semantic Organization Model (SOM) relates on-line communication efforts to realized brand position, focusing on consumers’ social media actions as evidenced by their real time on-line behavior. As such, the model employs an actionable framework from which marketers can diagnose positioning problems and take profitable actions. As well, the model guides strategic managerial planning effort on the basis of on-line social activity. In this article, we present a model that purports to explain how consumers’ existing semantic structure guides their interpretation of on-line reviews, posts, and other comments. In addition, we discuss how consumer connection to such communications can be represented in the form of what we refer to as endurance scores.
Keywords: Semantic; Social media; On-line; Product attributes; Perceptual orientation; Perseverance scores; Repertory grids
Introduction The Semantic Organization Model (SOM) relates communication efforts to realized brand position, focusing on consumers’ social media experience as evidenced by their real time on-line behavior. As such, the model employs an actionable framework from which marketers can diagnose positioning problems and take profitable actions. Although a great deal of literature exists regarding consumers’ on-line behavior, little implicates the semantic nature of that behavior [1]. On-line posts, reviews, site visitations, etc. are among the many behavioral metrics used by those interested in assessing the effectiveness of strategy. Thus, managers typically have access to large data bases containing information about consumers’ on-line behavior, but, they face a dearth of information that links such data bases to key motivational elements, those thought to spark purchase evaluations and choice. Both choice and on-line behavior frequently serve as bases for managerial evaluation – i.e., managers are frequently evaluated in terms of sales and post-purchase buzz—insofar as they marshal quantitative results and actionable goals. Seldom are managers held accountable for processes that mediate that behavior. Instead, more concrete concepts usually dominate their evaluations – e.g., number of posts, views, sales volume, etc. The purpose of this paper is to present a model, based on individual semantic organization that links consumers’ on-line behavior to their values and motivation. Assessing the effectiveness of strategy on the basis of consumers’ on-line behavior requires marketing decision makers not only to estimate the effect of that behavior, but also to develop an attendant set of metrics. Surprisingly, little work has been done along these lines. That is, measuring the emotional value of consumer responses made in the e-forum of social media demands new, if not innovative, measures. The work presented here proposes to do just that. The researchers develop a framework that integrates well known theory regarding cognition with research on values and emotions. Specifically, the research work is built on the notion that products and brands can be thought of at different levels of abstraction [2] and that the hierarchy is typically reflected by communication in various social media messages such as reviews and posts. Thus, we propose that any assessment of social media strategy must establish a link between communication vehicles and deeper levels of meaning J Account Mark ISSN: 2168-9601 JAMK, an open access journal
and motivation. We discuss below how the construction of brands at multiple levels of abstraction implicates consumer choices as well as their engagement with those brands. In addition to detailing the nature of our hierarchical framework, we describe methodological aspects pertinent to the measurement of that framework and its motivational basis. The primary method used to assess social media communication is an administered questionnaire, although implicit memory tests would be apropos in many instances. The key output measure of our methodology is an “endurance score,” which reflects the organization of individuals’ memory structure and resulting tie to brand.
The Role of Semantic Structure in Marketing Communication Semantic structure can be construed in a number of ways [3] but it is probably most useful to view the concept through the perspective developed by [4]. This perspective, known as a Means-End approach views communication as having an effect on consumers through a hierarchical structure anchored by product/brand features at one end and motivating values at the other. For instance, a toothpaste ad may link fluoride (feature) to decay avoidance outcome), which, in turn, may result in feelings of enhanced social well-being and health (motivating values). That is, a feature-value relationship is established in memory and addressable through communication and various other marketing stimuli. If so, any attempt on the part of marketers to measure complex communication effects must include relational metrics relating features to outcomes and values. The generalized framework presented here is an attempt to do just that in the realm of social media. More specifically, the researchers focus on the on-line reviews consumers publish in response to product and service experiences.
*Corresponding author: Richard A Lancioni, Professor of Marketing and Supply Chain Management, Temple University, Philadelphia, USA, E-mail:
[email protected] Received December 12, 2014; Accepted February 05, 2015; Published February 12, 2015 Citation: Hunt J, Kim W, Lancioni RA (2015) Introducing the Semantic Organization Model for the Assessment of Social Media: Accuracy and Relevance of On-line Reviews. J Account Mark 4: 122. doi:10.4172/2168-9601.1000122 Copyright: © 2015 Hunt J, et al. This is an open-access article distributed under the terms of the Creative Commons Attribution License, which permits unrestricted use, distribution, and reproduction in any medium, provided the original author and source are credited.
Volume 4 • Issue 1 • 1000122
Citation: Hunt J, Kim W, Lancioni RA (2015) Introducing the Semantic Organization Model for the Assessment of Social Media: Accuracy and Relevance of On-line Reviews. J Account Mark 4: 122. doi:10.4172/2168-9601.1000122
Page 2 of 6 The notion that product/ brand features mediate values is not new [5] first proposed that individual beliefs, which exist at different of abstraction, formed the underpinning of attitudes At the most concrete level are beliefs pertaining to product attributes; at the most abstract level are those related to global values. Presumably, the former are less centrally held, while the latter are more centrally held and are semantically closer to the self. Given that elements at different levels are frequently related to one another, a value orientation can be established which, can be represented in what [6] refer to as a hierarchical values map, but, more importantly, exploited by marketing strategy. For instance, marketers might initially frame a car offering in terms of the environment, say by mountain scenery, and then follow that prime with information regarding the fuel efficiency and emission control of their particular brand offering. Presumably, this frame would enhance attention to and importance of the more concrete attributelevel information thereby producing a perceptual orientation anchored by an abstract environmental perspective – as [6] note a perceptual orientation entails a unique attribute-consequence-value combination. Based on the work we offer the following propositions to delineate the calculus that underpins what the authors refer to means-end theory. • The importance of a product attribute/consequence is directly related to the degree to which it mediates a given value/ facilitates goal accomplishment. • The importance of a product attribute/benefit is directly related to the degree of importance placed on the goal/value it mediates. • The importance of a particular brand is directly related to its ability to mediate desired /benefits and, therefore, values/goals. Thus, to uncover the perceptual orientation of any segment, or groups of consumers, a multilevel analysis must be performed, first, identifying key attributes, then defining the more abstract consequences and motivations that are mediated by those attributes. The first issue typically involves methodologies such as multidimensional scaling or qualitative studies (depth interviews and focus groups), the second, laddering techniques along with focus group research. The above framework is generalizable to a vast array of communication vehicles such as advertising and, more generally, promotion. It also would replicate that suggested by [2]. We attempt to employ it in the analysis STEP 1
of social media, more specifically, to assess the evaluative effects of on-line reviews. Below, we discuss our method and theoretical implications. The following steps are aimed at uncovering consumers’ perceptual orientations as well as estimating the degree to which those orientations are communicated in existing on-line reviews. The general process follows the pioneering work of [4] which is a comprehensive expose of the means-end perspective (Table 1).
Brand Resonance, Perceived Reinforcement Sensitivity, and Brand Endurance Historically, consumer behavior has widely been explained by a normative perspective (e.g., an absoluteness) [7]. That is, the normative perspective assumes all people are equality rational to achieve an decisional maximization, resulting in a dominant problem that overlooks a phenotypic nature of human being [8]. This normative proposition is limited to elucidate consumer behavior in our daily life although it contribute implication in decision studies. To be more realistic for the explanation of consumer behavior, we propose an ecological perspective that those signals consider as the phenotypic signals that allow accumulated individual’s experiences to adapt an immediate decisional environment (e.g., relativistic optimization). Those behavioral signals are based on consumer minds relying on an individual consumer’s experience and an immediate environment [9,10]. Our viewpoint is based on that a human is an organismic animal rather than a machinery calculator [11]. In the early age, an organismic theory introduces and underscores a holistic viewpoint of psychological factors to explain human behavior through an individual’s developmental tendency in response to her/his surroundings (e.g., an individual’s inherent experience on the basis of agent-situation interaction) [12]. From the organismic perspective, the behavioral tendency in relation to marketing activities is likely to base on the -eigen-experience of purchasing commodity and service, which is an adaptive structure of the interaction between an individual and his/her surroundings. Thus, we adopt organismic theory to explain the consumers’ decision making, which are based on individual’s eigenexperience of purchasing specific brands [13,14]. In our model, we will emphasize two influential properties on the brand resonance to investigate an attitudinal propensity regarding a particular brand. The two properties are perceived reinforcement sensitivity and endurance score. In addition to the two properties, we also add a possible bias
Obtain the product dimensionality (MDS or Repertory grid). This will involve a small convenience sample of individuals who are representative of the target market.
As noted above, this stage in our method entails identifying product features that consumers utilize to evaluate and select various decision alternatives (usually from a set of brands). Various procedures can be employed for this purpose –i.e., multidimensional scaling (Hair, Black, Babin, Anderson, and Tatham, 2006; Reynolds and Olson, 2001a), repertory grid procedures, laddering, focus group interviews, administered questionnaires, or depth interviews. In agreement with Reynolds and Olson, we employ laddering techniques because it leads directly to deeper values, relating product features to outcomes and outcomes to more abstract motivations. Thus, at this stage, laddering recruits a set of key distinguishing (diagnostic) features that forms the basis of a hierarchy anchored by core motivating values. STEP 2
Determine the links from dimensions to deeper values. Here several focus groups interviews should be undertaken in addition to information gleaned from personal interviews.
Thus, after determining the importance of the various product features discussed above, the next step requires those features be linked to important consequences and, in turn, more abstract values that underpin consumers’ decisions. This task is the province of laddering techniques (Reynolds and Gutman, 2001) and generally results in unified memory structures, which are referred to as perceptual orientations. For instance, friendly restaurant service might translate into a feeling of relaxation, and, therefore greater self-confidence, reflecting an individual perceptual orientation. STEP 3
Obtain posts and reviews. This would require internet search. Also, these would have to be reproduced for analyses.
Once relevant perceptual orientations are identified, they can be used to assess the semantic meaning of a set of reviews/posts randomly selected from social sites such as Google, Open Table, and Yelp. Each post becomes an independent unit of analysis. STEP 4
Submit posts and reviews to analyses with a representative sample. Here, the character of each post is reviewed at all 3 levels – the attribute level, the outcome level, and the deep values level.
Individual posts are presented to a pool of respondents that represent the target audience of interested recipients of the posts/reviews under review. This is carried out STEP 5
Calculate positive endurance scores.
STEP 6
Correlate endurance scores to intention scores and sales. Table 1: The General Process of Uncovering Consumers’ Perceptual Orientations.
J Account Mark ISSN: 2168-9601 JAMK, an open access journal
Volume 4 • Issue 1 • 1000122
Citation: Hunt J, Kim W, Lancioni RA (2015) Introducing the Semantic Organization Model for the Assessment of Social Media: Accuracy and Relevance of On-line Reviews. J Account Mark 4: 122. doi:10.4172/2168-9601.1000122
Page 3 of 6 in measurement in order to explicate precise behavioral propensities. Therefore, we proffer theoretical backgrounds of those behavioral properties and a methodological procedure. We describe the explained variable (brand resonance) and the explaining variables (perceived reinforcement sensitivity, endurance score, and a measurement bias) in our model, respectively.
Brand resonance Brand resonance (BR) is an overall value for evaluating a particular brand in decision making, based on the perception of consumers. To attain brand resonance, the explained variable consists of three parameters: perceived reinforcement sensitivity (s), endurance scores (ES), and measurement bias (b). To assess our model, we use a log-log formulation to estimate a relative change of the relationship between explanans and explanandum. Based on the log-log relationship, a simplified our model appears in Equation [1]. BR=s × ES + b (1)
Perceived reinforcement sensitivity Economics and marketing literature has been emphasized three behavioral signals on consumer behavior to examine the propensity of purchase decisions – purchase frequency, brand preference, and price sensitivity. According to [15] purchase frequency is highly interrelated to price sensitivity and brand preference using household panel data, and they suggested that consumers who frequently purchase a product are more price sensitive and they prefer well-known brands (i.e., nationwide brands). Particularly, the three signals interactively influence each other to determine an item choice, suggesting that those signals should simultaneously consider to measure the behavioral propensity of selecting a particular goods and service [16-23]. Therefore, we call the three signals as reinforced purchase frequency (F), reinforced brand preference (P), and reinforced price sensitivity (S), respectively (for questions in each signal, see Appendix I). We assume that these signals do not include “zero” because a consumer, by definition, is a person who consumes a commodity or service, entailing any experience of consumption. The procedure of computation is the following. First, we obtain the reinforced score of each behavioral signal, combine the three signals, and then get an average score of the signals at an individual level. The average score indicates a consumer’s behavioral tendency in perceptual intention to stimulate a purchasing interest about a category of a particular product or service. This integrated score calls as reinforced signal (RS) as described in equation [2]. F +P +S (2) Reinforced Signal (RSi) = i i i a Where, i=individual consumer; Fi=individual’s reinforced purchase frequency, 1 ≤ Fi ≤ 100 Pi=individual’s reinforced brand preference, 1 ≤ Pi ≤ 100 Si=individual’s reinforced price sensitivity, 1 ≤ Si ≤ 100 ∴ 1 ≤ RSi ≤ 100 Second, we aggregate an individual score of RS and then convert the score ranged from 0.1 to 10 and transform the score to a logarithmic score in order for stabilizing variance. Then, as sensitive scores, these stabilized scales lie in establishing a logarithmic range from −1 to 1 (0=insensitive and ±1=sensitive). The reason is that consumers behavior involved emotional stimulations does not have a linear relationship as a perceived risk, particularly when they valuate an object in choice [24]. J Account Mark ISSN: 2168-9601 JAMK, an open access journal
This non-linear tendency of consumer behavior has been common in explaining accurate behavioral tendencies [25-27]. The aggregated logarithmic score of RS is a grand mean of logarithmic RS score, representing a sensitivity of perceived reinforcement in consumer decision making in relation to an overall interest regarding a category of a particular product or service. Then, this average score transform logarithmic scores to account for the level of perceived difference regarding reinforcement of behavior, named perceived reinforcement sensitivity (s) as described in equation [3].
Σni=1PR i (3) n
Perceived Reinforcement Sensitivity (s)=log Where, i=individual consumer; n=total number of sample ∴ −1 ≤ s ≤ 1
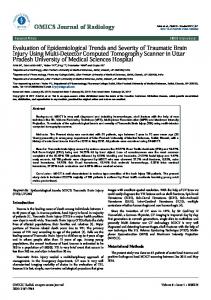
The ideal result for a simulation regarding PRS is drawn in Figure 1. Ideally, a stimulated zone is the zone that consumer’s perceived reinforcement regarding an interest of product or service occurs to facilitate a purchasing possibility while an unstimulated zone is the zone that the reinforcement does not occurs. In addition, a coexistent zone is the zone that consumers feel hesitation of minds from past experiences, reminding Janus who has two faces presiding the beginning and ending of conflict. The range is ideally located between .5797 and .6748 (i.e., RS scores: 39 to 47 where the range of converted RS scores is from 3.9 to 4.7 applying in equation [3]) (Figure 1).
Endurance scores In association with the perceived reinforcement sensitivity, we consider three characteristics according to the given information in posts (e.g., review) so as to examine how much a consumer engages in the given post, resulting in determining the level of endurance for switching a particular brand (i.e., how much a consumer endure a brand switching with no consideration of another brand). We call this as endurance score (ES) and ES consisted of three characteristics: 1) the level of communication (C) – how much communicative or noncommunicative to the given information; 2) attitudinal valence (V) – good or bad to the given information, and 3) the degree of importance (I) – how much important or unimportant to the given information. We combine these values as an aggregated value and then transform the values to logarithmic values to represent a relative ratio, indicating a relative usefulness of the post in association with each characteristics to endure in purchasing decision (for questions, see Appendix II). Σ n C Σ n V Σ n I n n n
i i 1= i i 1 i log i 1 = Endurance Score (ES) == + + (4)
Where, i=individual consumer n=total number of sample
Ci=individual’s level of communication, 1 ≤ Ci ≤ 100 Vi=individual’s level of communication, 1 ≤ Vi ≤ 100 Ii=individual’s level of communication, 1 ≤ Ii ≤ 100 ∴ 0 ≤ ES ≤ 2 The logarithmic function of ES movement is depicted in Figure 2, ranging between zero to two.
Measure of bias Based on the matching law suggested by Baum, we add a parameter of a measurement bias (b) that is associated with a possible experiment
Volume 4 • Issue 1 • 1000122
Citation: Hunt J, Kim W, Lancioni RA (2015) Introducing the Semantic Organization Model for the Assessment of Social Media: Accuracy and Relevance of On-line Reviews. J Account Mark 4: 122. doi:10.4172/2168-9601.1000122
Page 4 of 6
1 0.9 0.8 0.7 0.6 0.5 0.4 0.3 0.2 0.1 (s) 0 -0.1 -0.2 -0.3 -0.4 -0.5 -0.6 -0.7 -0.8 -0.9 -1
0.1
0.6
1.1 1.6
2.1 2.6
3.1
Stimulated
3.6
4.1
4.6 5.1
Coexistence
5.6
6.1 6.6
Unstimulated
7.1
7.6
8.1 8.6
LCL
9.1 9.6 10.0 (scale)
UCL
Note: Black-colored line=stimulated zone; grey-colored line=unstimulated zone; dotted-line=coexistence of stimulation and unstimulation (range: .5797 to .6748); LCL=lower coexistence limit; and UNL=upper coexistence limit Figure 1: The movement of perceived reinforcement sensitivity.
2 1.8 1.6 1.4 1.2 (ES) 1 0.8 0.6 0.4 0.2 0
1
6
11
16
21 26
31
36
41
46
51
56
61
66
71
76
81
86
91
96 100 (Scale)
ES Movement
Figure 2: The movement ofendurance score.
error, obtaining from the intercept of the linear log-log formulation. Therefore, log (b)=the intercept of the formulation Taken together, we obtain the following formula as described in equation [5]. BR=sES + log (b) (5) Where, s=perceived reinforcement sensitivity, −1 ≤ s ≤ 1 ES=Endurance score, 0 ≤ ES ≤ 2 J Account Mark ISSN: 2168-9601 JAMK, an open access journal
∴ − 2 ≤ BR ≤ 2 with an unbiased measurement error Based on equation [5], we conduct a simulation for obtaining a brand resonance when the endurance scores are 1, 10, 25, 50, 75, and 100 (Figure 3). To compute in convenient, we assign the measurement bias equals 1, which allows an unbiased measurement error (i.e., log(1)=0). As shown in Figure 3, the simulation result demonstrated that the variation of relative brand resonance become greater as the perceived reinforcement sensitivity become larger in association with ES (e.g., BR10 vs. BR50 vs. BR100). That is, the variability of BR increases as ES becomes larger regardless of the variation of the Volume 4 • Issue 1 • 1000122
Citation: Hunt J, Kim W, Lancioni RA (2015) Introducing the Semantic Organization Model for the Assessment of Social Media: Accuracy and Relevance of On-line Reviews. J Account Mark 4: 122. doi:10.4172/2168-9601.1000122
Page 5 of 6 2 1.5 1 0.5 (BR)
0
-0.5 -1 -1.5 -2
-1
0
1 BR1
BR10
BR25
BR50
BR75
(s)
BR100
Note: For convenience, the measurement error (b) is given by 1 in the simulation. BR=brand resonance; BR1 indicates when ES is log(1); BR10 indicates when ES is log(10); BR25 indicates when ES is log(25); BR50 indicates when ES is log(50); BR75 indicates when ES is log(75); and BR100 indicates when ES is log(100). Figure 3: The ideally simulated brand resonance.
perceived reinforcement sensitivity, and vice versa. This result implies an important role of ES to increase a probability of purchasing a posted product/service in online review. In other words, consumers do not intend to purchase a posted product/service in online reviews if consumers’ ES does not significantly stimulate their interest to push to purchase. In association with the perceived sensitivity score, the negativity of BR indicates that consumers might have adverse responses from the online posts, particularly when they have a high ES rather than a low ES. That is, an inappropriate post perceived by consumers with having a low perceived reinforcement sensitivity would quickly engender demotivation of their interest according to a posted product/ service in which this criterion point at zero.
Discussion and Implications We present a framework designed to assess the degree to which social media communications such as posts and reviews reveal the semantic nature of those messages. In doing so, we pay particular attention to the linkage between message text and deeper motivational elements that frame decisions rather than focusing on quantitative measures intended to capture audience weight. To a large degree, our methodology is reflective of the work carried out by Reynolds and colleagues, but it also incorporates the perceptual perspective developed by Kelly as well as the cognitive view of Chattopadhyay et al. [2]. In short, we attempt to provide marketers with a method that scores social media messages in terms of semantic meaning. As such, our method is initialized by uncovering the semantic structure, or perceptual orientation, of consumers regarding decisions in a particular product class or service. This requires the determination of salient product features, or attributes, and their attendant outcomes and motivations. To this end, our framework calls for laddering methodology, which links attributes to outcomes, and outcomes to deeper, value-laden motivations? Based on this hierarchical structure, we instruct a panel of respondents to assess each review or post for its representation of each level. This review is reflected in what we call Endurance Scores, which J Account Mark ISSN: 2168-9601 JAMK, an open access journal
are then used to calculate a Resonance Score. The Resonance Score is representative of consumers’ brand engagement and, presumably, the weight of brand commitment. More generally, the framework we have developed reflects much of what is known about semantic information processing and its production. Essentially, we argue that individuals’ perceptual orientation, once activated by a communication, serves as an organizing structures that guides attention to and interpretation and evaluation of that communication. Thus, our method attempts to track the encoding process of interested consumers in a manner that is actionable on the part of marketing decision makers. Reviews and/or posts are assayed for what they communicate about brand attributes, outcomes, and deeper motivating elements; and thus, marketers are able to compare complex results to positioning objectives, paying particular attention to the emotional engagement of targeted consumers. In that regard, the work we present here marries on-line response to the core emotions that underpin lasting relationships between consumer and brand. In short, our work finalizes the assessment of the consumerbrand trajectory, ending in the linkage between consumers and value. References 1. Häubl G, Trifts V (2000) Consumer Decision Making in Online Shopping Environments. The Effects of Interactive Decision Aids. Marketing Science 19: 4-21. 2. Chattopadhyay A, Alba JW (1988) The Situational Importance of Recall and Inference in Consumer Decision Making. Journal of Consumer Research 15: 1-12. 3. Barsalou LW (2005) Continuity of the conceptual system across species. Trends in Cognitive Sciences 9: 309-311. 4. Reynolds TJ, Olson JC (2001) The Means-End Approach to Understanding Consumer Decision Making. In T. J. Reynolds and J. C. Olson (Eds.), Understanding Consumer Decision Making: The Means-End Approach to Marketing and Advertising Strategy (pp. 3-20). Mahwah, NJ: Lawrence Erlbaum Associates. 5. Vinson DE, Scott, JE, Lamont LM (1977) The Role of Personal Values in Marketing and Consumer Behavior. Journal of Marketing 41: 44-50.
Volume 4 • Issue 1 • 1000122
Citation: Hunt J, Kim W, Lancioni RA (2015) Introducing the Semantic Organization Model for the Assessment of Social Media: Accuracy and Relevance of On-line Reviews. J Account Mark 4: 122. doi:10.4172/2168-9601.1000122
Page 6 of 6 6. Reynolds TJ, Craddock AB (1988) The application of the MECCAS model to the development and assessment of advertising strategy: A case study. Journal of Advertising Research 28: 43-54. 7. Saad G (2007) The Evolutionary Bases of Consumption. Psychology Press, New York. 8. Cooper WS (1987) Decision theory as a branch of evolutionary theory: A biological derivation of the savage axioms. Psychological Review 94: 395-411. 9. Todd PM, Gigerenzer G (2007) Environments That Make Us Smart: ecological rationality. Current Directions in Psychological Science 16: 167-171.
Preference, and Choice: A Stochastic View. Management Science 26: 606-619. 18. Dawar N, Parker P (1994) Marketing Universals: Consumers’ Use of Brand Name, Price, Physical. Appearance, and Retailer Reputation as Signals of Product Quality. Journal of Marketing 58: 81-95. 19. Erdem T, Keane M, Sun B (2008) The impact of advertising on consumer price sensitivity in experience goods markets. Quantitative Marketing and Economics 6: 139-176.
10. Wyer RS (2011) Procedural influences on judgments and behavioral decisions. Journal of Consumer Psychology 21: 424-438.
20. Gázquez-Abad JC, Sánchez-Pérez M (2009) Characterising the dealproneness of consumers by analysis of price sensitivity and brand loyalty: an analysis in the retail environment. International Review of Retail, Distribution & Consumer Research 19: 1-28.
11. Herrnstein RJ (1990) Rational choice theory: Necessary but not sufficient. American Psychologist 45: 356-367.
21. Horsky D, Misra S, Nelson P (2006) Observed and Unobserved Preference Heterogeneity in Brand-Choice Models. Marketing Science 25: 322-335.
12. Goldstein K (1939) The Organism: A Holistic Approach to Biology Derived from Pathological Data in Man.American book company, New York.
22. Monroe KB (1976) The Influence of Price Differences and Brand Familiarity on Brand Preferences. Journal of Consumer Research 3: 42-49.
13. Brakus JJ, Schmitt BH, Zhang S (2014) Experiential product attributes and preferences for new products: The role of processing fluency. Journal of Business Research.
23. Srinivasan V, Lovejoy WS, Beach D (1997) Integrated Product Design for Marketability and Manufacturing. Journal of Marketing Research 34: 154-163.
14. Foxall GR (2014) Invitation to Consumer Behavior Analysis. In D. A. Hantula and V. K. Wells (Eds.), Consumer Behavior Analysis: (A) Rational Approach to Consumer Choice (pp. 13-30). New York. 15. Kim BD, Rossi P (1994) Purchase frequency, sample selection, and price sensitivity: The heavy-user bias. Marketing Letters 5: 57-67. 16. Allenby GM, Rossi PE (1999) Marketing models of consumer heterogeneity. Journal of Econometrics 89: 57-78. 17. Blin JM, Dodson JA (1980) The Relationship between Attributes, Brand
24. Kahneman D, Tversky A (1979) Prospect Theory: An Analysis of Decision under Risk. Econometrica 47: 263-291. 25. Hardie BGS, Johnson, EJ, Fader PS (1993) Modeling Loss Aversion and Reference Dependence Effects on Brand Choice. Marketing Science 12: 378-394. 26. Thaler RH (1980) Toward a positive theory of consumer choice. Journal of Economic Behavior & Organization 1: 39-60. 27. Thaler RH (1985) Mental Accounting and Consumer Choice. Marketing Science 4: 199-214.
Submit your next manuscript and get advantages of OMICS Group submissions Unique features: • • •
User friendly/feasible website-translation of your paper to 50 world’s leading languages Audio Version of published paper Digital articles to share and explore
Special features:
Citation: Hunt J, Kim W, Lancioni RA (2015) Introducing the Semantic Organization Model for the Assessment of Social Media: Accuracy and Relevance of On-line Reviews. J Account Mark 4: 122. doi:10.4172/21689601.1000122
J Account Mark ISSN: 2168-9601 JAMK, an open access journal
• • • • • • • •
400 Open Access Journals 30,000 editorial team 21 days rapid review process Quality and quick editorial, review and publication processing Indexing at PubMed (partial), Scopus, DOAJ, EBSCO, Index Copernicus and Google Scholar etc Sharing Option: Social Networking Enabled Authors, Reviewers and Editors rewarded with online Scientific Credits Better discount for your subsequent articles
Submit your manuscript at: http://www.omicsonline.org/submission
Volume 4 • Issue 1 • 1000122