Introduction of Human Perception in Visualization Dulclerci Sternadt Alexandre1, João Manuel R. S. Tavares2
[email protected],
[email protected] 1
Faculty of Engineering of the University of Porto - FEUP, Porto, Portugal 2 Laboratory of Optics and Experimental Mechanics - LOME, Institute of Mechanical Engineering and Industrial Management - INEGI Faculty of Engineering of the University of Porto - FEUP, Porto, Portugal
Abstract. Currently, it is common data of high dimensionality and complexity and for their computational visualization and analysis; traditional representation approaches become insufficient and inefficient. Through the visual system, human perception has an important role in the visualization domain as it supports the cognitive associated process. Thus, in the development of computational tools for complex and high dimension data visualization becomes fundamental to consider the behaviour of the visual human perception. This paper presents important concepts of visual human perception system that can be applied in the implementation of more efficient computational systems for data visualization and analysis. Keywords: human perception, visualization, visual representations.
1 Introduction Currently, the quantity of available data is growing in a continuous and considerable manner, so that it easily accumulates millions (or even billions) of data elements, each one with the capacity to have the most varying sort of attributes. This is taking place in many knowledge domains, making the traditional methods for data visualization and analysis insufficient, complex and inefficient, (Healey 2000: 349). Scientific Visualization is concerned with obtaining adequate visual representations of the input data, in order to supply ways of visual analysis from data sets of high dimension and complexity. Thereafter, it is a major tool in the discovery of relationships and existent dependencies between those sets. This is possible because of its use of visual representations that promote the cognitive support through mechanisms that explore the advantages of human perception, as well as the speed of the visual processing system. However, the way we as humans perceive and react to the visualization result, in other words to the produced images, influences the understanding of the input data and its helpfulness. Thus, human factors can contribute significantly to the visualization process and they must have an important role in the design and development of computational tools suitable for data visualization and analysis. In this way, the data analysis task can become easier, faster and more efficient. Moreover, new inferences and discoveries from the input data are possible when the results are shown through the usage of more suitable visualization techniques based on human perception rules. Recently, some works have begun to explore human factors in data visualization and analysis, and are potentially promising. However, there is much more to do in this research
area; particularly, if we consider that the future of computing will be in the ubiquity and its interfaces adapted to users as well as contexts, (Weiser 1999). This paper is organized as follows: the next section, presents the concepts that involve the visualization; the third section, is related to the main theoretical considerations about human perception applicable to data visualization and analysis; the following section, presents a model of the visual human perception system, valid in terms of data visualization, and then an approach to this model is considered; the last section presents the conclusions. 2 Visualization In general, the term “Visualization” means the development of a visual image in the human mind. However, that is more than simply a graphical representation of data or concepts, as visualization can work as a cognitive tool, and became a powerful strategy in the construction of knowledge using human percipient and cognitive capacities. This definition is according to the work of Stuart Card in (Card 1999); explicitly, in his work he defines “Visualization” as being the use of visual representations of abstract data, supported by computers and, in order to extend the cognition, in an interactive mode. Visualization is not only useful for data observation. Actually, it contributes in a further significant way to the process of data analysis. Thereafter, when the input data is organized according to specific criteria for its visualization, the major results that we can obtain from the same one are additional information and the possibility of acquisition of new knowledge about the data involved. Typically, visualization tools can support three activities: −
−
−
Exploratory Analysis: The user intends to discover new knowledge from the input data: through the adaptation of an analytical process, they explore the obtained visual representation and look for signs that could suggest indications of particular tendencies and relations that can form the basis of a hypothesis. Confirmatory Analysis: The user has a hypothesis and his objective is, through the visual exploration of the graphical representation, to determine evidence for the acceptance or the rejection of the pre-formulated hypothesis. Presentation: It is used for graphical display and representation of the relationship, structure, behaviour and other intrinsic characteristics of the data involved.
In the last fifteen years, Visualization has been distinguished as an autonomous area of research, but it is continually receiving strong contributions from other areas of knowledge, such as psychology, computer science, semiotics, design, cartography, art, among others. Thus, Visualization is relevant in several fields of research but it has always had a major objective: the use of visual metaphor for the representation of the structure and relationships existing in the input data, (Vande 2005). The process of visual representation of data can be considered as almost interpretative, as it uses the original data set to generate a visual interpretation of the same one. Graphical models and visual representations of data have to be used for the analysis and acquisition of useful underlying information about the same data, allowing for the adequate interaction between the user and the generated computational representations. Typically, in Scientific Visualization, the graphic models used are produced from data measured or computationally simulated, associated to phenomena of a physical nature. Frequently, those data contains intrinsic components of space and/or time references that can be used to get full representations of objects, of concepts, of the physical world and
computational simulations. Thus, the generated visual representations are obtained from the original data and can involve two, three or four dimensions, (Ferreira 2003: 378). Normally, in information visualization, graphical models represent concepts and abstract relationships, often, characteristic data with multiple related attributes. However, these attributes are not frequently characterized by space or temporal component. That makes the task of representing them with an adequate graphical approach even more complex. Thus, the attributes of the data to be represented must be characterized according to different criteria. The adequate identification of those criteria is considered determinative to characterize them visually, and, because of that, it is considered one of the most important and complex steps of any computational visualization system. 3 Human Perception The senses are the base of human perception and the human sensorial system is constantly stimulated by a continuous flow of involving events. The result is a neural excitement called sensation. The peculiar answer of each sensorial organ depends on the receiver peripherals involved, and each one of these answers is pertinent to the neurological area in which the canals afferent of these receivers end. The perceptions are different according to the physical characteristics of the stimulus and they are interpreted in function of the previous experiences associated to that stimulus, making the brain able to extract knowledge. This continuous flow of sensations generates what it is known as perception. The external sensations reflect the properties and the aspects, the perceivable human, from the exterior world. “The perception process acquires information from the environment through the use of the sensorial mechanisms of vision, hearing, touch, smell, and taste. This information is integrated and interpreted.”, (Gupta 2000: 221). The reply of a specific sensorial organ is the consequence of its adaptation to the stimulus type involved. Thereafter, there is an expected agreement between a sensation and the stimulus that produces it. For higher efficiency, the sensorial organs work in an integrated way. Generally, those organs work together associated in a complementary manner. Thus, a percipient quality, for example the largeness, can be simultaneously considered by more than one sensorial organ. The integration, cooperation and agreement between sensorial organs are so consistent that, in situations of disparity, the sensorial system adjusts itself in order to adapt to the stimulation involved. For example, when we go to the cinema, the voices that we hear come from loudspeaker systems, arranged at different places around the room, but we associate the sounds we hear as coming directly from the actors’ lips, although this is not what is really happening . Mainly, visualization explores the human sense that has a greater aptitude for information acquisition: vision. Vision is the first component of the human sensorial system and it is the one that is acquired fastest by the human brain. Besides, our vision system has parallelism capacity, which means that while it focuses on one point, the visual system can reach what is surrounding it within a wide area. The human visual system starts to operate when a luminous stimulation is detected by a sensitive neuron, the retina, the first sensorial receiver. This receiver converts the physical manifestation of the stimulation, transforming it into electric signals that will be lead to a primary processing area in the human brain; thus, it can provide initial characteristics of information, like colour, shape, distance, and tone among and others. In terms of perception, appropriate representations are not arbitral and must consider the properties of the human visual system, (Ware 2004). So, the adequate theoretical knowledge
with scientific certificated directives must be the base of any computational tool for data visualization and analysis, (Synnestvedt 2005). 3.1 Shape Perception One of the well known perception theories well known and which has been adopted in several areas is the Gestalt Theory. The Gestalt Theory is based on the following principle: It is not possible to have knowledge of the whole through the parts, but of the parts through the whole; the whole is more than the sum of its parts. The sets have their own laws and manage their elements, and not the opposite, such as was previously thought; And it is only through the perception of the totality that the brain can realize, decode and assimilate an image or a concept. According to the Gestalt theory, the human brain configures information through the sensorial canals, perception and/or memory (thought, cognition and problem resolution). Considering our environmental experience, this configuration is the base of their composed elements, and thus the addition of these last ones would not make us understand the whole. This illustrates the axiom used by the Gestalt theory: the basic principle that the whole is more than the sum of its parts, (Sternberg 2003). It coincides with the main mantra of Visualization, introduced by one pioneer in this area, Ben Schneiderman, (Shneiderman 1996: 336): “Overview First, zoom and filter, then details-on-demand”. The Gestalt theory says that the perceptive activity is subordinated to a basic factor of Prägnanz (good shape). An object is Prägnanz if it expresses any characteristic in a sufficiently strong way to be obvious, to be imposed and to be easily evocative. The Prägnanz characteristic images are considered in the laws of the Gestalt Theory, which explain the structural and functional principles of the perceptive field. These laws establish the shape as the constituent elements of an image that can be perceived. These are the following principles: − −
−
− −
−
Proximity: occurs when elements are placed together in space and time. They tend to be perceived as a group, even when they are not similar. Similarity: elements that have similar or equal characteristics tend to be grouped in sets; the similarity occurs mainly in terms of colour, shape and texture. Normally, similarity is not overlapped by proximity. Closing: elements are disposed in a certain way in order to form an almost closed outline or incomplete shape which could become regular and stable. Thus, they are able to become a unity; this refers the tendency of human perception to realize complete shapes. Humans perceive the whole by filling the missing data. Simplicity: elements are perceived more easily when they present symmetry, regularity and are without textures. Continuity: the human perception has a tendency to orientate the elements that look like appear to build a pattern or a flow along a common direction; so, continuity of direction and continuous ligaments between elements are easier to of be perceived than the ones that present abrupt modifications in their direction. Figure/Background: any perceptive field can be divided into a figure and on a background. The figure is distinguished from the background by characteristics like: size, shape, colour and position. The object is only perceived as a figure after being separated from the background.
3.2 Space Perception In Visualization, the use of visual representations in 3D is common. Therefore, it is important to take into account the perception of space perception in computational visualizations and simulations. The perception of space is not associated with a specific sensorial organ, and so is usually considered as supra-modal and uses elements of visual, hearing and time perception. In visual terms, the perception of space is mainly affected by the distance between objects and their relative size; the combination of these two factors with other agents can be especially useful in the areas of perception and simulation. In this direction, the following aspects are distinguished: a. Vertical predominance: A vertical line can look longer than a horizontal line, even when they are the same size. This happens because there is a vertical predominance in the perceptive human system. b. Parts and totality: The perception of parts does not depend only on the individual stimulations; it is also affected by the totality of the relations established in the perceivable field. c. Surfaces: The perception of surfaces is conditional to its heterogeneous composition. If these differences are not presented then the surfaces perceived are not realized, neither is their space localization. d. Volume and Depth: In this case, there are some peculiarities: − Overlapping: if an object is partially overlapping another one, this last object is perceived as more distant than the first one. − Size: between two objects with different sizes, the biggest seems to be closer and the smaller seems to be more distant. − Movement parallax: the most distant objects seem to follow the movement of the observer, while the nearer ones seem to have movement in the opposing direction. − Relative clarity (clearness): between two objects that have different clarity levels, the clearest object seems nearer. − Light and Shade: the combination of some models of light and shade provide different depth indications. − Linear perspective: the convergence degree between figures is related to the perception of distance. − Texture gradient: a uniform texture is projected on the retina in a manner that, however large the distance is, the density texture in the image is greater. 4 Model of Visual Human Perception All the observations related with the human perception system can be applied to obtain the best produced images for visualization purposes. However, to obtain new information, to emphasize others or to intentionally induce the user to perceive some information from the input data, it is necessary to consider other concepts. For this, it is necessary to understand all phases of the perceptible processing system. In each of these phases the visual perception principles can be applied. However, a lot of research simplifies models of the human perception system by discarding some of its phases. A simplified model for an information processing system based on the visual human perception is frequently used as the first starting point for further more detailed analysis. A
general study on the human vision system is very important to understand the involved processes. Usually, the referred system is divided in three phases, (Ware 2004): 1. Parallel processing to extract properties of a low level from the visual scene; 2. Pattern perception in the resulting image; 3. Sequential goal-directed processing. 4.1 Parallel Processing Visual information is the first to be processed by billions of neurons that work in parallel to extract characteristics from parts of the visual image in analysis; for this, determined neurons are dedicated to extract certain information from the input data, such as: contours orientation, colour, texture and movement patterns. In this phase, what will be given attention is determined; thus, the information in this phase is globally transitory, (Ware 2004). For several years, the way the human visual system analysed images was the subject of deep study. One of the initial and more important results was the discovery of a set of visual properties that are detected in a precise and very quick manner by the low-level visual system. This property was initially designated by the pre-attentive, and corresponds to the previous moment in which our attention is focused. In Visualization, the pre-attentive term can still be used and it translates the notion of speed and easiness that some properties are identified by humans from the visualized images. The characteristics that are processed in a pre-attentive manner can be divided into four basic categories: colour, shape, movement and space location. Moreover, inside each visual field, any modification of the pre-attentive characteristics of an element in relation to the others could modify the focus of attention, (Healey 1999: 1). 4.2 Pattern Perception In the second stage, active processes quickly analyse the visual field in regions and simple patterns, such as continuous contours, regions with similar colours and regions with identical textures. The movement patterns are extremely important; however, in Scientific Visualization the use of movement as information is relatively neglected. In human visual processing, pattern recognition is extremely flexible and is influenced by the available information gathered at the first parallel processing stage. In this second stage, for objects recognition the processing is slower and involves long term memory. More emphasis is given to the prominent aspects, the attention mechanism is of the top-down and bottom-up type, and is visually guided by movements through different paths, (Ware 2004). 4.3 Sequential Processing On a higher perception level, we have the images present in the visual memory through active attention demands, and it will be this memory that will help to respond to visual inquiries. When external visualization happens, the human system constructs a sequence of visual research that will be answered by using visual search strategies. At this level, all the information kept in memory for a determined period of time will allow building patterns, using those available, and also answering visual searches. For example, if we use a road map to search for a determined route, the visual inquiry will initiate a search to link red outlines (that usually represent important roads) between two
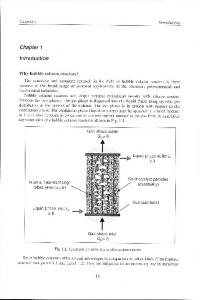
visual symbols (representing the desired cities), (Ware 2004). So, another factor to consider, in terms of visual perception, is past experience; in the case of association, it is basic for the process of perception, because we can only understand that of which we are already conscious. Every time that we acquire new information, our perception is altered. As a result, the visual perception is a result of intrinsic interaction between: external information acquired by the visual system and internal knowledge information previously acquired, (Rensink 2002: 63). 5 The Visualization Reference Model In the visualization reference model presented in (Card 1999), Figure 1, we can identify three phases of the visualization process: data transformation(s) (pre-processing), visual mapping and view transformation (rendering).
Data Raw Data
Visual Form Data Tables
Data Transformations
Visual Structures Visual Mappings
Task Views
Views Transformations
Human Interactions
Figure 1 - Reference model for visualization (Card 1999).
In the first phase raw data is input after the organization of some formatting operations and/or normalizations, according to a logical and structured representation, for example, in the form of tables. In the mapping phase, the association between data and graphic representations takes place: a visual structure that supports the data previously formatted to be used in the rendering step, finally, in this last step, the visual representation of the data is drawn. In the mapping step of the adopted model, there are designated requirements which, in terms of visual perception, have to be observed and which have to be intentionally exacerbated in order to facilitate the data understanding or to motivate new information from it. The mapping step is considered to be a crucial phase in Scientific Visualization. The selection of a graphic representation adapted for the input data, taking human perception principles into appropriate consideration, is not a simple task, and it consists of one important challenge in Scientific Visualization; particularly, for abstract data visualization, which is characterized by the natural absence of the space positioning component, (Vande 2005). The inherent difficulty of implementing computational data representation based on human perception principles leads some authors to defend that it will never be totally accomplished, (Chen 2005: 12). The main reason for this difficulty is the existence of a large number of attributes associated to the data involved that are trying to use the application of perception principles in a concurrence mode, making the computational implementations of the most appropriate visual representations extremely difficult. The automatic selection of a graphic representation suitable for data visualization and analysis is not new. Pioneer work was carried out by Mackinlay, by applying techniques of
Artificial Intelligence, developed a computational system, the APT - The Presentation Tool, to automate the graphical display of bi-dimensional information extracted from a relational database. The graphical 2D representations considered are built using basic graphical primitives, such as points, lines and areas, that represent the information through its position, temporal evolution, and some other properties, such as colour, shape, size, texture and orientation, (Mackinlay 1986: 110). According to Macklinlay, the choice of an appropriate representation for a specific data set must be based on expressiveness and effectiveness criteria. The expressiveness criterion concerns the graphic representations that decode the interest information exactly for the user, (Mackinlay 1988: 179). The efficiency criterion is related to the easiness to understand representations and the information that is expressed by those representations. Besides, the visualization is also characterized by the easiness of interpretation, as well by the capacity to supply what is wanted from the interpretation of the generated images and to maintain the data integrity, (Dastani 2002: 601). To be effective, visualization must quickly transmit the information wanted and not induce mistakes; for this, it must consider the human vision perception capacities. According to (Dastani 2002: 601), the expressiveness and the efficiency depend on human perception, because there is no effectiveness without an expressive representation that is in accordance with the human perception requisites. Concerning visual attributes, Macklinlay elaborated a priorities table in accordance with the perceptiveness degree and the type of data associated. Table 1 demonstrates Macklinlay’s classification for three types of data. In the table, the data is presented by decreasing order in relation to the perceivable visual attributes.
Perception More
Less
Quantitative Data Position Length Angle
Ordinal Data
Slope Area Volume Density
Position Density Color Saturation Color hue Texture Connections Containment
Color Saturation Color hue Texture Connections Containment Shape
Length Angle Slope Area Volume Shape
Nominal Data Position Color hue Texture Connections Containment Density Color Saturation Shape Length Angle Slope Area Volume
Table 1 – The perceptive table of visual attributes according to Macklinlay, (Mackinlay 1988: 179). (In grey are the attributes that are not considered relevant to the type of data in question.)
The value of a determined computational system for data visualization and analysis can be determined by the perceptible capacities included and by the knowledge obtained by its user from the images generated by the same system. However, although some studies have already
been carried out, for example, in (Ware 2004) where perception aspects and how these can be used to improve the visualization systems are described, there lacks a methodology in order to do it more quantitatively and to resolve the consideration of some contradictory requisites appropriately, (von Wijk 2006: 421). 6 Conclusion To overcome the integration problem of human perception requisites in computational systems for data visualization and analysis, more and more efforts have been needed from different scientific areas. Mainly, when the data involved is of high dimension and with multiple attributes, which makes the computational mapping of such data for its adequate visualization and analysis rather complex. To exceed those difficulties, some solutions already exist, as presented in (Synnestvedt 2005) and (Stolte 2003: 176), that try to explore concepts and techniques of Information Theory, Statistics, Data Mining and Machine Learning, in order to simplify the mapping process and visual representation taking into account principles of visual perception. Art and Design have also been adding significant contributions to this area. Although the usual problem of the combination of heterogeneous areas with the intention to generate generic and satisfactory solutions exists, we can verify many favourable convergence examples in the Scientific Visualization area. Considering the visualization of data such as cognitive process, other factors of human perception can also be used to contribute to the information visualization process. In fact, these additional factors can help the cognitive human processes in the recuperation of information contained in the data involved. In this way, all the perception human senses have a very important role in the Scientific Visualization area and can significantly improve the quality and the quantity of information that is presented through the computational images generated, (Ware 2004). Tendency is the inclusion of other perceptive senses to complement the scientific visualization of data. For example, the hearing system is a valuable alternative and an interesting complement for the understanding of very complex data, and in this way we can distinguish the sonification. Sonification is a term that describes the use of sounds not spoken in data representation, aiming always at the most adequate mannerof carrying information, (Schertenleib, 2005). The use of sound to help the representation and analysis of data can be verified, for example, in the works presented in (Salvador 1998: 150) and (Song 2006: 450). Thus, we may think that sonification can be a good solution to help the mapping of data associated to difficult standards of visual perception; in particular, data of great size and with varied dimension, (Schertenleib 2005). Bibliografia Chen, C. (2005). Top 10 unsolved information visualization problems. IEEE Computer Graphics and Applications. Vol. 25, nº 4, pp. 12-16. Card, S. K., Mackinlay, J. D. & Shneiderman, B. (1999). Readings in information visualization: using vision to think. Morgan Kaufman Publishers. Dastani, M. (2002). The role of visual perception in data visualization. Journal of Visual Languages and Computing. Vol. 13, nº 6, pp. 601-622. Ferreira de Oliveira, M.C. & Levkowitz, H. (2003). From visual data exploration to visual data mining: a survey. IEEE Transactions on Visualization and Computer Graphics, Vol. 09, nº 3, pp. 378394.
Gupta Solo, A.M. & Gupta, M.M. (2000). Perspectives on computational perception and cognition under uncertainty. Proceedings of IEEE International Conference on Industrial Technology 2000, Vol. 2, pp. 221-224. Healey, C. G. (1999). Fundamental issues of visual perception for effective image generation. In SIGGRAPH 99 Course 6: Fundamental Issues of Visual Perception for Effective Image Generation. Los Angeles, pp. 1-42. Healey, C.G. (2000). Building a perceptual visualisation architecture. Behaviour & Information Technology. Vol. 19, nº 5, pp. 349-366. Mackinlay J. (1986). Automating the design of graphical presentations of relational information. ACM Transactions on Graphics, Vol. 5, nº 2, pp. 110-141. Mackinlay J. (1988). Applying a theory of graphical presentation to the graphic design of user interfaces. Symposium on User Interface Software and Technology, Proceedings of the 1st annual ACM SIGGRAPH symposium on User Interface Software, pp. 179-189. Rensink R. A. (2002). Internal vs. external information in visual perception. ACM International Conference Proceeding Series; Proceedings of the 2nd international symposium on Smart graphics, v. 24, pp. 63-70. Salvador, V.C.L.; Minghim, R. & Pacheco, M.L. (1998). Sonification to support visualization tasks. International Symposium on Computer Graphics, Image Processing, and Vision, Proceedings. In SIBGRAPI '98. pp. 150-157. Schertenleib, A. (2005). Introduction of sonification. In NASA – Goddard Space Flight Center. «http://spdf.gsfc.nasa.gov/research/sonification/documents/Chapter1.pdf». Shneiderman, B. (1996). The eyes have it: a task by data type taxonomy for information visualizations. IEEE Symposium on Visual Languages. pp. 336. Song, H.J. & Beilharz, K. (2006). Sonification guidelines facilitating an intuitive and rapid understanding/interpretation. 12th International Multi-Media Modelling Conference Proceedings, pp 450-453. Sternberg, R. J. (2003). Cognitive psychology. Third Edition. USA: Wadsworth, Thomson Learning. Stolte, C., Tang, D. & Hanrahan, P. (2003). Multiscale visualization using data cubes. IEEE Transactions on Visualization and Computer Graphics, Vol. 9, nº 2, pp. 176-187. Synnestvedt, M. & Chen, C. (2005). Design and evaluation of the tightly coupled perceptualcognitive task in knowledge domain visualization, The 11th International Conference on HumanComputer Interaction. Vande, A. M. (2005). Form follows data – the symbiosis between design & information visualization. «wwwpeople.arch.usyd.edu.au/~andrew/publications/caadfutures05.pdf». Weiser, M. (1999). The computer for the 21st century. ACM SIGMOBILE 1999 Review. Ware, C. (2004). Information visualization: perception for design. San Francisco: Morgan Kaufmann Publisher. van Wijk, J.J. (2006). Views on visualization. IEEE Transactions on Visualization and Computer Graphics, Vol. 12, no. 4, pp. 421-432.