Jul 5, 2010 - tutorial. Dirk Eddelbuettel. Intro to High-Perf. Computing with R Tutorial @ useR! 2010 ..... (open source
Tools Measure Faster Compile ImplP ExplP OoMem
Introduction to High-Performance Computing with R Tutorial at useR! 2010 Dirk Eddelbuettel, Ph.D.
[email protected] [email protected]
useR! 2010 National Institute of Standards and Technology (NIST) Gaithersburg, Maryland, USA
Dirk Eddelbuettel
Intro to High-Perf. Computing with R Tutorial @ useR! 2010
Tools Measure Faster Compile ImplP ExplP OoMem
Outline
1
Motivation
2
Automation and scripting
3
Measuring and profiling
4
Speeding up
5
Compiled Code
Dirk Eddelbuettel
6
Implicitly Parallel
7
Explicitly Parallel
8
Out-of-memory processing
9
Summary
Intro to High-Perf. Computing with R Tutorial @ useR! 2010
Tools Measure Faster Compile ImplP ExplP OoMem
Motivation: What describes our current situation? Moore’s Law: Processors keep getting faster and faster Yet our ) plot(parse_rprof("longley.lm.fit.out"), main="Profile of lm.fit()")
Dirk Eddelbuettel
Intro to High-Perf. Computing with R Tutorial @ useR! 2010
Tools Measure Faster Compile ImplP ExplP OoMem
Overview RProf RProfmem Profiling Summary
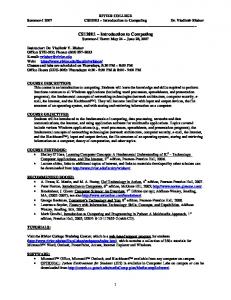
RProf example cont. Profile of lm() inherits
inherits
is.factor
Notice the different x and y axis scales
10
15
mode inherits
0
5
lm FUN lapply sapply replicate 0
2
4
6
8
10
12
14
10
Profiletime of lm.fit()
8
inherits is.factor
2
4
6
%in% lm.fit FUN lapply sapply replicate 0.0
0.2
0.4
0.6
0.8
For the same number of runs, lm.fit() is about fourteen times faster as it makes fewer calls to other functions.
1.0
Source: Our calculations. Dirk Eddelbuettel
Intro to High-Perf. Computing with R Tutorial @ useR! 2010
Tools Measure Faster Compile ImplP ExplP OoMem
Overview RProf RProfmem Profiling Summary
RProf example cont.
In addition, the proftools package by Luke Tierney can read profiling \ CPUPROFILE=/tmp/rprof.log \ r profilingSmall.R
We can then analyse the profiling output in the file. The profiler (renamed from pprof to google-pprof on Debian / Ubuntu) has a large number of options. Here just use two different formats: # show text output google-pprof --cum --text \ /usr/bin/r /tmp/rprof.log | less # or analyse call graph using gv google-pprof --gv /usr/bin/r /tmp/rprof.log
The shell script googlePerftools.sh runs the complete example. Dirk Eddelbuettel
Intro to High-Perf. Computing with R Tutorial @ useR! 2010
Tools Measure Faster Compile ImplP ExplP OoMem
Overview RProf RProfmem Profiling Summary
Profiling with Google Perftools This can generate complete (yet complex) graphs.
Dirk Eddelbuettel
Intro to High-Perf. Computing with R Tutorial @ useR! 2010
Tools Measure Faster Compile ImplP ExplP OoMem
Overview RProf RProfmem Profiling Summary
Profiling with Google Perftools
Another output format is used by the callgrind analyser that is part of valgrind—a frontend to a variety of analysis tools such as cachegrind (cache simulator), callgrind (call graph tracer), helpgrind (race condition analyser), massif (heap profiler), and memcheck (fine-grained memory checker). For example, the KDE frontend kcachegrind can be used to visualize the profiler output as follows: google-pprof --callgrind \ /usr/bin/r /tmp/gpProfile.log \ > googlePerftools.callgrind kcachegrind googlePerftools.callgrind
Dirk Eddelbuettel
Intro to High-Perf. Computing with R Tutorial @ useR! 2010
Tools Measure Faster Compile ImplP ExplP OoMem
Overview RProf RProfmem Profiling Summary
Profiling with Google Perftools Kcachegrind running on the the profiling output looks as follows:
Dirk Eddelbuettel
Intro to High-Perf. Computing with R Tutorial @ useR! 2010
Tools Measure Faster Compile ImplP ExplP OoMem
Overview RProf RProfmem Profiling Summary
Profiling with Google Perftools One problem with the ’global’ approach to profiling is that a large number of internal functions are being reported as well—this may obscure our functions of interest. An alternative is to re-compile the portion of code that we want to profile, and to bracket the code with ProfilerStart() // ... code to be profiled here ... ProfilerEnd()
which are defined in google/profiler.h which needs to be included. One uses the environment variable CPUPROFILE to designate an output file for the profiling information, or designates a file as argument to ProfilerStart(). Dirk Eddelbuettel
Intro to High-Perf. Computing with R Tutorial @ useR! 2010
Tools Measure Faster Compile ImplP ExplP OoMem
Overview RProf RProfmem Profiling Summary
Section Summary
We covered basic profiling functions in R : Rprof CRAN packages profr and proftools for visualization along with a contributed script memory profiling profiling compiled code in general and using Google’s perftools the valgrind front-end kcachegrind for visualization / exploration
Dirk Eddelbuettel
Intro to High-Perf. Computing with R Tutorial @ useR! 2010
Tools Measure Faster Compile ImplP ExplP OoMem
Vec Ra BLAS GPUs Summary
Outline
1
Motivation
2
Automation and scripting
3
Measuring and profiling
4
Speeding up Vectorisation Just-in-time compilation BLAS GPUs Summary
5
6
Implicitly Parallel
7
Explicitly Parallel
8
Out-of-memory processing
9
Summary
Compiled Code
Dirk Eddelbuettel
Intro to High-Perf. Computing with R Tutorial @ useR! 2010
Tools Measure Faster Compile ImplP ExplP OoMem
Vec Ra BLAS GPUs Summary
Vectorisation Revisiting our trivial trivial example from the preceding section: > sillysum system.time(print(sum(as.numeric(seq(1,1e7))))) [1] 5e+13 user system elapsed 0.224 0.092 0.315 >
Replacing the loop yielded a gain of a factor of more than fourty.
Dirk Eddelbuettel
Intro to High-Perf. Computing with R Tutorial @ useR! 2010
Tools Measure Faster Compile ImplP ExplP OoMem
Vec Ra BLAS GPUs Summary
Vectorisation cont.
A more interesting example is provided in a case study on the Ra (c.f. next section) site and taken from the S Programming book: Consider the problem of finding the distribution of the determinant of a 2 x 2 matrix where the entries are independent and uniformly distributed digits 0, 1, . . ., 9. This amounts to finding all possible values of ac − bd where a, b, c and d are digits.
Dirk Eddelbuettel
Intro to High-Perf. Computing with R Tutorial @ useR! 2010
Tools Measure Faster Compile ImplP ExplP OoMem
Vec Ra BLAS GPUs Summary
Vectorisation cont. The brute-force solution is using explicit loops over all combinations: dd.for.c