308â309 of Law and Kelton (2000). If X has the p.d.f. (1), .... ξ is a location parameter, and g(·) is a function whose ... (1989a) detail the advantages of the John-.
Proceedings of the 2005 Winter Simulation Conference M. E. Kuhl, N. M. Steiger, F. B. Armstrong, and J. A. Joines, eds.
INTRODUCTION TO MODELING AND GENERATING PROBABILISTIC INPUT PROCESSES FOR SIMULATION Emily K. Lada
Natalie M. Steiger
SAS Institute Inc. 100 SAS Campus Drive, R5413 Cary, NC 27513-8617, U.S.A.
Maine Business School University of Maine Orono, ME 04469-5723, U.S.A.
Mary Ann Wagner
James R. Wilson
SAIC 7990 Science Applications Ct, Mail Stop CV-63 Vienna, VA 22182, U.S.A.
Department of Industrial Engineering North Carolina State University Raleigh, NC 27695-7906, U.S.A.
ABSTRACT
of the fitted distribution, and (b) there is no effective mechanism for directly manipulating the shape of the fitted distribution while simultaneously updating the corresponding parameter estimates.
Techniques are presented for modeling and generating the univariate and multivariate probabilistic input processes that drive many simulation experiments. Among univariate input models, emphasis is given to the generalized beta distribution family, the Johnson translation system of distributions, and the Bézier distribution family. Among bivariate and higher-dimensional input models, emphasis is given to computationally tractable extensions of univariate Johnson distributions. Also discussed are nonparametric techniques for modeling and simulating time-dependent arrival streams using nonhomogeneous Poisson processes. 1
In modeling a simulation input process, the practitioner must identify an appropriate distribution family and then estimate the corresponding distribution parameters; and the problems enumerated above can block the progress of both of these model-building activities. The conventional approach to identification of a stochastic simulation input model encompasses several procedures for using sample data to accept or reject each of the distribution families in a list of well-known alternatives. These procedures include (i) informal graphical techniques based on probability plots, frequency distributions, or box-plots; and (ii) statistical goodness-of-fit tests such as the KolmogorovSmirnov, chi-squared, and Anderson-Darling tests. For a comprehensive discussion of these procedures, see pp. 329– 369 of Law and Kelton (2000). Unfortunately, none of these procedures is guaranteed to yield a definitive conclusion. For example, identification of an input distribution can be based on visual comparison of superimposed graphs of a histogram and the fitted probability density function (p.d.f.) for each of several alternative distribution families. In this situation, however, the final conclusion depends largely on the number of classes (also called bins or cells) in the histogram as well as the class boundaries; and a different layout for the histogram could result in identification of a different distribution family. Similar anomalies can occur in the use of statistical goodness-of-fit tests. In small samples, these tests can have very low power to detect lack of fit between the empirical distribution and each alternative theoretical distribution, resulting in an inability to
INTRODUCTION
One of the main problems in the design and construction of stochastic simulation experiments is the selection of valid input models—i.e., probability distributions that accurately mimic the behavior of the random input processes driving the system under study. Often the following interrelated difficulties arise in attempts to use standard distribution families for simulation input modeling: 1.
2.
3.
Standard distribution families cannot adequately represent the probabilistic behavior of many realworld input processes, especially in the tails of the underlying distribution. The parameters of the selected distribution family are troublesome to estimate from either sample data or subjective information (expert opinion). Fine-tuning or editing the shape of the fitted distribution is difficult because (a) there are a limited number of parameters available to control the shape
41
Lada, Steiger, Wagner, and Wilson and then sampled in a simulation experiment. In such a situation, it is often possible to model the probabilistic behavior of X using a generalized beta distribution, whose p.d.f. has the form
reject any of the alternative distributions. In large samples, moreover, practically insignificant discrepancies between the empirical and theoretical distributions often appear to be statistically significant, resulting in rejection of all the alternative distributions. After somehow identifying an appropriate family of distributions to model an input process, the simulation user also faces problems in estimating the associated distribution parameters. The user often attempts to match the mean and standard deviation of the fitted distribution with the sample mean and standard deviation of a data set, but shape characteristics such as the sample skewness and kurtosis are less frequently considered when estimating the parameters of an input distribution. Some estimation methods, such as maximum likelihood and percentile matching, may simply fail to yield parameter estimates for some distribution families. Even if several distribution families are readily fitted to a set of sample data, the user generally lacks a comprehensive basis for selecting the appropriate “best-fitting” distribution. The task of building a simulation input model is further complicated if sample data are not available. In this situation, identification of an appropriate distribution family is arbitrarily based on whatever information can be elicited from knowledgeable individuals (experts); and the corresponding distribution parameters are computed from subjective estimates of simple numerical characteristics of the underlying distribution such as the mode, selected percentiles, or loworder moments. In summary, simulation practitioners lack a clear-cut, definitive procedure for identifying and estimating valid stochastic input models; consequently, simulation output analysis is often based on incorrectly specified input processes. In this article techniques are presented for modeling and generating the probabilistic input processes that drive many simulation experiments, with the primary focus on methods designed to alleviate many of the difficulties encountered in using conventional approaches to simulation input modeling. Univariate input models are discussed in §2, with emphasis on the generalized beta distribution family, the Johnson translation system of distributions, and the Bézier distribution family. Multivariate input models are discussed in §3, with emphasis on computationally tractable extensions of univariate Johnson distributions. (Because §3 covers a more specialized topic, it may be skipped on first reading.) Some techniques for modeling and simulating time-dependent arrival streams are discussed in §4. Finally conclusions and recommendations are presented in §5. 2
fX (x) =
�(θ1 + θ2 )
�(θ1 )�(θ2 )(b − a)θ1 +θ2 −1
(x −a)θ1 −1 (b−x)θ2 −1 (1)
�∞ for a ≤ x ≤ b, where �(z) = 0 t z−1 e−t dt (for z > 0) denotes the gamma function. For graphs illustrating the wide range of distributional shapes achievable with generalized beta distributions, see pp. 92–93 of Hahn and Shapiro (1967) or pp. 308–309 of Law and Kelton (2000). If X has the p.d.f. (1), then the cumulative distribution function � x (c.d.f.) of X, which is defined by FX (x) = Pr{X ≤ x} = −∞ fX (w) dw for all real x, unfortunately has no convenient analytical expression; but the mean and variance of X are given by
θ b + θ2 a µX = E[X] = 1 , θ1 + θ2 �� � � 2 =E X−µ 2 = σX X
(b − a)2 θ1 θ2 (θ1 + θ2 )2 (θ1 + θ2 + 1)
.
(2)
Provided θ1 , θ2 > 1 so that the p.d.f. (1) is unimodal, the mode is given by m=
(θ1 − 1)b + (θ2 − 1)a . θ1 + θ 2 − 2
(3)
Equations (2) and (3) reveal that key distributional characteristics of the generalized beta distribution are simple functions of the parameters a, b, θ1 , and θ2 ; and this facilitates input modeling—especially in pilot studies in which rapid model development is critical. Fitting Beta Distributions to Data or Subjective Information. Given a random sample {Xi : i = 1, . . . , n} of size n from the distribution to be estimated, let X(1) ≤ X(2) ≤ · · · ≤ X(n) denote the order statistics obtained by
sorting the {Xi }�in ascending order so that X(1) = min � Xi : i = 1, . . . , n and X(n) = max Xi : i = 1, . . . , n . We can fit a generalized beta distribution to this data set using the following sample statistics: a = 2X(1) − X(2) , b = 2X(n) − X(n−1) , X = n−1
n
i=1 Xi ,
S 2 = (n − 1)−1
n i=1
�2 Xi − X .
�
In particular the method of moment matching involves (i) setting the right-hand sides of (2) equal to the sample mean X and the sample variance S 2 , respectively; and (ii) solving the resulting equations for the corresponding estimates θ1 and θ2 of the shape parameters. In terms of the auxiliary � ��� � �� � a b − a and d2 = S b − a , quantities d1 = X −
UNIVARIATE INPUT MODELS
2.1 Generalized Beta Distribution Family Suppose X is a continuous random variable with lower limit a and upper limit b whose distribution is to be approximated
42
Lada, Steiger, Wagner, and Wilson the moment-matching estimates of θ1 and θ2 are given by θ1 =
d12 (1 − d1 ) d22
− d1 ,
(AbouRizk, Halpin, and Wilson 1991). As a general-purpose tool for simulation input modeling, the generalized beta distribution family has the following advantages:
d1 (1 − d1 )2 θ2 = − (1 − d1 ). d22
•
AbouRizk, Halpin, and Wilson (1994) developed BetaFit, a Windows-based software package for fitting the generalized beta distribution to sample data by computing estimators a, b, θ1 , and θ2 using the following estimation methods: • •
• •
•
On the other hand, generating samples from the beta distribution is relatively slow; and in some general-purpose simulation systems, the beta variate generators break down for moderately large values of the shape parameters—specifically, when θ1 > 10 or θ2 > 10.
moment matching; feasibility-constrained moment matching (so that the feasibility conditions a < X(1) and X(n) < b are always satisfied); maximum likelihood (assuming a and b are known and thus are not estimated); and ordinary least squares (OLS) and diagonally weighted least squares (DWLS) estimation of the c.d.f.
Application of Beta Distributions to Pharmaceutical Manufacturing. Pearlswig (1995) provides a good example of a pharmaceutical manufacturing simulation whose credibility depended critically on the use of appropriate input models. In this study of the estimated production capacity of a plant that had been designed but not � � yet , and built, the usual three time estimates a, m b were obtained from the process engineer for each of the operations in manufacturing a certain type of effervescent tablet. Unfortunately extremely conservative (i.e., large) estimates were provided for the upper limit b of each operation time; and when triangular distributions were used to represent batch-to-batch variation in actual processing times for each operation within each step of production, the resulting bottlenecks resulted in very low estimates of the probability of reaching a prespecified annual production level. As in many simulation applications in which subjective , and estimates a, m b are elicited from experts, the estimate of the modal (most likely) time to perform a given operm ation was substantially more reliable than the estimates a and b of the lower and upper limits on the same operation time. When all the triangular distributions in the simulation were replaced by generalized beta distributions using (4) to ensure conformance to the engineer’s estimate of the most likely processing time for each operation within each step, the resulting annual tablet production was in excellent agreement with production of similar plants already in existence. This simple remedy restored the faith of management in the validity of the overall simulation model, which was subsequently used to finalize certain aspects of the design and operation of the new plant.
Like all the software packages mentioned in this article, BetaFit is in the public domain and is available on the Web via . For rapid development of preliminary simulation models, practitioners often base an initial input model for the , and random variable X on subjective estimates a, m b of the minimum, mode, and maximum, respectively, of the distribution of X. Although the triangular distribution is often used in such circumstances, it can yield excessively heavy tails—and hence grossly unrealistic simulation , or (ii) results—when (i) a is substantially smaller than m . The generalized beta b is substantially larger than m distribution is generally a better choice in cases (i) and (ii), where the corresponding estimates of the beta shape parameters are � ��� given in � terms of the auxiliary quantity − d= b−m m a as follows: d 2 + 3d + 4 4d 2 + 3d + 1 θ1 = and θ ; = 2 d2 + 1 d2 + 1
(4)
see McBride and McClelland (1967). The Visual Interactive Beta Estimation System (VIBES) enables the user to perform user-controlled, graphicallyoriented fitting of generalized beta distributions to subjective estimates of: (i) the endpoints a and b; and (ii) any of the following combinations of distributional characteristics— • • • • •
It is sufficiently flexible to represent with reasonable accuracy a wide diversity of distributional shapes. Its parameters are easily estimated from either sample data or subjective information.
2.2 Johnson Translation System of Distributions
the mean µX and the variance σX2 , the mean µX and the mode m, the mode m and the variance σX2 , the mode m and an arbitrary quantile xp = FX−1 (p) for p ∈ (0, 1), or two quantiles xp and xq for p, q ∈ (0, 1)
Starting from a continuous random variable X whose distribution is unknown and is to be approximated and subsequently sampled, Johnson (1949a) proposed the idea of inferring an appropriate distribution by identifying a suitable “translation” (or transformation) of X to a standard normal
43
Lada, Steiger, Wagner, and Wilson random variable Z with mean 0 and variance 1 so that Z ∼ N(0, 1). The proposed translations have the general form � � X−ξ Z =γ +δ·g , (5) λ
four parameters γ , δ, λ, and ξ . The Johnson translation system of distributions has the flexibility to match (i) any feasible combination of values for the mean µX , vari�� �3 � 3 � σX , and kurtosis ance σX2 , skewness αX = E X − µX �� �4 � 4 � βX = E X − µX σX ; or (ii) sample estimates of the moments µX , σX2 , αX , and βX . Moreover, in principle the skewness αX and kurtosis βX uniquely identify the appropriate translation function g(·). Although there are no closed-form expressions for the parameter estimates based on the method of moment matching, these quantities can be accurately approximated using the iterative procedure of Hill, Hill, and Holder (1976). Other estimation methods may also be used to fit Johnson distributions to sample data—for example, in the FITTR1 software package (Swain, Venkatraman, and Wilson 1988), the following methods are available:
where γ and δ are shape parameters, λ is a scale parameter, ξ is a location parameter, and g(·) is a function whose form defines the four distribution families in the Johnson translation system,
g(y) =
ln(y), � � � ln y + y 2 + 1 , ln[y/(1 − y)] , y,
for SL (lognormal) family, for SU (unbounded) family, for SB (bounded) family, for SN normal family.
DeBrota et al. (1989a) detail the advantages of the Johnson translation system of distributions for simulation input modeling, especially in comparison with the triangular, beta, and normal distribution families.
• • • •
Johnson Distribution and Density Functions. If (5) is an exact normalizing translation of X to a standard normal random variable, then the c.d.f. of X is given by
Fitting SB Distributions to Subjective Information. DeBrota et al. (1989b) developed VISIFIT, a public-domain software package for fitting Johnson SB distributions to subjective information, possibly combined with sample data. The user must provide estimates of the endpoints a and b together with any two of the following characteristics:
� � x − ξ �� FX (x) = � γ + δ · g for all x ∈ H, λ �z � � where: (i) �(z) = (2π)−1/2 −∞ exp − 21 w 2 dw denotes the c.d.f. of the N (0, 1) distribution; and (ii) the space H of X is [ξ, +∞), for SL (lognormal) family, (−∞, +∞), for SU (unbounded) family, H= for SB (bounded) family, [ξ, ξ + λ], (−∞, +∞),
OLS and DWLS estimation of the c.d.f.; minimum L1 and L∞ norm estimation of the c.d.f.; moment matching; and percentile matching.
• • • • • •
for SN normal family.
the mode m; the mean µX ; the median x0.5 ; arbitrary quantile(s) xp or xq for p, q ∈ (0, 1); the width of the central 95% of the distribution; or the standard deviation σX .
The p.d.f. of X is given by � � � � �� � � x−ξ 2 x−ξ 1 � δ exp − γ + δ · g fX (x) = g 2 λ λ λ(2π )1/2
Generating Johnson Variates by Inversion. After a Johnson distribution has been fitted to a data set, generating samples from the fitted distribution is straightforward. First, a standard normal variate Z ∼ N (0, 1) is generated. Then the corresponding realization of the Johnson random variable X is found by applying to Z the inverse translation
for all x ∈ H, where
1/y, � 1� y 2 + 1, � g (y) = 1/[y/(1 − y)], 1,
for SL (lognormal) family, for SU (unbounded) family,
X = ξ + λ · g −1
for SB (bounded) family, for SN normal family.
�
Z−γ δ
� ,
(6)
where for all real z we define the inverse translation function
See DeBrota (1989a) for graphs illustrating the broad diversity of distributional shapes that can be achieved with the Johnson system of univariate probability distributions.
z e , �ez − e−z ��2, � �� g −1 (z) = 1 1 + e−z , z,
Fitting Johnson Distributions to Sample Data. The process of fitting a Johnson distribution to sample data involves first selecting an estimation method and the desired translation function g(·) and then obtaining estimates of the
for SL (lognormal) family, for SU (unbounded) family, for SB (bounded) family, for SN (normal) family. (7)
44
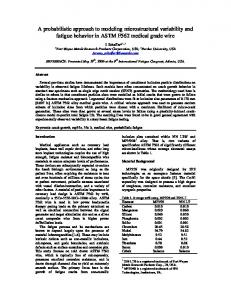
Lada, Steiger, Wagner, and Wilson Application of Johnson Distributions to Smart Materials Research. In Matthews et al. (2005) and Weiland et al. (2005), a multiscale modeling approach is presented for the prediction of material stiffness of a certain class of smart materials called ionic polymers. The material stiffness depends on multiple parameters, including the effective length of the polymer chains comprising the material. In a case study of Nafion, a specific type of ionic polymer, Matthews et al. (2005) describe the development of a simulation model of the conformation of Nafion polymer chains on a nanoscopic level, from which a large number of end-to-end chain lengths are generated. The p.d.f. of end-to-end distances is then estimated and used as an input to a macroscopic-level mathematical model to quantify material stiffness. Figure 1 shows the empirical distribution of 9,980 simulation-generated observations of end-to-end Nafion chain lengths (in angströms). Superimposed on the empirical distribution is the result of using the DWLS estimation method to fit an unbounded Johnson (SU ) distribution to the chain length data. Figure 1 reveals a remarkably accurate fit to the given data set. The results in Matthews et al. (2005) and Weiland et al. (2005) indicate that the estimates of the distribution of chain lengths obtained by fitting an appropriate Johnson distribution to the data are more intuitive than those using other density estimation techniques for the following reasons. First, it is possible to write down an explicit functional form for the Johnson p.d.f. fX (x) that is simple to differentiate. This is a crucial property since the second derivative fX�� (x) of the p.d.f. will be used as an input to a mathematical model to estimate material stiffness. Second, there is a relatively simple relationship between the Johnson parameters and the material stiffness. The study by Weiland et al. (2005) includes the results of a sensitivity analysis for the Johnson parameters and the corresponding effect on material stiffness. Establishing a consistent relationship between these parameters and stiffness would first serve to extend the current theory to stiffness predictions, and may ultimately also serve as a first step toward the custom design of materials with specific stiffness properties.
and they conclude that the SU distribution provided superior fits to the available data. 2.3 Bézier Distribution Family Definition of Bézier Curves. In computer graphics, a Bézier curve is often used to approximate a smooth (continuously differentiable) function on a bounded interval by forcing the Bézier curve to pass in the vicinity of selected
� control points pi ≡ (xi , zi )T : i = 0, 1, . . . , n in twodimensional Euclidean space. (Throughout this article, all vectors will be column vectors unless otherwise stated; and the roman superscript T will denote the transpose of a vector or matrix.) Formally, a Bézier curve of degree n with control points {p 0 , p1 , . . . , p n } is given parametrically by �
=
P(t)
�T
Px (t; n, x), Pz (t; n, z)
n �
=
Bn,i (t) pi for t ∈ [0, 1],
(8)
i=0
where x ≡ (x0 , x1 , . . . , xn )T and z ≡ (z0 , z1 , . . . , zn )T , and where the blending function Bn,i (t) (for all t ∈ [0, 1]) is the Bernstein polynomial Bn,i (t) ≡
n! t i (1 − t)n−i for i = 0, 1, . . . , n. i! (n − i)!
(9)
Bézier Distribution and Density Functions. If X is a continuous random variable whose space is the bounded interval [a, b] and if X has c.d.f. FX (·), and p.d.f. fX (·), then in principle we can approximate FX (·) arbitrarily closely using a Bézier curve of the form (8) by taking a sufficient number (n + 1) of control points with appropriate values for the coordinates (xi , zi )T of the ith control point pi for i = 0, . . . , n. If X is a Bézier random variable, then the c.d.f. of X is given parametrically by P(t)
= =
�T Px (t; n, x), Pz (t; n, z)
�T x(t), FX [x(t)] for t ∈ [0, 1],
�
(10)
where
Application of Johnson Distributions to Healthcare. In a recent study of the arrival patterns of patients who have scheduled appointments at a community healthcare clinic, Alexopoulos et al. (2005) find that patient tardiness (i.e., the patient’s deviation from the scheduled appointment time) is most accurately modeled using an SU distribution. Specifically they consider data on patient tardiness collected by the Partnership of Immunization Providers, a collaborative public-private project created by the University of California, San Diego School of Medicine, Division of Community Pediatrics, in association with community clinics and small, private provider practices. Alexopoulos et al. (2005) perform an exhaustive analysis of 18 continuous distributions,
x(t) = Px (t; n, x) =
n �
Bn,i (t)xi ,
i=0
FX [x(t)] = Pz (t; n, z) =
n � i=0
Bn,i (t)zi .
(11)
Equation (11) reveals that the control points p0 , p1 , . . . , p n constitute the parameters regulating all the properties of a Bézier distribution. Thus the control points must be arranged so as to ensure the basic requirements of a c.d.f.: (i) FX (x) is monotonically nondecreasing in the cutoff value x; (ii) FX (a) = 0; and (iii) FX (b) = 1. By utilizing
45
Lada, Steiger, Wagner, and Wilson 0.1
1
0.09
0.9
0.08
0.8
0.07
0.7
0.06
0.6
0.05
0.5
0.04
0.4
0.03
0.3
0.02
0.2
0.01
0.1
0 −10
0
10
20
30
40
50
60
70
80
90
0 −10
0
10
20
30
40
50
60
70
80
90
Figure 1: Johnson SU C.d.f. (Left Panel) and P.d.f. (Right Panel) Fitted to 9,980 Nafion Chain Lengths the Bézier property that the curve described by (10)–(11) passes through the control points p 0 and p n exactly, we can ensure that FX (a) = 0 if we take p 0 ≡ (a, 0)T ; and we can ensure that FX (b) = 1 if we take p n ≡ (b, 1)T . See Wagner and Wilson (1996a) for a complete discussion of univariate Bézier distributions and their use in simulation input modeling. If X is a Bézier random variable with c.d.f. FX (·) given parametrically by (10), then it follows that the corresponding p.d.f. fX (x) for all real x is given parametrically by P∗ (t) = =
and (ii) deliver the variate X = x(tU ) =
The solution to (12) can be computed by any root-finding algorithm such as Müller’s method, Newton’s method, or the bisection method. Codes to implement this approach to generating Bézier variates are available on Web site .
�
�T Px∗ (t; n, x), Pz∗ (t; n, x, z)
�T x(t), fX [x(t)] for t ∈ [0, 1],
Using PRIME to Model Bézier Distributions. PRIME is a graphical, interactive software system that incorporates the methodology detailed in this section to help an analyst estimate the univariate input processes arising in simulation studies. PRIME is written entirely in the C programming language, and it has been developed to run under Microsoft Windows. A public-domain version of the software is available on the previously mentioned Web site. PRIME is designed to be easy and intuitive to use. The construction of a c.d.f. is performed through the actions of the mouse, and several options are conveniently available through menu selections. Control points are represented as small black squares, and each control point is given a unique label corresponding to its index i in equation (8). Figure 2 shows a typical session in PRIME, where the c.d.f. and p.d.f. windows are both displayed. In the absence of data, PRIME can be used to model an input process conceptualized from subjective information or expertise. The representation of the conceptualized distribution is achieved by adding, deleting, and moving the control points via the mouse. Each control point acts like a “magnet” that pulls the curve in the direction of the control point, where the blending functions (i.e., the Bernstein polynomials defined by equation (9)) govern the strength of the “magnetic” attraction exerted on the curve by each control point. Pressing and dragging (i.e., moving) a control point causes the displayed c.d.f. to be updated (nearly) instantaneously. If they are displayed, the corresponding
fX [x(t)] = Pz∗ (t; n, x, z)
n−1 Pz (t; n − 1, z) i=0 Bn−1,i (t) zi . = n−1 Px (t; n − 1, x) Bn−1,i (t) xi i=0
In the last equation, we take x ≡ ( x0 , . . . , xn−1 )T and z ≡ ( z0 , . . . , zn−1 )T , where xi ≡ xi+1 − xi and zi ≡ zi+1 − zi (i = 0, 1, . . . , n − 1) represent the corresponding first differences of the x- and z-coordinates of the original control points {p0 , p1 , . . . , p n } in the parametric representation (10) of the c.d.f. Generating Bézier Variates by Inversion. The method of inversion can be used to generate a Bézier random variable whose c.d.f. has the parametric representation displayed in equations (10)–(11). Given a random number U ∼ Uniform[0, 1], we perform the following steps: (i) find tU ∈ [0, 1] such that FX [x(tU )] =
n �
Bn,i (tU )zi = U ;
Bn,i (tU )xi .
i=0
where x(t) = Px∗ (t; n, x) = Px (t; n, x) as in (11) and
=
n �
(12)
i=0
46
Lada, Steiger, Wagner, and Wilson
Figure 2: PRIME Windows Showing the Bézier C.d.f. (Left Panel) with Its Control Points and the P.d.f. (Right Panel) p.d.f., the first four moments (that is, the mean, variance, skewness, and kurtosis), and selected percentile values of the Bézier distribution are updated (nearly) simultaneously in adjacent windows so that the user gets immediate feedback on the effects of moving selected control points. Thus, the user has a variety of readily available indicators and measures, as well as visually appealing displays, to aid in the construction of the conceptualized distribution. As detailed in Wagner and Wilson (1996a, 1996b), PRIME includes several standard estimation procedures for fitting distributions to sample data sets:
•
•
• • • • • •
OLS estimation of the c.d.f.; minimum L1 and L∞ norm estimation of the c.d.f.; maximum likelihood estimation (assuming a and b are known); moment matching; and percentile matching.
3
Figure 3 shows a Bézier distribution that was fitted to the same data set consisting of Nafion polymer chain lengths as shown in Figure 1. In this application of PRIME, we obtained the fitted Bézier distribution automatically, where: (i) the number of control points (n+1) was determined by the likelihood ratio test detailed in Wagner and Wilson (1996b); and (ii) the parameters x = (x0 , x1 , . . . , xn )T and z = (z0 , z1 , . . . , zn )T of the control points were estimated by the method of ordinary least squares. Figure 3 shows that a Bézier distribution yielded an excellent fit to the given data set. The Bézier distribution family, which is entirely specified by its control points {p 0 , p1 , . . . , p n }, has the following advantages: •
easily constructed using PRIME, yet impossible to achieve with other distribution families. If data are available, then the likelihood ratio test of Wagner and Wilson (1996a) can be used in conjunction with any of the estimation methods enumerated above to find automatically both the number and location of the control points. In the absence of data, PRIME can be used to determine the conceptualized distribution based on known quantitative or qualitative information that the user perceives to be pertinent. As the number (n + 1) of control points increases, so does the flexibility in fitting Bézier distributions. The interpretation and complexity of the control points, however, does not change with the number of control points.
MULTIVARIATE INPUT MODELS
Many univariate distributions have been generalized to form bivariate distributions. These include numerous discrete (binomial, hypergeometric, Poisson) and continuous (uniform, normal, exponential, beta, and gamma) distributions (Mardia 1970). However, very few of these can be practically extended to higher dimensions. The multivariate normal distribution (Kotz, Balakrishnan, and Johnson 2000) is the most easily manipulated and most frequently used multivariate distribution. However, the component normal distributions have a fixed shape and are often inappropriate for data fitting. In addition to the inflexibility of the multivariate normal, Johnson (1987) cites the following limitations of existing multivariate distributions: •
It is extremely flexible and can represent a wide diversity of distributional shapes. For instance, Figure 2 depicts a multimodal distribution that is
47
Some distributions (e.g., the Bessel function distributions) present significant computational problems.
Lada, Steiger, Wagner, and Wilson
Figure 3: Bézier Distribution Fitted to 9,980 Nafion Chain Lengths • •
•
The support of some distributions (e.g., the betaStacy) is too limited to be of interest. Some multivariate distributions (e.g., Morgenstern’s distribution) are able to represent only weak correlation structures. Computational methods for distribution fitting and variate generation have not been developed for some multivariate distributions.
3.1 Multivariate Johnson Translation System Johnson (1949b) proposed a bivariate distribution based on the univariate Johnson distributions. The parameterized model matches the first four moments (i.e., the mean, variance, skewness, and kurtosis) for each component of the target random vector X = (X1 , X2 )T and then attempts to approximate the correlation between the two components. As detailed below, the technique is easily extended to higher dimensions. For a discussion that is limited to the case of bivariate distributions and hence may be more accessible on first reading, see Wilson (1997). Consider a continuous multivariate random vector X with ν components, X = (X1 , . . . , Xν )T , which is to be modeled with some parameterized distribution. The Johnson multivariate modeling method determines a normalizing translation such that
Although the bivariate Bézier distribution family (Wagner and Wilson 1995) seems to have the potential for accurately representing many commonly occurring forms of bivariate dependence, the extension of this family to three or more dimensions appears to be cumbersome and computationally intensive. Other approaches to multivariate input modeling can be based on TES (Transform-Expand-Sample) processes (Jagerman and Melamed 1992a, 1992b) and ARTA (AutoRegressive To Anything) processes (Cario and Nelson 1996, 1998). Both methodologies enable the user to specify the autocorrelation function out to an arbitrary lag for a univariate stochastic process with a user-specified marginal distribution, but ARTA processes seem to be substantially easier to use. In the following subsections we focus the discussion on flexible multivariate distributions that are based on the Johnson family of univariate distributions because the methods for estimating and then generating samples from these latter distributions require much less computation than for TES and ARTA processes—especially for moderate to large values of the dimension ν of the modeled random vector. The greatest computational effort required for the methods described in this section is the effort to invert a ν ×ν matrix.
� � Z = γ + δg λ−1 (X − ξ ) ∼ Nν (0ν , �) ,
(13)
so that the random vector Z = (Z1 , . . . , Zν )T has a νdimensional standard normal distribution with null mean vector 0ν and covariance matrix � whose entry in the (i, j ) place is the correlation between Zi and Zj for i, j = 1, . . . , ν. Thus � is actually a correlation matrix with ones on the diagonal. Notice that (13) is a straightforward generalization of Johnson’s univariate translation (5)
to the multivariate case. TBased on a random � sample Xj = (X1,j , X2,j , . . . , Xν,j ) : j = 1, . . . , n from the distribution of X that is to be approximated, this vectorvalued normalizing translation is accomplished as follows:
48
Lada, Steiger, Wagner, and Wilson 1.
2.
�T � �� ≡ Identify the transformation g y1 , . . . , yν �T � g1 (y1 ), . . . , gν (yν ) so that for the ith component Xi of X (where i = 1, . . . , ν), the translation function gi (·) is selected to match the sample skewness and kurtosis computed from the random sample {Xi,j : j = 1, . . . , n}. Estimate the matrices of shape parameters, γ ≡ �T � γ1 , . . . , γν , δ ≡ diag(δ1 , . . . , δν ) =
3.
δ1 0 .. .
0 δ2 .. .
··· ··· .. .
0 0 .. .
0
0
···
δν
accuracy); and if each of the empirical marginal distributions of the original sample data is nearly symmetric about its mean, then the intercomponent correlations of the fitted multivariate Johnson distribution will nearly match the sample correlations of the original sample data. However, if some of the empirical marginal distributions of the original sample data (or the corresponding underlying theoretical marginals) possess marked skewness, then the correlation matrix of the fitted multivariate Johnson distribution will not match the sample correlation matrix of the original data set.
,
Application of Multivariate Johnson Distributions to Welfare Policy Analysis. McDaniel, Sullivan, and Wilson (1988) developed a large-scale simulation model of the Institutional Care and Community Care programs of the Texas Department of Human Services (TDHS) with the objective of estimating the effects of changes in program eligibility criteria on client loads, costs, and other relevant performance measures for new and existing services when those performance measures must be forecast over an extended planning horizon. Trivariate Johnson SBBB distributions were used to approximate the joint distribution of monthly income, dollar value of countable resources, and functional disability score for individuals in each target population defined by a combination of age cohort and service region. The resulting simulation model, called ADSSIM, was used by the Budget and Planning Division of TDHS to analyze budget requests and to redesign sections of TDHS’s biennial survey so that the modeling approach could be applied to all Community Care programs.
and the matrices of the respective location �T � and �scale parameters, ξ ≡ ξ1 , . . . , ξν , λ ≡ � diag λ1 , . . . , λν , so that for the ith component Xi of X (where i = 1, . . . , ν), not only the translation function gi (·) but also the parameters γi , δi , λi , and ξi are determined so as to match the sample mean, variance, skewness, and kurtosis of the random sample {Xi,j : j = 1, . . . , n}. Estimate correlation matrix � by (i) inserting each sample value {Xj : j = 1, . . . , n} into the estimated normalizing translation (13) to obtain the corresponding sample {Zj : j = 1, . . . , n} of estimated standard normal random vectors; and (ii) computing the sample correlation matrix of the {Zj } as the approximate moment-matching estimator of �.
3.2 Matching Exactly a Given Mean Vector and Covariance Matrix
Generating Johnson Random Vectors. To generate a Johnson random vector with parameters γ , δ, λ, ξ , and � (or with estimators of these quantities), we must first compute the “square root” matrix Q based on the Cholesky decomposition � = QQT . If U = (U1 , . . . , Uν )T consists of independent standard normal random variables, then Z = QU ∼ Nν (0ν , �). It follows that by applying the inverse of the multivariate translation (13) to Z, we obtain a random vector X with the desired distributional characteristics, � � X = ξ + λg −1 δ −1 (Z − γ ) ,
Alternative Multivariate Distributions with Univariate Johnson Marginals. In some situations the objective is to fit a multivariate distribution having a given mean vector µX and covariance matrix � X such that for i = 1, . . . , ν, the ith marginal is a univariate Johnson distribution with the same first four moments as Xi , the ith component of the target random variable X. To do this, we present the method of Stanfield et al. (1996). Suppose that X has correlation matrix CX = [Corr(Xi , Xj )]. Define the lower triangular matrix � � 1/2 �X ≡ θij = CX based on the Cholesky decomposition CX = �X �� TX together with the matrix of �standard deviations σ X ≡ diag Var 1/2 (X1 ), . . . , Var 1/2 (Xν ) . If Y = (Y1 , . . . , Yν )T consists of independent standardized Johnson variates so that each component Yi has a univariate Johnson distribution with mean 0 and variance 1 for i = 1, . . . , ν, then the new random vector
(14)
using the previously determined parameter vectors and � the vector-valued � � inverse translation�T function g −1 (z1 , . . . , zν )T ≡ g1−1 (z1 ), . . . , gν−1 (zν ) , where gi−1 (·) is defined by (7) for i = 1, . . . , ν. Limitations of the Procedure Based on (13)–(14). This method will generate random vectors with exactly the same marginal moments as the original sample data {Xj : j = 1, . . . , n} from which the sample estimators of γ , δ, λ, ξ , and � are computed (at least to the limits of machine
W ≡ µX + σ X �X Y
49
(15)
Lada, Steiger, Wagner, and Wilson explained below, it is also true that for i = 1, . . . ν, the kurtosis of Wi matches the kurtosis βXi of Xi as this quantity is specified or estimated by the ith element of the vector βX. This method requires relatively little computational effort. Data fitting requires determining 4ν marginal moments and ν(ν − 1)/2 correlation values; finding the fourth power of ν(ν + 1)/2 numbers; inverting two ν × ν matrices; computing ψi for i = 1, . . . , ν; and finally fitting ν univariate Johnson distributions by the method of moment matching. Random vector generation requires generating ν independent normal variates, taking the inverse of ν univariate Johnson translations, and multiplying two ν × ν matrices.
has the mean vector µX and covariance matrix � X . Notice that W does not have a conventional multivariate Johnson distribution as defined by (7)–(14). Most important, however, is the observation that for each component i (where i = 1, . . . , ν), the parameters γi , δi , λi , and ξi of Yi are set so that the ith component Wi of the random vector W has the same skewness αXi and kurtosis βXi as the random variable Xi has. Let α X and β X be ν × 1 vectors whose ith elements are the skewness αXi and kurtosis βXi of the random variable Xi , respectively, for i = 1, . . . , ν. Similarly, let α Y and β Y denote the skewness and kurtosis vectors for Y. Finally, � � (k) define the auxiliary matrix �X ≡ θijk for k = 3, 4 together with the auxiliary vector X ≡ (ψ1 , . . . , ψν )T , where ψi
ν ν 2 for i = 1, . . . , ν. = 6 j =1 �=j +1 θij2 θi� Now if the random vector X were generated according to the transformation X = µX + σ X �X Y, then it is easily shown that the skewness and kurtosis vectors α X and β X corresponding to X, would be given, respectively, by αX βX
(3)
=
�X α Y
=
(4)
�X β Y + X
Generating Random Vectors with Given Mean and Covariance Matrix. To generate the random vector X with desired mean vector µX and covariance matrix � X , we generate the random vector Z = (Z1 , . . . , Zν )T consisting of ν independent standard normal random variables; and we deliver the random vector given by
� .
� �� X = µX + σ X �X ξ + λg −1 δ −1 (Z − γ ) ,
(16)
where the translation function g(·) and the parameter vectors γ , δ, λ, and ξ were computed one component at a time from (17) as described above.
Thus, when we are given estimates or exact values of skewness and kurtosis vectors α X and β X for the target random vector X, we solve the moment-matching equations (16) to yield the skewness and kurtosis vectors α Y and β Y that are required for Y: αY
=
βY
=
αX � (4) �−1 � � . �X βX − X �
Limitations of the Procedure Based on (15)–(18). The ability to match the marginal skewness of each component of W to the marginal skewness of the corresponding component of X depends only on finding standardized Johnson random variables with mean 0, variance 1, and skewness values specified by the components of α Y in (17). A standardized univariate Johnson distribution can always be found whose skewness matches any target value; see, for example, Johnson (1949a) or Hill, Hill, and Holder (1976). Consequently, the multivariate distribution-fitting scheme (15)–(17) always matches the first three marginal moments and correlation structure of the modeled data. The ability to match the marginal kurtosis of each component of W to the marginal kurtosis of each component of X depends only on finding a vector Y of independent standardized Johnson variates each with mean 0, variance 1, skewness specified by the corresponding component of the vector α Y , and kurtosis specified by the corresponding component of the vector β Y . Now if a standardized Johnson random variable Yi has skewness αYi and kurtosis βYi , then we must have
(3) �−1
�X
(18)
(17)
It follows from (17) that for i = 1, . . . , ν, the standardized Johnson variate Yi with mean 0 and variance 1 must have skewness αYi and kurtosis βYi as specified by the ith elements of the vectors α Y and β Y , respectively. Thus for i = 1, . . . , ν, we use the moment-matching algorithm of Hill, Hill, and Holder (1976) to determine the appropriate form of the translation function gi (·) and to compute the corresponding moment-matching parameters γi , δi , λi , and ξi for the required distribution of Yi ; and these latter four quantities become the ith elements of the associated parameter vectors γ , δ, and λ, and ξ , respectively. (3) (4) If we compute the matrices �X , �X , �X , and X based on known or estimated matrices µX , σ X , CX , α X , and β X describing the target random vector X whose joint distribution is to be approximated, then we see that the transformed random vector W given by (15) has the same mean vector and covariance matrix as X has; moreover for i = 1, . . . ν, we see that the skewness of Wi matches the skewness αXi of Xi as this quantity is specified or estimated by the ith element of the vector α X . With some exceptions
βYi ≥ αY2i + 1 for i = 1, . . . , ν;
(19)
see, for example, Johnson and Lowe (1979). Unfortunately, the solution (17) to the moment-matching equations (16) is not guaranteed to satisfy the requirement (19) for a valid probability distribution even though the corresponding
50
Lada, Steiger, Wagner, and Wilson 2 + 1 must hold for each component relationship βXi ≥ αX i Xi of the target random vector X. This state of affairs reflects a fundamental limitation of the family of multivariate distributions formulated in equations (15)–(17). Although this family always possesses the flexibility to match the available information about the mean vector and covariance matrix of X as well as the marginal skewness of each component of X, this approach may fail to match exactly all available information about the marginal kurtosis of the components of X. If α Y and β Y completely consist of feasible skewness/kurtosis pairs that satisfy (19), then W will have the same first four marginal moments and correlation structure as X has. On the other hand, if (17) yields an infeasible pair αYi , βYi of marginal skewness and kurtosis values for the ith component Yi , then we must increase the corresponding kurtosis estimate βYi to a feasible value slightly above αY2i + 1 so that (19) is satisfied for this component of Y. As a result, W will have the first three marginal moments and correlation structure of X with some marginal kurtosis values that are slightly different from those for X. The transformation to correct kurtosis values and to determine the marginal kurtosis of W and the deviation from the marginal kurtosis of X is easy to apply. Notice that the order in which the multivariate components are determined has some influence on the adjustment required for infeasible αYi , βYi pairs.
rivals of patrons at an amusement park; arrivals of patients at an emergency room; and arrivals of telephone calls at a customer service center. To analyze or improve system operation in such situations, discrete-event stochastic simulation is often the technique of choice. Consequently, highfidelity probabilistic input models are frequently needed to perform meaningful simulation experiments. In the past, nonhomogeneous Poisson processes (NHPPs) have been used successfully to model complex time-dependent arrival processes in a broad range of application domains (Lewis and Shedler 1976; Kao and Chang 1988; Lee, Wilson, and Crawford 1991; Massey, Parker, and Whitt 1996; and Pritsker et al. 1995). An NHPP {N (t) : t ≥ 0} is a counting process such that N (t) is the number of arrivals in the time interval (0, t]; and λ(t), the instantaneous arrival rate at time t, is a nonnegative, integrable function satisfying the usual Poisson postulates so that the corresponding (cumulative) mean-value function is given by $
λ(z) dz for all t ≥ 0.
(20)
0
The rate or mean-value function of the NHPP {N (t) : t ≥ 0} completely characterizes the probabilistic behavior of the process. Both parametric and nonparametric methods have been developed to estimate the rate or mean-value function of the process {N (t) : t ≥ 0} from observed arrival times. In this section we concentrate the discussion on a nonparametric approach of Leemis (1991, 2000, 2004); and we present the method in the context of a recent application to modeling and simulating unscheduled patient arrivals to a community healthcare clinic (Alexopoulos et al. 2005). Suppose that we are given a time interval (0, S] over which we observe several independent replications (realizations) of a stream of unscheduled patient arrivals, and that this stream of arrivals constitutes an NHPP with a timedependent arrival rate λ(t) for t ∈ (0, S]. For example, the observation interval might represent the time period on each weekday during which unscheduled patients may walk into a clinic—say, between 9:00 A.M. and 5:00 P.M. so that S = 480 minutes. Suppose that k realizations of the arrival stream over this observation interval have been recorded so that we have ni patient arrivals in the ith realization for i = 1, 2, . . . , k; and
thus we have a total of n = ki=1 ni patient arrivals accumulated over all realizations � of the arrival stream. Moreover, let t(i) : i = 1, . . . , n denote the overall set of arrival times for all unscheduled patients expressed as an offset from the beginning of the observation interval (0, S] and then sorted in increasing order. Thus, for example, if we observed n = 250 patient arrivals over k = 5 days, each with an observation interval of length S = 480 minutes,
Application of Procedure Based on (15)–(18) to Remanufacturing. Stanfield, Wilson, and King (2004) used the multivariate input-modeling approach of (15)–(18) to develop a simulation model of the operation of a NAVAIR depot. This is a large remanufacturing facility that provides the U.S. Navy with its most thorough level of aircraft, aircraft engine, and aircraft component maintenance, including major repair, modification, and overhaul. Operation times are random variables whose distributions tend to have a variety of shapes and often exhibit substantial skewness. Different operation times for the same product tend to exhibit significant interdependencies (correlations). In practical applications of simulation to product-reuse facilities of realistic complexity, there are frequently hundreds of individual operations to be modeled so that often ν ≥ 100; and in such situations, the multivariate input-modeling approach of (15)–(18) has substantial computational advantages over other techniques for modeling the stochastic dependencies among operation times. 4
t
µ(t) ≡ E[N (t)] =
TIME-DEPENDENT ARRIVAL PROCESSES
Time-varying arrival processes are routinely encountered in practical applications of industrial and systems engineering techniques. The following are typical situations in which the arrival rate of relevant entities depends strongly on time: demands for seasonal products such as lawn mowers; ar-
51
Lada, Steiger, Wagner, and Wilson
4 to generate a new stream of arrival times Ai : i = � 1, 2, . . . over the time interval (0, S] with approximately the same general pattern of dependence on time as in (21)— that is, with the approximate arrival rate λ(t) at each time t in the interval (0, S].
then t(1) = 2.5 minutes means that over all 5 days, the earliest patient arrival occurred 2.5 minutes after the clinic opened its doors to unscheduled arrivals on one of those days; and similarly, t(2) = 4.73 minutes means that the second-earliest patient arrival occurred 4.73 minutes after the clinic opened its doors to unscheduled arrivals on one of those days. Given that λ(t) represents the rate of arrival of unscheduled patients for each time t in the observation interval (0, S], we see that the mean-value function µ(t) representing the expected number of arrivals during the interval (0, t] is given by (20). We take t(0) ≡ 0 and t(n+1) ≡ S so that for t(i) < t ≤ t(i+1) and i = 0, 1, . . . , n, a piecewise linear nonparametric estimator of µ(t) is � � & % n t − t(i) in µ(t) = + � ; � (n + 1)k (n + 1)k t(i+1) − t(i)
[1] Set i ← 1 and N ← 0. [2] Generate Ui ∼ Uniform(0, 1). [3] Set Bi ← − ln(1 − Ui ). [4] While Bi < n/k do Begin
'
( (n + 1)kBi ; n % &
� (n + 1)kBi Set Ai ← t(m) + t(m+1) − t(m) −m ; n Set m ←
(21)
Set N ← N + 1; Set i ← i + 1; Generate Ui ∼ Uniform(0, 1);
see Leemis (1991). Equation (21) provides a basis for modeling and simulating unscheduled patient-arrival streams when the arrival rate exhibits a strong dependence, for example, on the time of day. To perform goodness-of-fit testing on the fitted meanvalue function µ(t) for t ∈ (0, S], we recommend the following cross-validation technique. Suppose that in addition to the realizations of the target arrival process that were used to compute the estimated mean-value function µ(t), we�
observe one additional realization A�i : i = 1, 2, . . . , n� that is independent of the previously observed realizations, with the ith patient arriving at time A�i for i = 1, . . . , n� . If the target arrival stream is in fact an NHPP with true meanvalue function µ(t) for � t� ∈ (0, S], then the� transformed arrival times Bi� = µ A�i : i = 1, 2, . . . , n� obtained by feeding each arrival time into the true mean-value function constitute a homogeneous Poisson process with an arrival rate of 1; and the corresponding transformed interarrival � � times Xi� = Bi� − Bi−1 : i = 1, 2, . . . , n� (with B0� ≡ 0) constitute a random sample from an exponential distribution with a mean of 1. It follows that an appropriate test for the adequacy of the fitted mean-value function µ(t) as an approximation to the true mean-value function µ(t) is to apply� the� Kolmogorov� � Smirnov test to the data set Xi�� = µ A�i−1 : µ A�i − � i = 1, 2, . . . n� (with A�0 ≡ 0) consisting of estimates of the transformed interarrival times based on the estimated mean-value function, where the hypothesized c.d.f. in the goodness-of-fit test is FXi�� (x) = 1−e−x for all x ≥ 0. For a comprehensive discussion of other techniques for assessing the goodness of fit of estimated arrival processes, see Lee, Wilson, and Crawford (1991); Kuhl, Wilson, and Johnson (1997); and Kuhl and Wilson (2000). If the estimated mean-value function µ(t) passes the goodness-of-fit test outlined above, then we can use the simulation algorithm of Leemis (1991) as displayed in Figure
Set Bi ← Bi−1 − ln(1 − Ui ). End
Figure 4: Algorithmic Statement of the NHPP Simulation Procedure of Leemis (1991) Note that in the simulation algorithm of Figure 4, z� denotes the greatest integer (or floor) function so that, for example, 3.7� = 3. Moreover, the total number of arrivals generated by this algorithm on one simulated realization of the arrival stream is given by the random variable N ; and provided that N > 0, the ith patient will arrive at time Ai for i = 1, . . . , N. The main advantage of this approach to modeling and simulation of time-dependent arrival processes is that it does not require the assumption of any particular functional form for the way in which the arrival rate λ(t) depends on the time t since the beginning of the observation interval (0, S]. Moreover as k → ∞, so that the number of realizations of the target arrival process becomes large, with probability 1 the estimated mean-value function µ(t) of equation (21) converges to the true mean-value function µ(t) for all t ∈ (0, S]. This means that the simulation algorithm given above (which is based on inversion of µ(t) so that Ai = µ −1 (Bi ) for i = 1, . . . , N) is also asymptotically valid as k → ∞. For more information on this approach to modeling and simulation of time-dependent arrival processes, see Leemis (2004). Application to Organ Transplantation Policy Analysis. The United Network for Organ Sharing (UNOS) carried out a remarkable large-scale application of a simplified variant of this approach to modeling and simulating patient-arrival streams in the development and use of the UNOS Liver Allocation Model (ULAM) for analysis of the cadaveric liver-allocation system in the United States (see Harper et
52
Lada, Steiger, Wagner, and Wilson al. 2000). ULAM incorporated models of (a) the streams of liver-transplant patients arriving at 115 transplant centers, and (b) the streams of donated organs arriving at 61 organ procurement organizations in the United States—and virtually all these arrival streams exhibited strong dependencies on the time of day, the day of the week, and the season of the year as well as pronounced geographic effects.
and sufficiently flexible to represent adequately many of the probabilistic phenomena that arise in many applications of discrete-event stochastic simulation. Specifically, input-modeling techniques are presented that deviate from conventional practice to produce realistic representations of the underlying input processes and hence yield greater fidelity in the resulting simulation output processes. In time, and with the growing understanding of the shortcomings of using classical distribution families in simulation experiments, it is our belief that these nonstandard techniques will in fact become the conventional procedures. For another approach to input modeling with no data, see Craney and White (2004). Notably missing from this article is a discussion of Bayesian techniques for simulation input modeling, a topic that we think will receive increasing attention from practitioners and researchers alike in the future. For an introduction to this topic, see Chick (1999, 2001) and Zouaoui and Wilson (2003, 2004). Additional material on techniques for simulation input modeling, including the slides for the oral presentation accompanying this article, will be posted to the Web site .
Handling Arrival Processes Having Trends and Cyclic Effects. Kuhl, Damerdji, and Wilson (1997) and Kuhl and Wilson (2001) formulate a nonparametric method for modeling and simulating arrival processes that may exhibit a long-term trend or nested periodic phenomena (such as daily and weekly cycles), where the latter effects might not necessarily possess the symmetry of sinusoidal oscillations. Called a “multiresolution” procedure because of its ability to handle nested cyclic effects, this procedure has been implemented in Web-based software by Kuhl, Sumant, and Wilson (2005). The procedure of Kuhl, Sumant, and Wilson (2005) involves the following steps at each resolution level corresponding to a basic cycle: (a) transforming the cumulative relative frequency of arrivals within the cycle (for example, the percentage of all arrivals as a function of the time of day within the daily cycle) to obtain a statistical model with approximately normal, constant-variance responses; (b) fitting a specially formulated polynomial to the transformed responses; (c) performing a likelihood ratio test to determine the degree of the fitted polynomial; and (d) fitting to the original (untransformed) responses a polynomial of the same form as in (b) with the degree determined in (c). Kuhl, Wilson, and Sumant (2005) perform a comprehensive experimental performance evaluation to demonstrate the accuracy and flexibility of the automated multiresolution procedure. The inversion scheme of Kuhl and Wilson (2001) for simulating NHPPs fitted by the multiresolution estimation procedure is substantially faster than the corresponding inversion scheme of Kuhl, Wilson, and Johnson (1997) for simulating NHPPs that have a parametric rate function of the form λ(t) = exp
�� m i=0
αi t i +
p �
REFERENCES AbouRizk, S. M., D. W. Halpin, and J. R. Wilson. 1991. Visual interactive fitting of beta distributions. Journal of Construction Engineering and Management 117 (4): 589–605. AbouRizk, S. M., D. W. Halpin, and J. R. Wilson. 1994. Fitting beta distributions based on sample data. Journal of Construction Engineering and Management 120 (2): 288–305. Alexopoulos, C., D. Goldsman, J. Fontanesi, D. Kopald, and J. R. Wilson. 2005. Modeling patient arrival times in community clinics. Omega to appear. Cario, M. C., and B. L. Nelson. 1996. Autoregressive to anything: Time series input processes for simulation. Operations Research Letters 19:51–58. Cario, M. C., and B L. Nelson. 1998. Numerical methods for fitting and simulating Autoregressive-to-Anything processes. INFORMS Journal on Computing 10 (1): 72–81. Chick, S. E. 1999. Steps to implement Bayesian input distribution selection. In Proceedings of the 1999 Winter Simulation Conference, ed. P. A. Farrington, H. B. Nembhard, D. T. Sturrock, and G. W. Evans, 317–324. Piscataway, New Jersey: Institute of Electrical and Electronics Engineers. Available online as [accessed July 25, 2005].
� γk sin(ωk t + φk ) ,
k=1
which is said to be of the type “Exponential-PolynomialTrigonometric-with-Multiple-Periodicities” (EPTMP). Rate functions of type EPTMP were originally used in the UNOS Liver Allocation Model (Pritsker et al. 1995); and although the resulting fits were remarkably accurate, the times to generate realizations of the fitted NHPPs were too large in practice. 5
CONCLUSIONS AND RECOMMENDATIONS
The common thread running through this article is the focus on robust input models that are computationally tractable
53
Lada, Steiger, Wagner, and Wilson a piecewise-polynomial rate function in a nonhomogeneous Poisson process. Management Science 34:1367– 1379. Kotz, S., N. Balakrishnan, and N. L. Johnson. 2000. Continuous multivariate distributions, Volume 1: Models and applications. 2nd ed. New York: John Wiley & Sons. Kuhl, M. E., H. Damerdji, and J. R. Wilson. 1997. Estimating and simulating Poisson processes with trends or asymmetric cyclic effects. In Proceedings of the 1997 Winter Simulation Conference, ed. S. Andradóttir, K. J. Healy, D. H. Withers, and B. L. Nelson, 287–295. Piscataway, New Jersey: Institute of Electrical and Electronics Engineers. Kuhl, M. E., J. R. Wilson, and M. A. Johnson. 1997. Estimating and simulating Poisson processes having trends or multiple periodicities. IIE Transactions 29 (3): 201–211. Kuhl, M. E., and J. R. Wilson. 2000. Least squares estimation of nonhomogeneous Poisson processes. Journal of Statistical Computation and Simulation 67:75–108. Kuhl, M. E., and J. R. Wilson. 2001. Modeling and simulating Poisson processes having trends or nontrigonometric cyclic effects. European Journal of Operational Research 133 (3): 566–582. Kuhl, M. E., S. G. Sumant, and J. R. Wilson. 2005. An automated multiresolution procedure for modeling complex arrival processes. INFORMS Journal on Computing in press. Available online via [accessed July 25, 2005]. Law, A. M., and Kelton, W. D. 2000. Simulation modeling and analysis. 3rd ed. New York: McGraw-Hill. Leemis, L. M. 1991. Nonparametric estimation of the cumulative intensity function for a nonhomogeneous Poisson process. Management Science 37 (7): 886– 900. Leemis, L. M. 2000. Nonparametric estimation of the cumulative intensity function for a nonhomogeneous Poisson process from overlapping realizations. Management Science 46 (7): 989–998. Leemis, L. M. 2004. Nonparametric estimation and variate generation for a nonhomogeneous Poisson process from event count data. IIE Transactions 36:1155–1160. Lee, S., J. R. Wilson, M. M. Crawford. 1991. Modeling and simulation of a nonhomogeneous Poisson process having cyclic behavior. Communications in Statistics— Simulation 20:777–809. Lewis, P. A. W., and G. S. Shedler. 1976. Statistical analysis of non-stationary series of events in a data base system. IBM Journal of Research and Development 20:465–482. Mardia, K. V. 1970. Families of bivariate distributions. London: Griffin.
Chick, S. E. 2001. Input distribution selection for simulation experiments: Accounting for input uncertainty. Operations Research 49 (5): 744–758. Craney, T. A., and N. White. 2004. Distribution selection with no data using VBA and Excel. Quality Engineering 16 (4): 643–656. DeBrota, D. J., R. S. Dittus, S. D. Roberts, J. R. Wilson, J. J. Swain, and S. Venkatraman. 1989a. Modeling input processes with Johnson distributions. In Proceedings of the 1989 Winter Simulation Conference, ed. E. A. MacNair, K. J. Musselman, and P. Heidelberger, 308–318. Piscataway, New Jersey: Institute of Electrical and Electronics Engineers. Available online via