Oct 11, 2013 ... 12th VI-HPS Tuning Workshop, 7-11 October 2013, JSC, Jülich. Introduction to ...
2013, JSC, Jülich. Example: XNS .... “math” Operations?
Introduction to Parallel Performance Engineering Markus Geimer, Brian Wylie Jülich Supercomputing Centre (with content used with permission from tutorials by Bernd Mohr/JSC and Luiz DeRose/Cray)
12th VI-HPS Tuning Workshop, 7-11 October 2013, JSC, Jülich
Performance: an old problem
Difference Engine
“The most constant difficulty in contriving the engine has arisen from the desire to reduce the time in which the calculations were executed to the shortest which is possible.” Charles Babbage 1791 – 1871 12th VI-HPS Tuning Workshop, 7-11 October 2013, JSC, Jülich
2
Today: the “free lunch” is over
■
Moore's law is still in charge, but ■ ■
■
Clock rates no longer increase Performance gains only through increased parallelism
Optimizations of applications more difficult ■
Increasing application complexity ■ ■
■
Multi-physics Multi-scale
Increasing machine complexity ■ ■
Hierarchical networks / memory More CPUs / multi-core
Every doubling of scale reveals a new bottleneck! 12th VI-HPS Tuning Workshop, 7-11 October 2013, JSC, Jülich
3
Example: XNS
■
CFD simulation of unsteady flows ■ ■
■
Developed by CATS / RWTH Aachen Exploits finite-element techniques, unstructured 3D meshes, iterative solution strategies
MPI parallel version ■ ■
>40,000 lines of Fortran & C DeBakey blood-pump data set (3,714,611 elements)
Partitioned finite-element mesh 12th VI-HPS Tuning Workshop, 7-11 October 2013, JSC, Jülich
Hæmodynamic flow pressure distribution 4
XNS wait-state analysis on BG/L (2007)
12th VI-HPS Tuning Workshop, 7-11 October 2013, JSC, Jülich
5
Performance factors of parallel applications
■
“Sequential” factors ■
Computation Choose right algorithm, use optimizing compiler
■
Cache and memory Tough! Only limited tool support, hope compiler gets it right
■
Input / output Often not given enough attention
■
“Parallel” factors ■ ■ ■ ■
Partitioning / decomposition Communication (i.e., message passing) Multithreading Synchronization / locking More or less understood, good tool support
12th VI-HPS Tuning Workshop, 7-11 October 2013, JSC, Jülich
6
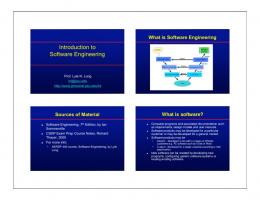
Tuning basics
■
Successful engineering is a combination of ■ ■ ■
■
The right algorithms and libraries Compiler flags and directives Thinking !!!
Measurement is better than guessing ■ ■ ■
To determine performance bottlenecks To compare alternatives To validate tuning decisions and optimizations After each step!
12th VI-HPS Tuning Workshop, 7-11 October 2013, JSC, Jülich
7
However…
“We should forget about small efficiencies, say 97% of the time: premature optimization is the root of all evil.” Charles A. R. Hoare
■
It's easier to optimize a slow correct program than to debug a fast incorrect one Nobody cares how fast you can compute a wrong answer...
12th VI-HPS Tuning Workshop, 7-11 October 2013, JSC, Jülich
8
Performance engineering workflow
Preparation
Measurement
Analysis
Examination
Optimization
12th VI-HPS Tuning Workshop, 7-11 October 2013, JSC, Jülich
■
Prepare application (with symbols), insert extra code (probes/hooks)
■
Collection of data relevant to execution performance analysis
■
Calculation of metrics, identification of performance metrics
■
Presentation of results in an intuitive/understandable form
■
Modifications intended to eliminate/reduce performance problems
9
The 80/20 rule
■ ■
Programs typically spend 80% of their time in 20% of the code Programmers typically spend 20% of their effort to get 80% of the total speedup possible for the application Know when to stop!
■
Don't optimize what does not matter Make the common case fast! “If you optimize everything, you will always be unhappy.” Donald E. Knuth
12th VI-HPS Tuning Workshop, 7-11 October 2013, JSC, Jülich
10
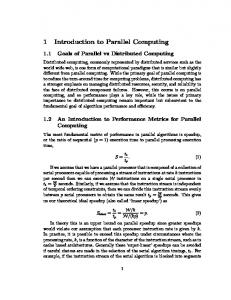
Metrics of performance
■
What can be measured? ■
A count of how often an event occurs ■
■
The duration of some interval ■
■
E.g., the time spent these send calls
The size of some parameter ■
■
E.g., the number of MPI point-to-point messages sent
E.g., the number of bytes transmitted by these calls
Derived metrics ■ ■
E.g., rates / throughput Needed for normalization
12th VI-HPS Tuning Workshop, 7-11 October 2013, JSC, Jülich
11
Example metrics
■ ■ ■
Execution time Number of function calls CPI ■
■
CPU cycles per instruction
FLOPS ■
Floating-point operations executed per second
“math” Operations? HW Operations? HW Instructions? 32-/64-bit? …
12th VI-HPS Tuning Workshop, 7-11 October 2013, JSC, Jülich
12
Execution time
■
Wall-clock time ■ ■
■
Includes waiting time: I/O, memory, other system activities In time-sharing environments also the time consumed by other applications
CPU time ■ ■
Time spent by the CPU to execute the application Does not include time the program was context-switched out ■ ■
■
Problem: Does not include inherent waiting time (e.g., I/O) Problem: Portability? What is user, what is system time?
Problem: Execution time is non-deterministic ■
Use mean or minimum of several runs
12th VI-HPS Tuning Workshop, 7-11 October 2013, JSC, Jülich
13
Inclusive vs. Exclusive values
■
Inclusive ■
■
Information of all sub-elements aggregated into single value
Exclusive ■
Information cannot be subdivided further int foo() { int a; a = 1 + 1; Inclusive
bar();
Exclusive
a = a + 1; return a; } 12th VI-HPS Tuning Workshop, 7-11 October 2013, JSC, Jülich
14
Classification of measurement techniques
■
How are performance measurements triggered? ■ ■
■
How is performance data recorded? ■ ■
■
Sampling Code instrumentation
Profiling / Runtime summarization Tracing
How is performance data analyzed? ■ ■
Online Post mortem
12th VI-HPS Tuning Workshop, 7-11 October 2013, JSC, Jülich
15
Sampling t1
t2
t3
t4
t5
t6
t7
t8
t9 Time
main
foo(0)
foo(1)
int main() { int i;
foo(2)
■
for (i=0; i < 3; i++) foo(i); return 0;
Measurement
Running program is periodically interrupted to take measurement ■
Timer interrupt, OS signal, or HWC overflow
■
Service routine examines return-address stack
■
Addresses are mapped to routines using symbol table information
} void foo(int i) {
■
if (i > 0) foo(i – 1); }
■
Statistical inference of program behavior ■
Not very detailed information on highly volatile metrics
■
Requires long-running applications
Works with unmodified executables
12th VI-HPS Tuning Workshop, 7-11 October 2013, JSC, Jülich
16
Instrumentation t1
t2
t3 t4
t5
t6 t7 t8
t9
t10
t11t12t13 t14 Time
main
foo(0)
foo(1)
int main() { int i; Enter(“main”); for (i=0; i < 3; i++) foo(i); Leave(“main”); return 0; } void foo(int i) { Enter(“foo”); if (i > 0) foo(i – 1); Leave(“foo”); }
foo(2)
■
Measurement
Measurement code is inserted such that every event of interest is captured directly ■
■
Advantage: ■
■
Can be done in various ways
Much more detailed information
Disadvantage: ■
Processing of source-code / executable necessary
■
Large relative overheads for small functions
12th VI-HPS Tuning Workshop, 7-11 October 2013, JSC, Jülich
17
Instrumentation techniques
■
Static instrumentation ■
■
Dynamic instrumentation ■
■
Program is instrumented prior to execution Program is instrumented at runtime
Code is inserted ■ ■
Manually Automatically ■ ■ ■ ■
By a preprocessor / source-to-source translation tool By a compiler By linking against a pre-instrumented library / runtime system By binary-rewrite / dynamic instrumentation tool
12th VI-HPS Tuning Workshop, 7-11 October 2013, JSC, Jülich
18
Critical issues
■
Accuracy ■
Intrusion overhead ■
■
Perturbation ■ ■
■
■
Measurement itself needs time and thus lowers performance Measurement alters program behaviour E.g., memory access pattern
Accuracy of timers & counters
Granularity ■ ■
How many measurements? How much information / processing during each measurement?
Tradeoff: Accuracy vs. Expressiveness of data
12th VI-HPS Tuning Workshop, 7-11 October 2013, JSC, Jülich
19
Classification of measurement techniques
■
How are performance measurements triggered? ■ ■
■
How is performance data recorded? ■ ■
■
Sampling Code instrumentation
Profiling / Runtime summarization Tracing
How is performance data analyzed? ■ ■
Online Post mortem
12th VI-HPS Tuning Workshop, 7-11 October 2013, JSC, Jülich
20
Profiling / Runtime summarization
■
Recording of aggregated information ■
■
Total, maximum, minimum, …
For measurements ■ ■
Time Counts ■ ■ ■
■
Function calls Bytes transferred Hardware counters
Over program and system entities ■ ■
Functions, call sites, basic blocks, loops, … Processes, threads
Profile = summarization of events over execution interval 12th VI-HPS Tuning Workshop, 7-11 October 2013, JSC, Jülich
21
Types of profiles
■
Flat profile ■ ■
■
Call-path profile ■ ■
■
Shows distribution of metrics per routine / instrumented region Calling context is not taken into account Shows distribution of metrics per executed call path Sometimes only distinguished by partial calling context (e.g., two levels)
Special-purpose profiles ■ ■
Focus on specific aspects, e.g., MPI calls or OpenMP constructs Comparing processes/threads
12th VI-HPS Tuning Workshop, 7-11 October 2013, JSC, Jülich
22
Tracing
■
Recording information about significant points (events) during execution of the program ■ ■
■
Save information in event record ■ ■
■
Enter / leave of a region (function, loop, …) Send / receive a message, … Timestamp, location, event type Plus event-specific information (e.g., communicator, sender / receiver, …)
Abstract execution model on level of defined events
Event trace = Chronologically ordered sequence of event records
12th VI-HPS Tuning Workshop, 7-11 October 2013, JSC, Jülich
23
Event tracing
Local trace A
...
Process A
instrument Process B void bar() {{ trc_enter("bar"); ... recv(A, tag, buf); trc_recv(A); ... trc_exit("bar"); }
MONITOR
58 ENTER
1
62 SEND
B
64 EXIT
1
... 1 synchronize(d)
void foo() { trc_enter("foo"); ... trc_send(B); send(B, tag, buf); ... trc_exit("foo"); }
Global trace view
foo
... Local trace B
60 ENTER
1
68 RECV
A
69 EXIT
1
... MONITOR
...
58 A
ENTER
1
60 B
ENTER
2
62 A
SEND
B
64 A
EXIT
1
68 B
RECV
A
69 B
EXIT
2
...
...
1
...
bar
merge unify 1
foo
2
bar
...
Tracing vs. Profiling
■
Tracing advantages ■ ■ ■
Event traces preserve the temporal and spatial relationships among individual events ( context) Allows reconstruction of dynamic application behaviour on any required level of abstraction Most general measurement technique ■
■
Profile data can be reconstructed from event traces
Disadvantages ■ ■ ■
Traces can very quickly become extremely large Writing events to file at runtime causes perturbation Writing tracing software is complicated ■
Event buffering, clock synchronization, ...
12th VI-HPS Tuning Workshop, 7-11 October 2013, JSC, Jülich
25
Classification of measurement techniques
■
How are performance measurements triggered? ■ ■
■
How is performance data recorded? ■ ■
■
Sampling Code instrumentation
Profiling / Runtime summarization Tracing
How is performance data analyzed? ■ ■
Online Post mortem
12th VI-HPS Tuning Workshop, 7-11 October 2013, JSC, Jülich
26
Online analysis
■
■
Performance data is processed during measurement run ■
Process-local profile aggregation
■
More sophisticated inter-process analysis using ■
“Piggyback” messages
■
Hierarchical network of analysis agents
Inter-process analysis often involves application steering to interrupt and re-configure the measurement
12th VI-HPS Tuning Workshop, 7-11 October 2013, JSC, Jülich
27
Post-mortem analysis
■
Performance data is stored at end of measurement run
■
Data analysis is performed afterwards ■
Automatic search for bottlenecks
■
Visual trace analysis
■
Calculation of statistics
12th VI-HPS Tuning Workshop, 7-11 October 2013, JSC, Jülich
28
Example: Time-line visualization
1
foo
2
bar
3
...
main foo bar
... 58 A
ENTER
1
60 B
ENTER
2
62 A
SEND
B
64 A
EXIT
1
68 B
RECV
A
69 B
EXIT
2
A B
... 58 60 62 64 66 68 70 12th VI-HPS Tuning Workshop, 7-11 October 2013, JSC, Jülich
29
No single solution is sufficient!
A combination of different methods, tools and techniques is typically needed! ■
Analysis ■
■
Measurement ■
■
Statistics, visualization, automatic analysis, data mining, ... Sampling / instrumentation, profiling / tracing, ...
Instrumentation ■
Source code / binary, manual / automatic, ...
12th VI-HPS Tuning Workshop, 7-11 October 2013, JSC, Jülich
30
Typical performance analysis procedure
■
Do I have a performance problem at all? ■
■
What is the key bottleneck (computation / communication)? ■
■
Call-path profiling, detailed basic block profiling
Why is it there? ■
■
MPI / OpenMP / flat profiling
Where is the key bottleneck? ■
■
Time / speedup / scalability measurements
Hardware counter analysis, trace selected parts to keep trace size manageable
Does the code have scalability problems? ■
Load imbalance analysis, compare profiles at various sizes function-by-function
12th VI-HPS Tuning Workshop, 7-11 October 2013, JSC, Jülich
31