Bill Schindel
[email protected]
Troy Peterson
[email protected]
Introduction to Pattern-Based Systems Engineering (PBSE): Leveraging MBSE Techniques
INCOSE Great Lakes Regional Conference 2016 1.5.3
Copyright © 2016 by Bill Schindel and Troy Peterson Published and used by INCOSE with permission
1.7.4
Abstract •
•
•
•
•
This tutorial is a (half day) practitioner’s introduction to Pattern-Based Systems Engineering (PBSE), including a specific system domain illustration. (For those seeking a shorter awareness briefing on PBSE, a single-session overview is also provided during the conference technical sessions.) INCOSE thought leaders have discussed the need to address 10:1 more complex systems with 10:1 reduction in effort, using people from a 10:1 larger community than the “systems expert” group INCOSE currently reaches. The INCOSE Patterns Working Group describes PBSE to enable INCOSE membership, and the larger systems community beyond INCOSE, to achieve such order-of-magnitude improvements. PBSE leverages the power of Model-Based Systems Engineering (MBSE) to rapidly deliver benefits to a larger community. Projects using PBSE get a “learning curve jumpstart” from an existing Pattern, gaining the advantages of its content, and improve that pattern with what they learn, for future users. The major aspects of PBSE have been defined and practiced some years across a number of enterprises and domains, but with limited INCOSE community awareness. Addressing this, the INCOSE PBSE Challenge Team was started in 2013 as a part of the INCOSE/OMG MBSE Initiative, and it later became the INCOSE Patterns Working Group. This tutorial is for SE practitioners. page 2
Contents—Summary • • • • • • •
The need, call-to-arms, and vision Conceptual summary of PBSE PBSE applications to date Representing system patterns: An example Applying system patterns: Example uses and benefits Challenges and opportunities Conclusions
• References
page 3
Contents—Detail & Timeline • • • •
The need, call-to-arms, and vision Conceptual summary of PBSE PBSE applications to date Representing system patterns: An example – – –
S*Metamodel framework A Vehicle Pattern in SysML A practice exercise
1:00 – 2:30
Coffee Break
•
Applying system patterns: Examples of uses and benefits 1. 2. 3. 4. 5. 6.
•
Stakeholder Features and Scenarios: Better stakeholders alignment sooner Pattern Configuration: Generating better requirements faster Selecting Solutions: More informed trades Design for Change: Analyzing and improving platform resiliency Risk Analysis: Pattern-enabled FMEAs Verification: Generating better tests and reviews faster
3:00 – 4:30
Challenges and opportunities: – – –
Human nature & organizations Approaches to my situation Exercise and discussion
•
Conclusions
•
References
page 4
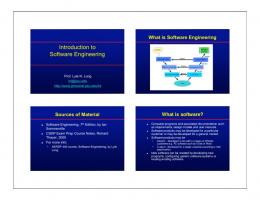
PBSE Addresses Speed, Leverage, Knowledge – INCOSE thought leaders have discussed the growing need to address 10:1 more complex systems with 1:10 reduction in time and effort, using people from a 10:1 larger community than the “systems expert” group – Many other SE efforts (other than leveraging system patterns) are in some way concerned with growing in complexity, but don’t offer evidence of the sweeping order-of-magnitude improvements demanded by this call-to-arms. – PBSE is a methodical way to achieve this order-of-magnitude improvement
page 5
Source: Microsoft, published in the INCOSE SE Handbook
1905 ~83 yrs. 1952 ~44 yrs. 1986 ~14 yrs.
Rates of system proliferation decreased by 4:1 over 50 years
Pattern-Based Systems Engineering (PBSE) • What are System Patterns?
• What are System Patterns for?
page 6
Pattern-Based Systems Engineering (PBSE)
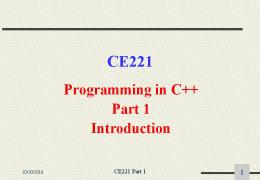
• Standard Parts have been a great aid to progress:
• The same part type can be used to make many things!
page 7
Quick Exercise: Can you recognize this system?
page 8
Using different views helps improve recognition: Does rotating the parts improve recognition?
page 9
Showing parts in relationship helps recognition
page 10
Can we identify a system from its parts alone?
Obviously not in many cases—and in all cases, the parts list alone lacks critical information . . . page 11
Any systems engineer will tell you . . . • We need to know the relationships between the parts to understand what the “system” they create.
Physical Architecture page 12
But . . . we are interested in much more than Physical Architecture: • • • • • • • •
Stakeholders Requirements Design Interfaces Modes Performance Failure Modes & Effects Verification Plans
• • • • • • • •
page 13
Alternatives Configurability Manufacturability Maintainability Operability Reliability Risks etc., etc., etc.
And, in an “information sense”, . . . we can still think of all these as kinds of “parts”—not just physical parts of a system, but parts of a system model: • • • • • • • •
Stakeholders Requirements Design Interfaces Modes Performance Failure Modes & Effects Verification Plans
• • • • • • • •
page 14
Alternatives Configurability Manufacturability Maintainability Operability Reliability Risks etc., etc., etc.
And, once again, it turns out that . . . the relationships between these information components is just as important as the lists of them, taken alone: • • • • • • • •
Stakeholders Requirements Design Interfaces Modes Performance Failure Modes & Effects Verification Plans
• • • • • • • •
Physical Architecture
Alternatives Configurability Manufacturability Maintainability Operability Reliability Risks etc., etc., etc. Information Architecture
?? page 15
And, once again, it turns out that . . . the relationships between these information components is just as important as the lists of them, taken alone: • • • • • • • •
Stakeholders Requirements Design Interfaces Modes Performance Failure Modes & Effects Verification Plans
• • • • • • • •
Physical Architecture
Alternatives Configurability Manufacturability Maintainability Operability Reliability Risks etc., etc., etc. Information Architecture
?? page 16
Taking advantage of Model-Based Systems Engineering (MBSE) – An S* Model is a description of all those important things, and the relationships between them. – Typically expressed in the “views” of some modeling language (e.g., SysML™). – The S* Metamodel: The smallest set of information sufficient to describe a system for systems engineering purposes. – Includes not only the physical Platform information, but all the extended system information (e.g., requirements, risk analysis, design trade-offs & alternatives, decision processes, etc.):
page 17
Extending the Concept to Patterns, and Pattern-Based Systems Engineering (PBSE) – An S* Pattern is a configurable, re-usable S* Model. It is an extension of the idea of a Platform (which is a configurable, re-usable design) or Enterprise / Industry Framework. – The Pattern includes not only the physical Platform information, but all the extended system information (e.g., pattern configuration rules, requirements, risk analysis, design trade-offs & alternatives, decision processes, etc.):
General Vehicle Pattern Vehicle Product Lines Specific Vehicle Configurations
Same S*Metamodel at each level
page 18
Concept Summary: Pattern-Based Systems Engineering (PBSE) – By including the appropriate S* Metamodel concepts, these can readily be managed in (SysML or other) preferred modeling languages and MBSE tools—the ideas involved here are not specific to a modeling language or specific tool. – The order-of-magnitude changes have been realized because projects that use PBSE rapidly start from an existing Pattern, gaining the advantages of its content, and feed the pattern with what they learn, for future users. – The “game changer” here is the shift from “learning to model” to “learning the model”, freeing many people to rapidly configure, specialize, and apply patterns to deliver value in their model-based projects.
General Vehicle Pattern Vehicle Product Lines Specific Vehicle Configurations
Same S*Metamodel at each level
page 19
Concept Summary: Pattern-Based Systems Engineering (PBSE) • PBSE provides a specific technical method for implementing: – – – – –
Platform Management and Product Line Engineering (PLE) Enterprise or Industry Frameworks System Standards Experience Accumulation for Systems of Innovation Lean Product Development & IP Asset Re-use
page 20
“Learn to Model”
“Learn the Model”
Traditional SE
Model-Based SE (MBSE)
Pattern-Based SE (PBSE/MBSE)
Ratio
Ratio
Comparative Benefits and Costs Summary COMPARATIVE ROI
QUALITATIVE ANALYSIS Benefits to Users of System Descriptions (Recurring Benefit Per Project)
Investment Per Project (Recurring Cost Per Project)
Cost to Support Methodology (Small group per Enterprise, not Project Recurring)
erstanding prove Und Models Im ects Within Proj
Ratio
ROI: Ratio of Benefits (below) to Investment (below) (Recurring ROI Per Project)
ding and ve Understan nuously Impro terprise En d Patterns Conti an cts s Proje Content Acros
(1X Scale)
(10X Scale)
d Only rs Nee attern Creato Model Model from P ure Config
Model Creators Mu st Create and Validate Model (possibly also learning to model)
Methodology Go vernance Must Accommodate Modeling Rules
Pattern Creators Must Manage IP Portfo lio Asset
page 21
Status of PBSE – The major aspects of PBSE have been defined and practiced for years across a number of enterprises and domains, but with limited integration or awareness within INCOSE community: Medical Device Patterns
Construction Equipment Patterns
Commercial Vehicle Patterns
Space Tourism Pattern
Manufacturing Process Patterns
Vision System Patterns
Packaging System Patterns
Lawnmower Pattern
Embedded Intelligence Patterns
Systems of Innovation (SOI) Pattern
Baby Product Pattern
Orbital Satellite Pattern
Development Process Patterns
Production Material Handling Patterns
Engine Controls Patterns
Military Radio Systems Pattern
– What makes these “PBSE” applications? • Each is based on an MBSE model of requirements, and often designs, failure modes, other aspects; • Each is a generalized model (pattern) that is configurable to different specific applications, market segments, customers, or situations; • Each is based on the underlying S*Metamodel. – The PBSE Tutorial is more about integration of proven methods and INCOSE community awareness and capability than about technically establishing a new method—although it may look new to INCOSE practitioners.
– We recognize that the human change aspect can be the most challenging – but are not suggesting that we also have to create new technical methods. We are introducing PBSE to a larger community.
Representing system patterns: An example • S*Metamodel framework • A Vehicle Pattern in SysML • An Exercise
page 23
Representing System Patterns: The S* Metamodel Framework
• What is the smallest amount of information we need to represent pattern regularities? – Some people have used prose to describe system regularities. – This is better than nothing, but usually not enough to deal with the spectrum of issues in complex systems.
• We use S* Models, which are the minimum model-based information necessary: – This is not a matter of modeling language—your current favorite language and tools can readily be used for S* Models. – The minimum underlying information classes are summarized in the S* Metamodel, for use in any modeling language.
• The resulting system model is made configurable and reusable, thereby becoming an S* Pattern. page 24
Representing System Patterns: The S* Metamodel Framework • A metamodel is a model of other models; – Sets forth how we will represent Requirements, Designs, Verification, Failure Analysis, Trade-offs, etc.; – We utilize the (language independent) S* Metamodel from Systematica™ Methodology: Simple summary of detailed S* Metamodel.
• The resulting system models may be expressed in SysML™, other languages, DB tables, etc. • Has been applied to systems engineering in aerospace, transportation, medical, advanced manufacturing, communication, construction, other domains. page 25
Definitions of some S* Metamodel Classes • • • •
•
•
System: A collection of interacting components. Example: Vehicle; Vehicle Domain System. Stakeholder: A person or other entity with something at stake in the life cycle of a system. Example: Vehicle Operator; Vehicle Owner; Pedestrian Feature: A behavior of a system that carries stakeholder value. Example: Automatic Braking System Feature; Passenger Comfort Feature Group Functional Interaction (Interaction): An exchange of energy, force, mass, or information by two entities, in which one changes the state of the other. Example: Refuel Vehicle; Travel Over Terrain Functional Role (Role): The behavior performed by one of the interacting entities during an Interaction. Example: Vehicle Operator; Vehicle Passenger Environment Subsystem Input-Output: That which is exchanged during an interaction (generally associated with energy, force, mass, or information). Example: Fuel, Propulsion Force, Exhaust Gas General Vehicle
Ambulance page 26
Definitions of some S* Metamodel Classes •
•
• •
•
System of Access: A system which provides the means for physical interaction between two interacting entities. Examples: Fueling Nozzle-Receptacle; Grease Gun Fitting; Steering Wheel; Dashboard; Brake Peddle Interface: The association of a System (which “has” the interface), one or more Interactions (which describe behavior at the interface), the Input-Outputs (which pass through the interface), and a System of Access (which provides the means of the interaction). Examples: Operator Interface; GPS Interface State: A mode, situation, or condition that describes a System’s condition at some moment or period of time. Example: Starting; Cruising; Performing Maneuvers Design Component: A physical entity that has identity, whose behavior is described by Functional Role(s) allocated to it. Examples: Garmin Model 332 GPS Receiver; Michelin Model 155 Tire Requirement Statement: A (usually prose) description of the behavior expected of (at least part of) a Functional Role. Example: “The System will accept inflow of fuel at up to 10 gallons per minute without overflow or spillage.”
page 27
Physical Interactions: At the heart of S* models • S* models represent Interactions as explicit objects: – Goes to the heart of 300 years of natural science of systems as a foundation for engineering, including emergence. – All physical laws of science are about interactions in some way. – All functional requirements are revealed as external interactions (!)
• Other Metamodel parts: See the Vehicle Pattern example. page 28
Physical Interactions: At the heart of S* models • S* models represent Physical Interactions as explicit objects: Vehicle Pattern Interactions Metamodel
Aspirate: The interaction of the vehicle with the Local Atmosphere, through which air is taken into the vehicle for operational purposes, and gaseous emissions are expelled into the atmosphere.
Interaction Diagram
page 29
Pattern-based systems engineering (PBSE) • Model-based Patterns: – In this approach, Patterns are reusable, configurable S* models of families (product lines, sets, ensembles) of systems. – A Pattern is not just the physical product family—it includes its behavior, decomposition structure, failure modes, and other aspects of its model.
• These Patterns are ready to be configured to serve as Models of individual systems in projects. • Configured here is specifically limited to mean that: – Pattern model components are populated / de-populated, and – Pattern model attribute (parameter) values are set – both based on Configuration Rules that are part of the Pattern.
• Patterns based on the same Metamodel as “ordinary” Models page 30
Pattern-based systems engineering (PBSE) • Pattern-Based Systems Engineering (PBSE) has two overall processes: – Pattern Management Process: Creates the general pattern, and periodically updates it based on application project discovery and learning; – Pattern Configuration Process: Configures the pattern into a specific model configuration (e.g., a new product) for application in a project.
We’ll discuss examples from both processes in this tutorial.
page 31
Pattern configurations • • • •
A table of configurations illustrates how patterns facilitate compression; Each column in the table is a compressed system representation with respect to (“modulo”) the pattern; The compression is typically very large; The compression ratio tells us how much of the pattern is variable and how much fixed, across the family of potential configurations.
page 32
Checking holistic alignment to a pattern
• Gestalt Rules express what is meant by holistic conformance to a pattern: – Expressing regularities of whole things, versus same “parts”
Governing pattern
Candidate model configuration—does it conform to pattern? page 33
The Gestalt Rules 1. 2.
3.
Every component class in the candidate model must be a subclass of a parent superclass in the pattern—no “orphan classes”. Every relationship between component classes must be a subclass of a parent relationship in the pattern, and which must relate parent superclasses of those same component classes—no “orphan relationships”. Refining the pattern superclasses and their relationships is a permissible way to achieve conformance to (1) and (2).
Governing pattern Candidate model configuration—does it conform to pattern?
Example: State Model Pattern—illustrates how visual is the “class splitting” and “relationship rubber banding” of the Gestalt Rules
page 35
A vehicle pattern in SysML
page 36
Vehicle Pattern: Model Organization (Packages)
page 37
Vehicle Features Model
page 38
Vehicle Features Model
The feature of targeted configurations of the vehicle being developed at an acceptable cost in an acceptable time, with acceptable risk.
The feature of being capable of being efficiently arranged or rearranged, adjusted or altered for a different use within the limitations of the current design. This includes support for maintaining awareness of the current or other configurations of the system.
page 39
Vehicle Domain Model
page 40
Vehicle State Model
page 41
Vehicle Interaction Model
pkg Interactions
«Interaction» Travel Over Terrain
«Interaction» Refuel Vehicle
«Interaction» Interact with Operator
«Interaction» Manage Vehicle Performance
«Interaction» Attack Hostile System
«Interaction» Avoid Obstacle
«Interaction» Aspirate
«Interaction» Navigate
«Interaction» Configure Vehicle
«Interaction» Survive Attack
«Interaction» Interact with Higher Control
«Interaction» Maintain System
«Interaction» Perform Application
«Interaction» Ride in Vehicle «Interaction» Interact with Nearby Vehicle
«Interaction» Deliver Vehicle
«Interaction» Perform Dock Approach & Departure
«Interaction» Transport Vehicle
«Interaction» Account for System «Interaction» View Vehicle
«Interaction» Secure Vehicle
page 42
Vehicle Interactions: Which Actors Participate in Interaction?
page 43
Vehicle Feature-Interaction Associations
page 44
Logical Architecture Model
page 45
Logical Architecture Model The vehicle logical subsystem responsible for managing vehicle-level performance, configuration, faults, security, or accounting. This includes interaction with external management systems, including the vehicle operator.
The vehicle logical subsystem responsible for transmitting forces and maintaining structural integrity of the overall vehicle. This includes smoothing of dynamical forces during travel across uneven terrain.
page 46
The vehicle logical subsystem responsible for storing chemical, electrical, or mechanical energy until needed, and converting that energy into forms useful for propulsion or internal consumption.
Physical Architecture Model
page 47
Allocation of Logical Roles to Physical Architecture
page 48
Allocation of Logical Roles to Physical Architecture
• Same Logical Architecture covers many Physical Architectures:
page 49
Attribute Coupling Model
page 50
Logical Architecture Views Block Diagram and Design Structure Matrix (DSM)
• The structure shown in these architectural diagrams can also be expressed in matrix form – These matrices are known as: N2 matrices, Adjacency Matrices and Design or Dependency Structure Matrices (DSMs) – N2 because their column and row headings are identical, with the matrix cells showing “marks” indicating relationships between components.
Logical Arch. Diagram
DSM .
page 51
Logical Architecture Views Block Diagram and Design Structure Matrix (DSM)
• In the case of Logical Architecture: – The blocks in the LA diagram become rows and columns of the DSM – The connection lines in the LA diagram become marks in the DSM
• Both views are visualizations of the same information: – However the functionality has been partitioned into interacting subsets – Vehicle Functional Roles and Interfaces in this case.
Logical Arch. Diagram
DSM .
page 52
Physical Architecture Views Block Diagram and Design Structure Matrix (DSM)
• In the case of Physical Architecture: – The blocks in the LA diagram become rows and columns of the DSM – The connection lines in the LA diagram become subsystems or components in the DSM shown in rows and columns
• Both views provide visualizations of hierarchy – How the physical system has been partitioned into physical sub-systems that are physically related (connected, contained, adjacent, etc.) – The DSM additionally shows the interactions of subsystems
Physical Arch. Diagram
DSM .
page 53
Domain Structure Matrix (DSM) View of Same • In the case of Coupled Parameters (attributes): – Attributes become row and column headings in the DSM – This includes adding rows and columns to the Logical Architecture DSM, showing attributes of the Logical Subsystems – Connection lines in the drawing become marked cells in the DSM
• Both views convey the same information: – Which attributes are coupled (impact each others’ values)
• • • • Parametric Diagram
DSM .
page 54
Domain Structure Matrix (DSM) View of Same • Instead of just showing which attributes are coupled, the DSM (like the Parametric Diagram) can also symbolize the named Coupling that connects them: – This provides a reference to a (separately documented) quantitative coupling description.
• The names of the couplings can be introduced as row and column headings, separate from the rows and columns that list the attribute names: – This becomes a Multi-Domain Matrix (MDM):
Parametric Diagram
DSM .
page 55
Requirement Statements
page 56
Failure Modes Model Physical Entity
Failure Mode
Vehicle ECM
Dead ECM
Vehicle ECM
Network Connector Open
Vehicle ECM
Network Connector Short
Vehicle ECM
Erratic ECM
Battery Battery
Battery Cell Short
Battery
Battery Cell Open
Battery
Battery Leak
Panel Display
Fractured Display
Panel Display
Illuminator Fail
Bluetooth Module
Module Hard Fail
Bluetooth Module
Transmitter Fail
Bluetooth Module
Receiver Fail page 57
Filling in the Feature Population Form— with Stakeholder Needs
page 58
Resulting Auto-Populated Requirements
page 59
Break out: Practice exercise • For the Vehicle Pattern: – Think of some Vehicle Application – Fill in the Feature Configuration Form for your application – Did you need any new Features not in the Vehicle Pattern?
• For your own Pattern: Interactions – Think of a new Interaction between the Vehicle and some Actor (you can add a new Actor) – Create an Interaction Diagram – Write requirements on the Vehicle for this Interaction
• Group Discussion of Exercise page 60
Applying system patterns • Example Uses and Benefits: 1. Stakeholder Features and Scenarios: Better stakeholder alignment sooner 2. Pattern Configuration: Generating better requirements faster 3. Selecting Solutions: More informed trade-offs 4. Design for Change: Analyzing and improving platform resiliency 5. Risk Analysis: Pattern-enabled FMEAs 6. Verification: Generating better tests faster • At the end: What seems most important?
page 61
1. Stakeholder Features and Scenarios: Better stakeholders alignment sooner • Alignment with stakeholders is critical to program success. • That alignment can be achieved earlier and maintained stronger using: – Stakeholder Feature Pattern: Aligns understanding of system capabilities (base as well as options) and the nature of their value to stakeholders – Scenario Pattern: Aligns understanding of the concepts of operations, support, manufacture, distribution, other life cycle situations; accelerates alignment of system documentation, training, and communication.
• Both of these are “pattern configurations” directly generated from the System Pattern—not separate and unsynchronized information. page 62
1. Using the Feature Pattern to Rapidly Capture & Validate Stakeholder Requirements: An Example • Concept: The Feature Pattern is a powerful tool for establishing Stakeholder Requirements—as a “configuration” of Feature Pattern. • By “configuration”, we mean that individual Features from the Pattern are (1) either populated or de-populated, and (2) their Feature Attributes (parameters) are given values:
• These can be expressed (1) as configured Feature objects and their attribute values or (2) as sentence-type statements if desired, but in any case the degrees of freedom (stakeholder choices) are brought into clear focus. page 63
Using the Feature Pattern to Rapidly Capture & Validate Stakeholder Requirements: An Example Feature Pattern
Stakeholder Interview Template
Populates the questions & issues
Stakeholder Requirements Document
Stakeholder Interview Process Generates
page 64
1. Using the Feature Pattern to Rapidly Capture & Validate Stakeholder Requirements: An Example
page 65
1. Using the Feature Pattern to Rapidly Capture & Validate Stakeholder Requirements: An Example
page 66
1. Using the Feature Pattern to Rapidly Capture & Validate Stakeholder Requirements • Benefits: – A more complete set of stakeholder requirements—reduce omissions; – Stronger alignment with stakeholders, sooner—surface issues earlier; – Pattern identifies classes of stakeholders that might have been missed; – Pattern makes very clear the difference between Stakeholder Requirements versus Design Constraints or Technical Requirements; – The Pattern provides a clear place to accumulate new learning (e.g., additional Features); – Sets up subsequent uses of Feature Pattern in support of Trade Space, Risk Management, FMEA “effects”, and other applications. • No free lunch: – Interviewer needs to be knowledgeable about the Features; – Stakeholders won’t have all the answers—find the right representative; – Stakeholder representatives need know they are formal representatives; – The Feature Pattern needs to be relatively complete. page 67
How do I know whether I have all the Features? • This is why we use a Pattern! – Moves problem to the builder of the original pattern, plus maintainer.
• Related key points for the builder of the Feature Pattern: – – – – –
First, identify all the Stakeholder classes Then, all the Features for each Stakeholder class Validate the Features with their Stakeholder Representatives Then, make sure all the Interactions are reviewed for associated Feature value There are well-known abstract Feature classes (e.g., Maintainability)
• Every time we discover another Feature, we add it to the Pattern; for example: – Every argument / decision should invoke trade space Features as its ultimate rationale – a new one might appear during an argument. – Every impactful Failure Mode should cause Feature impacting Effects – a new one might appear while discussing a Failure Mode. page 68
1. Using the Interactions & States Pattern to Rapidly Generate & Validate Scenarios: An Example
• Concept: Scenarios can be efficiently generated, as single thread tracings through the configured pattern State Model; • Each scenario “tells a story” within the system’s life cycle— operations, maintenance, or other CONOPS type view; • Early in life cycle: Stakeholders validate (or give feedback) scenario; • Later in life cycle: Generates base data for training and documentation, as well as test plans; • Akin to typical Use Case process, but easier maintained ongoing as a part of the configured pattern; • Reference: Operational Views (OV) page 69
The interaction of the vehicle with the terrain over which it travels, by means of which the vehicle moves over the terrain.
Perform Application
The interaction of the vehicle with an external Application System, through which the vehicle performs a specialized application.
Avoid Obstacle
The interaction of the vehicle with an external object, during which the vehicle minimizes contact with or proximity to the object.
Ride In Vehicle
The interaction of the vehicle with its occupant(s) during, before, or after travel by the vehicle.
View Vehicle
The interaction of the vehicle with an external viewer, during which the viewer observes the vehicle.
Maintain System
The interaction of the vehicle with a maintainer and/or maintenance system, through which faults in the vehicle are prevented or corrected, so that the intended qualified operating state of the vehicle is maintained.
X
X
X
X
X
X
X
X
X
X Aspirate
Local Terrain
X
X
X
X
X
The interaction of the vehicle with the Local Atmosphere, through which air is taken into the vehicle for operational purposes, and gaseous emissions are expelled into the atmosphere.
X Refuel Vehicle
The interaction of the vehicle with a fueling system and its operator, through which fuel is added to the vehicle.
Survive Attack
The interaction of the vehicle with an external hostile system, during which the vehicle protects its occupants and minimizes damage to itself.
Attack Hostile System
The interaction of the vehicle with an external hostile system, during which the vehicle projects an attack onto the hostile system's condition.
Interact with Traffic Control
The interaction of the vehicle with an external traffic control system, through which fhe vehicle is fit into larger scale traffic objectives.
Transport Vehicle
The interaction of the vehicle with a Vehicle Transport System, through which the Vehicle is transported to an intended destination.
Perform Dock Approach & Departure
The interaction of the vehicle with an external docking system, through which the vehicle arrives at, aligns with, or departs from a loading / unloading dock.
X
X
X
X
X
X
X
X
X
X
X
X Secure Vehicle
The interaction of the vehicle with external actors that may or may not have privileges to access or make use of the resources of the vehicle, or with actors managing that vehicle security.
Configure Vehicle
The interaction of the vehicle with people or systems that manage its arrangement or configuration for intended use.
Manage Vehicle Performance
The interaction of the vehicle with its operator and/or external management system, through which the performance of the vehicle is managed to achieve its operational purpose and objectives.
X
X
X
X
X
X
X
X
Operational (or other) Scenario Model
Populates States, Interactions
Concept of Operations Concept of Document Operations Concept of Document Operations Document
Remote Management System
Vehicle Transport System
Curb & Dock System
Load
Nearby Vehicle
Traffic Control System
Hostile System
Application System
External Attachment
Maintainer
Refuel System
Local Atmosphere
External Observer
Nearby Pedestrian
Maintenance System
Vehicle
Operator
Passenger
Definition
Travel Over Terrain
Vehicle Occupant
Interaction Name
Interactions & States Pattern
Global Region
1. Using the Interactions & States Pattern to Rapidly Generate & Validate Scenarios: An Example
Scenario Validation Process Generates
page 70
1. Using the Interactions & States Pattern to Rapidly Generate & Validate Scenarios: An Example Scenario plan as state model tracing:
page 71
1. Using the Interactions & States Pattern to Rapidly Generate & Validate Scenarios: An Example Scenario plan as sequence diagram and requirements:
State
Interaction
Capability
Actor
Req ID
Operating
Navigate
Central Mission Route Download
Vehicle
VEH-1031
The system shall allow the operator to select a pre-stored route for travel on a mission.
Requirement
Operating
Navigate
Trip and Mission Route Display and Directions
Vehicle
VEH-1032
The system shall calculate and display a recommended route to an operator-specified destination from the current location, providing turn-by-turn en route directions and progress tracking.
Operating
Navigate
GPS-based Location Sensing
Vehicle
VEH-1029
The system shall sense the location of the vehicle by accessing the Global Positioning System (GPS) satellite constellation and computing location on the surface of the earth, accurate to 10 feet.
Operating
Navigate
Map Location Display
Vehicle
VEH-1030
The system shall display position of the vehicle on a pre-stored graphic map presentation, including major road and geographic features, updating while enroute to reflect travel of the vehicle.
Operating
Navigate
GPS-based Location Sensing
Vehicle
VEH-1033
The system shall display to the vehicle operator a location confidence indicator, signaling whether accurate GPS location sensing is currently available.
page 72
1. Using the Interactions & States Pattern to Rapidly Generate & Validate Scenarios • Benefits: – A more complete set of scenarios—reduces omissions; – Easier to generate from pattern; – Easier to keep consistent with configured system model as it evolves over the delivery and life cycle; – Valuable not only for initial validation, but also as seed information for generation of system training, documentation, SOPs; – As system requirements are configured, becomes progressively more detailed; – The Pattern provides a clear place to accumulate new learning (e.g., additional Scenarios); • No free lunch: – The State and Interaction Pattern needs to be relatively complete. page 73
2. Using Pattern Configuration to generate better System Requirements faster: Example • Concept: Configured System Requirements can be semiautomatically generated from Configured Features, using the System Pattern; • Low dimensionality / degrees of freedom choices in Feature stakeholder space imply higher dimensionality / degrees of freedom choices in Requirements space: – The difference is made up by relationships encoded in the Pattern.
page 74
2. Using Pattern Configuration to generate better System Requirements faster: Example
Configured System Features
Populates Requirements and Requirements Attributes
Requirements Configuration Process
System Pattern
System Requirements Document
System Requirements
page 75
• The S*Pattern links Features to Requirements: – This means that populating a configuration of Features can automatically populate a configuration of Requirements-Feature
FPK
Interaction
IPK Rule
Role-Phys Compon Table Role
Feature-Interaction Table
Pattern
Feature
Functional Interaction
FPK Attribute Attribute Attribute
Requirement
RSPK Rule
Populated by Pattern (Auto) Populated by User, from Stakeholder Needs
RPK Attribute Attribute
Interaction-Role-Requirement Table Role
Requirement Statement
Populated by Pattern (Auto)
IPPK Rule
Functional Role
IPK
Interaction
Phys Comp
Attribute Coupling
Populated by Pattern (Auto)
Interaction – Role Table Interaction
Role
Design Component IPPK Attribute Attribute
RPK Rule
RSPK Attribute Attribute
ACPK
Configured Pattern (Model)
Populated by Pattern (Auto)
Configured Feature Values
FPK Attribute Attribute Attribute
User Visible User Visible— other items typically not user visible
Configured Functional Interaction
IPK
Populated by Pattern (Auto) PK Value Set by Pattern (Auto)
Populated by Pattern (Auto)
Populated by Pattern (Auto)
User Visible
Configured Requirement Statement Values
RSPK Attribute Attribute
Configured Functional Role RPK Attribute Attribute Attribute Attribute Req’d Vals
PK Value Set by Pattern (Auto)
User Visible
Configured Design Component Values
PCPK Attribute Attribute
Systematica™ Configuration Workbook Pattern Configuration
Attribute Coupling ACPK
Capability Vals
Populated by User or Pattern (Auto)
page 76
V1.4.1
03-15-16
2. Using the Feature Pattern to Rapidly Capture & Validate Stakeholder Requirements: An Example Populating / depopulating Features:
page 77
2. Using the Feature Pattern to Rapidly Capture & Validate Stakeholder Requirements: An Example
Configuring Features: Setting Feature Attribute Values
page 78
• Resulting Requirements: Attribute values can also be set, in line or in tables . . . . page 79
2. Using Pattern Configuration to generate better System Requirements faster: Example • Requirements Attribute Value Setting: – A part of the configuration process – Example: Cruise Control Speed Stability – In PBSE, requirements attribute value setting can be manual, semiautomatic, or automatic—in all cases, driven by Feature Attribute Values and Attribute Couplings:
page 80
2. Using Pattern Configuration to generate better System Requirements faster: Example In general, Configuration Rules are found in the Relationships that associate the model Classes, and also those that associate the model Attributes:
page 81
2. Using Pattern Configuration to generate better System Requirements faster • The scope of a System Pattern can include more than Requirements: – Design Patterns include Physical Architecture, Requirements Decomposition, Requirements Allocations:
page 82
2. Using Pattern Configuration to generate better System Requirements faster • PBSE processes continuously improve the content of the pattern, accumulating lessons for use in future projects:
page 83
3. Selecting Solutions More Informed Trade-offs Introduction: Understanding trade-offs are an essential and critical part of engineering systems
Trades include many formalized methodologies to make informed decisions
1
Trade-offs seek to: – Identify practical alternatives / optimal solutions – Resolve conflicting objectives – Account for the full spectrum of stakeholder needs to ensure a balanced system solution
2
– Methods incorporate identifying/defining stakeholders, requirements, values, attributes, metrics, costs, governing equations, interactions etc. 3 1. Bullets from MIT, ESD.77 MDO Course, Oli deWeck 2. SEARI Ref: http://seari.mit.edu/short_courses.php#value 3. Defense Acquisition University SE Handbook Trades Studies process
page 84
3. Selecting Solutions: More Informed Trade-offs Concept: Patterns provide a very quick and explicit way to perform trades – Patterns contain the essential information to identify and assess systems solutions – Enable the rapid creation and comparison of multiple system configurations – Patterns save time in collection, integration and structuring of the required information to perform trade-offs – Patterns provide leverage across programs and promote consistency – PBSE enables feature space optimization through the turning of knobs in the logical and design component space page 85
Functional Design Roles Components
3. Selecting Solutions More Informed Trade-offs PBSE and Trades Feature Space • Makes explicit all stakeholder needs • Quantifies value impact through attributes • Contains the entire trade space
Functional Role / Logical Architecture • • • • •
Logical, independent of design Describes the system’s behavioral structure Formally models subsystems/design components Houses performance data (range, cost, weight etc.) Supports modeling of multiple physical architectures
Design Components • Contains subsystem and technology options • Design component options populate the logical architecture to create system configurations • Contains part numbers, option names etc. • Models the physical architecture
page 86
3. Selecting Solutions: More Informed Trade-offs Vehicle Trades Example • Buyer Sample Features: – Sufficient range to make it to work and back without going into Flintstone mode – Low operating costs i.e. fuel economy – Reasonable acceleration – 0-60 mph in 2.8 sec. – Affordability / purchase price / cost
• Producer Sample Features: – To develop product lines which meet a broad portfolio of user requirements – To meet ambitious fuel economy standards CAFÉ 54.5 mpg by 2025 – Provide a return on investment – Leverage existing assets and capital structure
page 87
3. Selecting Solutions More Informed Trade-offs Vehicle Trades Example Vehicle Configurations
Systems of Access (SOAs)
Range Current
Charging Interface
page 88
Infrastructure
3. Selecting Solutions More Informed Trade-offs
Vehicle Trades Example – Using patterns a table of multiple configurations is easily created – The table enables many different configurations to be easily compared – Provides the ability to generate many repeatable views and models of value, gaps, utility, sensitivity etc.
page 89
3. Selecting Solutions More Informed Trade-offs Vehicle Trades Example – Selecting design components populates performance criteria within the logical space and value impact within feature space providing a basis to measure the value of any potential system configuration
Vehicle 1 Vehicle 2 Vehicle 3 Vehicle 4 stV ehicle 5 Vehicle 6 Vehicle 7
Range (miles) Vehicle 7
Cost ($) Purchase Price ($) Vehicle 7
73
Vehicle 6 Vehicle 5 Vehicle 4
Vehicle 4
540
Vehicle 3
Vehicle 3
570
Vehicle 2
900
1000
800
700
600
500
400
300
200
0
640 100
$32,950
Vehicle 1
$38,712 $-
$10,000$20,000$30,000$40,000$50,000
Vehicle 2
108
62
page 90
10.2
Vehicle 3
47
50
11.1
Vehicle 4
95
Vehicle 1
7.2
Vehicle 5
Vehicle 4
0
7.9
Vehicle 6
40
Vehicle 3
$25,200
Vehicle 2
620
Vehicle 1
$33,000
Vehicle 7
36
Vehicle 5
$20,780
Acceleration 0-60 mph (sec)
116
Vehicle 6
$16,200
Vehicle 5
496
Vehicle 7
$28,800
Vehicle 6
446
Cost of Operation (mpg)
100
150
9.4
Vehicle 2
8.9
Vehicle 1
8.9 0
5
10
15
For Fun… Highlighted in the table
Configuration Variant Range (miles) Operating Costs (mpg) Acceleration 0-60 mph (sec) Cost (dollars) Top speed (mph)
Ford C-Max Energi Hybrid Plug In 620 108 8.9 $32,950 102
Not in the table A whole different kind of
Woo-hoo. Configuration Variant Range (miles) Operating Costs (mpg) Acceleration 0-60 mph (sec) Cost (dollars) Top speed (mph)
page
Porsche 918 Hybrid Plug In 952 78 2.8 $845,000 91 202
As wildly different as these two are can you think of pattern aspects they share?
3. Selecting Solutions More Informed Trade-offs Summary / Benefits – Patterns provide a rapid way to investigate configuration options and the impact of subsystem selections on stakeholder value impact
– Patterns provide an established and well documented knowledge base for making decisions – Patterns translate discrete design component selections into system level value impact through attribute couplings
– Provides a way to develop heuristics, design rules and platform strategies If you drive 20 miles or less a day, the Energi plug-in version is for you. It costs more, but you’d probably go to the dentist more often than the gas station. If your daily driving much exceeds 30 miles, the regular hybrid is the better choice. You’ll save about two grand and you’ll still get 40-plus mpg, which is stellar. Dan Neil, The Wall Street Journal May 31, 2013
page 92
4. Design for Change Improving System Resiliency Concept: System Resiliency/ Platform Evolution Challenge: To design and build systems which overcome constraints and vulnerabilities of the global supply chain, rapidly changing user needs, and an uncertain operational future1.
The new ilities 2
Goal: Significantly transform traditional engineering practices to develop and adapt systems to address dynamic needs and risks1.
Assertions: – Clean sheet design is extremely rare – Rapid change is normative, keeping pace is required – Systems often require lifecycle extension i.e. upgrades – System resilience provides significant competitive advantage 1. DoD Engineering Resilient Systems http://www.acq.osd.mil/chieftechnologist/areas/ers.html 2. Engineering Systems: de Weck, Ross and Magee, 2011 - http://mitpress.mit.edu/books/engineering-systems
page 93
2
4. Design for Change Improving System Resiliency Uncertainty Management: – Understanding how requirements might change
– Eliminating the physical cause of the uncertainty – Delaying design decisions until uncertain variables are known
Range
Architecture Management: – Reducing the system sensitivity to uncertainties – Purposefully isolating anticipated change – Planning for subsystem and technology insertion – Leveraging platform engineering methodologies
We can't solve problems by using the same kind of thinking we used when we created them. -- Albert Einstein --
page 94
4. Design for Change Improving System Resiliency Uncertainty Management: – Should be viewed across all Stakeholders
– Is performed in Feature space – Assigns value and measures to new ilities – Must go beyond best guess or average estimates
Architecture Management: – Extends beyond the end product alone – flexible manufacturing etc. – Is performed in functional and physical space – Accommodates new ilities within product lines/families to improve leverage. Move up resilient design principles where appropriate
page 95
4. Design for Change
Feature
Uncertainty Management Uncertainty Management Includes: • Clarifying Issues
– Envisioning alternate futures for operational context, mission, technologies etc. – Identifying key issues and categorizing them as Criteria, Chances, Choices & Constituencies – Clarifying Issues Tools: War gaming, Brainstorming, Delphi, Affinity Diagrams…
• Describing the potential uncertainties, decisions and criteria – – – –
•
Assessing probability of occurrence and how that probability changes over time Understanding how uncertainties may be driven by more fundamental ones For each criteria perform Five Whys to infer the primary criteria/needs Identifying Uncertainties Tools: SME and Stakeholder Interviews, Five Whys, Root Cause Analysis…
Identifying the contextual drivers of potential change – – –
–
Define a deterministic multi-objective measure of performance Relate multi-objective measure to the uncertainties and decisions (Influence Diagrams) Analyze the end-point uncertainties of the influence diagram to determine which uncertainties, when varied over their range, cause the greatest change in value Identifying Drivers Tools: Influence Diagrams, Sensitivity Analysis, DOEs, Pareto Charting…
For all of its uncertainty, we cannot flee the future. - Barbara Jordan
page 96
4. Design for Change
Feature
Uncertainty Management Influence Diagrams • The adjacent example models cost as the relevant criteria
Cost Manhours Required per Innovation Degree of Innovation
• Great tool for identifying potential drivers of change in complex systems • Sensitivity - With this model we can conduct a sensitivity analysis, via a DOE, to identify the impact and interaction effects • This DOE also allows for the estimation of Criticality - Use a tornado chart (two-sided vertical Pareto chart) to identify the most critical uncertainties
RDTE
Human Casualties Operations and Maintenance
Procurement
Supplier Variable Costs
Repair Costs
Fuel Costs Maintenance Costs
Amortized Fixed Costs Labor
#Maintenance Cycles
Cost per liter Fuel Consumption
#Workers
#Damage Incidents
$/Worker Supplier Fixed Costs
Cost per Failure
Successful Incidents per
#km Traveled
Logistics
Engagement Influence Diagram
#Combat Engagements
Plant Overhead
Lethality
Amortized Fixed
Fixed Costs
Cost per Damage
#Quality Failures
Cost per Cycle
Units Purchased
Spec. Tooling SecondTier Variable
Combat Damage Costs
Salvage Costs Quality Costs
Materials
SecondTier Supplier Costs
Loss of Life per Incident
Mass
%Attacks Deterred %Adversary Ability
Speed Traveled
Symbol
Attacks per Engagement
Element
Description
Decision
A variable that can be modified directly
A value which cannot Chance be controlled directly, Variable is uncertain
Design Of Experiments
Tornado Chart
page 97
General Variable
A deterministic fuction of the quantities is depends on
Objective
A measure of satisfaction with an outcome, utility
Arrow
An influence
4. Design for Change Architecture Management Architecture Management Includes • Informing system designers through analysis
Range Consumalble Typ Fuel Type Comfort Issue Operating Cost Refuel Cost Infrastructure Availability Vehicle Management Feature Vehicle Management System Vehicle External Appearance Subsystem Vehicle Interior Structural Subsystem Vehicle Passenger Environment Subsystem Vehicle Exterior Structural Subsystem Vehicle Chassis Structure Subsystem Fuel Tank Capacity [Store Fuel] Convert Fuel to Mechanical Energy Rolling Resistance [Slow or Stop Vehicle] Convert Mechanical Energy to Electrical Energy Functional Role.Vehicle Functional Roles.Vehicle Propulsion Subsystem.Flow Energy [Control Energy Flow] Store Electric Energy Convert Electrical Energy to Mechanical Energy Start and Stop Energy Conversion Translate Torque to Wheels Enable Rolling Release Energy as Heat Fuel Supply System Engine System [Internal Combustion] Starter Generator Cooling System Powertrain Power Management/Distribution System Battery Electric Motor / Generator Vehicle Driveline Wheels Brakes Steering Suspension Vehicle Interior Body Exterior Body Structure Vehicle Power & Data Mgmt & Dist
– Provide rigor around how system elements interact – pattern contains this key information
– Understanding how system elements and interactions are affected by change
$root
1 2 3 4 5 6 7 8 9 10 11 12 13 14 15 16 17 18 19 20 21 22 23 24 25 26 27 28 29 30 31 32 33 34 35 36 37 38 39 40 41
– Modifying architectures to decrease sensitivity to change
GroupFeature Feature Feature Availability Comfort Carrying &Feature Performance Operation ofReliability Vehicle Comsumables Passenger Cost Compatibility Passenger Vehicle Propelling Systems Vehicle Features Vehicle Functional Roles Feature Functional Role
•
1 1 1 Range 1 2% 2% Consumalble Typ 2 2% Fuel Type 3 1 2% Comfort Issue 4 2% Operating Cost 5 2% Refuel Cost 6 1 2% Infrastructure Availability 7 1 2% Vehicle Management Feature 8 1 2% Vehicle Management System 9 2% Vehicle External Appearance Subsystem 10 2% 1 1 Vehicle Interior Structural Subsystem 11 1 2% 1 Vehicle Passenger Environment Subsystem 12 5% Vehicle Exterior Structural Subsystem 13 2 1 1 4 2% Vehicle Chassis Structure Subsystem 14 2% 1 Fuel Tank Capacity [Store Fuel] 15 1 2% Convert Fuel to Mechanical Energy 16 2% Rolling Resistance [Slow or Stop Vehicle] 17 1 1 Convert Mechanical Energy to Electrical Energy 18 1 Functional Role.Vehicle Functional Roles.Vehicle 19 Propulsion Subsystem.Flow Energy [Control Energy Flow] Store Electric Energy 20 1 Convert Electrical Energy to Mechanical Energy 21 Start and Stop Energy Conversion 22 Translate Torque to Wheels 23 1 Enable Rolling 24 Release Energy as Heat 25 1 Fuel Supply System 26 1 Engine System [Internal Combustion] 27 1 Starter Generator 28 Cooling System 29 Powertrain Power Management/Distribution 30System Battery 31 1 1 Electric Motor / Generator 32 1 Vehicle Driveline 33 1 Wheels 34 1 1 Brakes 35 1 Steering 36 Suspension 37 1 1 Vehicle Interior 38 1 Body Exterior 39 1 1 1 Body Structure 40 1 3 Vehicle Power & Data Mgmt & Dist 41 3
Architectural analysis of: – Modularity & System Partitioning – Accommodating New Technology
Powertrain Chassis Vehicle Design Components Design Component
– Change Propagation and Impact
Vehicle Body Vehicle Electrical System
Curiosity begins as an act of tearing to pieces or analysis. - Samuel Alexander
page 98
4
1
1
1
2
1
1
1
3
4 1 1 1 1 1
1 1
1
1
1
2%
1
1
1 2%
1
1 1 1
1 2% 1
1
1
1
1
1
1
1
1
1
1
1
1
2%
1
1
1 1 1 1
2% 1
1
1 2%
1
1
1 2% 2%
1 2%
1 1
1
1 12% 1
1
1
1 2%
1 1 1
1
1 2%
1
1
1
1
1
1 2%
1
1
1
1 2%
1
1
1
1 1
1 1
1
1
1
1
1 2%
1
1
1
1 3%
1
1
1
1 2% 1
1
1
1
1 2%
1
1
1
1 2%
1
1
1
1
1
1
1
1
1
1
7
6
5
5
5
5
5
17
4
8
5
3
1
4
1
5
1
5
1
5
1
5
1
5
1
5 4 5 3
1 2%
1 2%
1
1
1
1
1 2%
1
5
1 2%
6
1
1
1
11 12
6
6 12%
Graph Theory & Design Structure Matrix Systems Analysis Powerful methods to analyze architectures •
The diagrams below provide two different views of a generic system with interrelationships as shown
•
These interrelationships could be physical, informational, energy transfer or material/mass exchange
•
Such diagrams are necessary to gain a better understanding of how systems elements interact
A B C D E F G H
C G
A D
F
H
B
E
A B C X X X X X X X X X
D E F G H X X X X X X X X X X X X X X
Network Graph
Matrix View
Lines indicate connectivity between elements
X’s indicate connectivity between elements
The benefit of the matrix is that it provides a compact visual of the system and it enables holistic systems modeling, analysis and optimization
page 99
Design Structure Matrix Overview
Domain B
Level 2
Level1
Level 2 Level 2
Domain C
• Normally rectangular matrix – N x M • Mapping between two domains
Level 3 Names
A
Level 2
Domain Mapping Matrix (DMM)
Level 1
Square matrix - N x N or N2 Analyze dependencies across domain Combination of DSMs and DMMs Especially helpful for DSMs > 1000 elements
Level 2.
• • • •
NxN
Domain A
Multi Domain Matrix (MDM)
A
DSM Level 2
Square matrix- N x N or N2 Analyze dependencies within a domain Used for products, process and Organizations Binary marks “(1” or “X”) show existence of a relation • Numerical entries are weights of relation strength • Can be directed or undirected (symmetrical)
Level 1
• • • •
$root
B N C
N B
C
1 Level 3 Names 2 3 4 5 6 8 9 10 11 12 13 14 15 16 17 18 20 21 22 23 24 25 26 27 28 29 30 31 32 34 35 36 37 38 39 40 41 42 43 44 45
Design Structure Matrix (DSM)
1 2 3 4 5 6 8 9 10 11 12 13 14 15 16 17 18 20 21 22 23 24 25 26 27 28 29 30 31 32 34 35 36 37 38 39 40 41 42 43 44 45
DSM
MDM
Domain A NxN
Domains A, B & C
DMM
DSM
Domains A & B AxB
Domain B MxM
DMM
DMM
page 100
DSM Domain C PxP
Example Network Graphs and DSM Patterns Understanding Architecture, Dependency and Related Patterns
Layout: Concentric
• •
Symmetrical Layered System – every systems uses every system below it
Layout: Circular
• •
Non symmetrical Layered System – every systems uses every system below it
Layout: ForceAtlas2
• •
Symmetrical Non-Overlapping clusters
Layout: Yifan Hu
• •
Symmetrical Overlapping clusters
page 101
Example Network and DSM Patterns Understanding Architecture, Dependency and Related Patterns Unorganized Network Graph • Randomly generated
DSM • Randomly ordered
Organized Network Graph • Nodes sized by degree • Arranged by cluster
DSM • Layered • Change propagator, Element 10, clearly shown at the bottom • Clustered, showing both overlapping non-overlapping and clusters
page 102
4. Design for Change Architecture Management Modularization & System Partitioning • Modularization is the grouping of system elements that are mutually exclusive or minimally interacting subsets (absorb interactions internally).
• It eliminates redundancy, minimizes external connections
26 27 28 29 33 34 35 36 37 38 39 40 41
• It minimizes change propagation, enables technology insertion and platform based engineering methods making systems less sensitive to the uncertainties
Chassis
Powertrain
Vehicle Body Vehicle Electric
Ele. & Pwr.
Powertrain Chassis Vehicle Design Components Design Component
Vehicle Body
Fuel Tank IC Engine System Starter Generator Electric Drive Vehicle Driveline Wheels Brakes Steering Suspension Vehicle Interior Body Exterior Body Structure Vehicle Power & Data Mgmt & Dist
page 103
26 27 28 29 33 34 35 36 37 38 39 40 41
2%
1
1 12% 1
1
1 2%
1
1
%
1
1
Powertrain
1
1
1 3%
1 1
1 2% 1
Chassis
Power/ Electrical
1
1
1
7
6
5
17
3
1
4
1
5
1
5
1
1
1
4
1 2%
5
1
1
1
1 2%
1
1
1
4
8
3
1 2%
Vehicle Body 1
1
5
1 2%
1
1
6
1 2%
1
5
1 2%
6
1
1
1
11 12
6 12%
4. Design for Change Architecture Management Accommodating New Technologies / Subsystems • Patterns enable in depth analysis of design component selection • Combining system and subsystem matrixes permits: – Analysis of subsystem and technology integration complexity and risk – Identification of potential cost drivers – Further pattern recognition, development and refinement
Identify which technology elements affect multiple system level elements
Element Number Body - Exterior Body - Structure Body - Interior Powertrain - Powertrain Control Module Powertrain - Transmission Powertrain - Engine Chassis - Driveline Chassis - Frame Chassis - Suspension Chassis - Steering Chassis - Fuel Supply System Chassis - Exhaust System Chassis - Brakes Electrical - Data System Electrical - Power Distribution Chassis - Brakes - Exciter Chassis - Brakes - Speed Sensors Chassis - Brakes - ABS Control Module Chassis - Brakes - ABS Pump Chassis - Brakes - ABS Modulator Valves Traction Control Solenoid Valve Modulator Valves Acceleration Sensor (Yaw,R,L) Steering Angle/Position Sensor Electronic Controller Module & Data Bus
1
1 3 2 5 4 6 8 7 9 10 12 13 11 14 15 16 17 18 19 20 21 22 23 24 25
3
2
1 1 1 1 1 1
5
4
6
8
7
9 10 12 13 11 14 15 16 17 18 19 20 21 22 23 24 25
3 3 1
1 1
3 5 5 5 5 3 1 1 5 5 3 1 1 1 5 1 1 1 1 1 3 1 1 1 1 1 1 1 1 1 1 1 1 1 1 3 1 1 3 1 1 3 1 1 3 3 3 5 5 5 3 3 3 1 3 Element 3 1 1 3 3 1 1 1 1Number 1 3 1 Chassis - Brakes - Exciter Chassis 1 - Brakes - Speed Sensors 3 1 5Chassis - Brakes - ABS Control Module 3 5 Chassis - Brakes - ABS Pump 1 1 Chassis - Brakes - ABS Modulator Valves 1 1 Traction Control Valves/Solenoids 1 1 Modulator Valves 1 1 Acceleration Sensor (Yaw,R,L) 1 5 Steering Angle/Position Sensor 1 1 5 Electronic Controller Module & Data Bus 1 5 5
1 1 3 3 1 1
1 1 1 1 3
1
1
1
1
1
5
1 5
Identify high impact areas to a particular system element
1
3 1 3 5 16 17 1 18 1 19 1 16 11 17 1 11 11 18 1 11 33 19 1 33 20 1 33 1 21 1 33 1 22 1 33 1 23 1 24 1 25 1 33 55 33
page 104
1
1
1
1
1 5
5
5
20 1 21 1 22 1 23 1 24 1 25 1
33 33 33 1 1 1 11 11 11 11 11 11
33 33 33 55 55
33 55 33 33 33 33 55 55
Assess multiple technologies to determine Technology Invasiveness (Technology Infusion – Oli de Weck)
4. Design for Change Architecture Management Change Propagation • Realized uncertainties often drive engineering changes which can easily balloon in an uncontrolled fashion
Multipliers
• Knowing how changes propagate so 2nd, 3rd, and 4th order impacts are known is very powerful
Carriers Absorbers
• Early discovery of ”propagation paths” can have a significant impact on total life cycle cost.1
Generate more changes than they absorb Absorb a similar number of changes to those they cause Absorb more change they themselves cause
Constants Unaffected by change
• Architectural analysis and understanding of system patterns helps control change propagation
1. Eckert C, (2004) Change and Customization in Complex Engineering Domains, Research in Eng. Design
26 27 28 29 33 34 35 36 37 38 39 40 41 Powertrain Chassis Vehicle Design Components Design Component Vehicle Body Vehicle Electrical System
Fuel Tank IC Engine System Starter Generator Electric Drive Vehicle Driveline Wheels Brakes Steering Suspension Vehicle Interior Body Exterior Body Structure Vehicle Power & Data Mgmt & Dist
26 27 28 29 33 34 35 36 37 38 39 40 41
1 1
1 1 1
1
1
1
1 1
1
1 1
1 1 1
1
1
7
6
5
17
4
1
5
1
5
1
1
1
1
1
4
1
1
5
1
# of Elements
3
1
1 1
1
1
1
1 1
3
1
1 1
1
4
8
5
1
1
1
11 12
1
6
1
5
1
6 6
All change is not growth, as all movement is not forward. - Ellen Glasgow
page 105
3 6 4 4 5 5 5 4 4 3 3 8 11
# Dependencies
5 11 10 8 11 8 10 6 4 8 7 17 102
4. Design for Change Architecture Management Impact Analysis • Product Line/System Families/Platforms: The common system pattern which enable rapid specialization or configuration of individual products / systems configurations i.e. product variants. Change impact analysis can aid in determining which elements remain a part of the family pattern, which are unique and which should become flexible. GroupFeature Feature Feature Availability Comfort Carrying &Feature Performance Operation ofReliability Vehicle Comsumables Passenger CostCompatibility Passenger Vehicle Propelling Systems Vehicle Features Vehicle Functional Roles Feature Functional Role
Range
Powertrain Vehicle Design Components Design Component
1 1 1 Range 1 2% 2% Consumalble Typ 2 2% Fuel Type 3 1 2% Comfort Issue 4 2% Operating Cost 5 2% Refuel Cost 6 1 2% Infrastructure Availability 7 1 2% Vehicle Management Feature 8 1 2% Vehicle Management System 9 2% Vehicle External Appearance Subsystem 10 2% 1 1 Vehicle Interior Structural Subsystem 11 1 2% 1 Vehicle Passenger Environment Subsystem 12 5% Vehicle Exterior Structural Subsystem 13 2 1 1 4 2% Vehicle Chassis Structure Subsystem 14 2% 1 Fuel Tank Capacity [Store Fuel] 15 1 2% Convert Fuel to Mechanical Energy 16 2% Rolling Resistance [Slow or Stop Vehicle] 17 1 1 Convert Mechanical Energy to Electrical Energy 18 1 Functional Role.Vehicle Functional Roles.Vehicle 19 Propulsion Subsystem.Flow Energy [Control Energy Flow] Store Electric Energy 20 1 Convert Electrical Energy to Mechanical Energy 21 Start and Stop Energy Conversion 22 Translate Torque to Wheels 23 1 Enable Rolling 24 Release Energy as Heat 25 1 Fuel Tank 26 1 IC Engine System 27 1 Starter Generator 28 Electric Drive 29 Cooling System 29 Powertrain Power Management/Distribution 30System Battery 31 1 1 Electric Motor 32 1 Vehicle Driveline 33 1 Wheels 34 1 1 Brakes 35 1 Steering 36 Suspension 37 1 1 Vehicle Interior 38 1 Body Exterior 39 1 1 1 Body Structure 40 1 3 Vehicle Power & Data Mgmt & Dist 41 3
Chassis
Vehicle Body Vehicle Electrical System
2.
4
1
1
1
2
1
1
1
3
4 1 1
Generate impact report of realized / modeled uncertainties
1 1 1 1 1
1
1
1
2% 1
1 1 1
1
1
1
1 2% 1
1
1
1
1
1 1 1
1
1
1
1
2%
1
1
1
1
2%
1
1 1
1 2% 1 1
1
Prioritize impacted element analysis by secondary criteria such as change propagation, cost, integration risk, coupling…
1 2% 1
1
1 2% 2%
1 2% 1
1 1
1 12% 1
1
1 1
1
1
1
1 2% 1
1
1
1
1
%
1
1
1
1
1
1
1 2% 1
1
1
1
1
1
1 2% 1
1
1
1
1 2% 1
1
1
1
1 1
1 1
1
1
1
1
1
1
1 1
1
1 3% 1 1 2% 1
1
1
1 2% 1
1
1
1 2% 1
1
1
1
1
1
1
1
7
6
5
5
5
5
5
17
4
1
5
1
5
1
5
1
5
1
5
1
5
1
1
4 5 3
1 2%
1 2% 1
1
3
1
1
1 2% 1
1
1
4
8
5
1
6
1 2% 1
5
1
1
1 2% 6
1
11 12
6 12%
1. deWeck, Oli, Strategic Engineering: Designing Systems for an Uncertain Future, Flexible Product Platforms: Framework and Case Study Kalligeros K., de Weck O., de Neufville R., Luckins A., "Platform Identification using Design Structure Matrices", Sixteenth Annual International Symposium of the International Council On Systems Engineering (INCOSE), Orlando, Florida, 8 - 14 July 2006
page 106
Address uncertainty as high up in the pattern as possible to leverage across the portfolio
Range Consumalble Typ Fuel Type Comfort Issue Operating Cost Refuel Cost Infrastructure Availability Vehicle Management Feature Vehicle Management System Vehicle External Appearance Subsystem Vehicle Interior Structural Subsystem Vehicle Passenger Environment Subsystem Vehicle Exterior Structural Subsystem Vehicle Chassis Structure Subsystem Fuel Tank Capacity [Store Fuel] Convert Fuel to Mechanical Energy Rolling Resistance [Slow or Stop Vehicle] Convert Mechanical Energy to Electrical Energy Functional Role.Vehicle Functional Roles.Vehicle Propulsion Store Electric Energy Convert Electrical Energy to Mechanical Energy Start and Stop Energy Conversion Translate Torque to Wheels Enable Rolling Release Energy as Heat Fuel Supply System Engine System [Internal Combustion] Starter Generator Cooling System Powertrain Power Management/Distribution System Battery Electric Motor / Generator Vehicle Driveline Wheels Brakes Steering Suspension Vehicle Interior Body Exterior Body Structure Vehicle Power & Data Mgmt & Dist
4. Design for Change
Architecture Management Vehicle Example MDM
$root
Functional Roles
1 1 1 Range 1 2% 2% Consumalble Typ 2 2% Fuel Type 3 1 2% Comfort Issue 4 2% Operating Cost 5 2% Refuel Cost 6 1 2% Infrastructure Availability 7 1 2% Vehicle Management Feature 8 1 2% Vehicle Management System 9 2% Vehicle External Appearance Subsystem 10 2% 1 1 Vehicle Interior Structural Subsystem 11 1 2% 1 Vehicle Passenger Environment Subsystem 12 5% Vehicle Exterior Structural Subsystem 13 2 1 1 4 2% Vehicle Chassis Structure Subsystem 14 2% 1 Fuel Tank Capacity [Store Fuel] 15 1 2% Convert Fuel to Mechanical Energy 16 2% Rolling Resistance [Slow or Stop Vehicle] 17 1 1 Convert Mechanical Energy to Electrical Energy 18 1 Functional Role.Vehicle Functional Roles.Vehicle 19 Propulsion Subsystem.Flow Energy [Control Energy Flow] Store Electric Energy 20 1 Drive Electric Convert Electrical Energy to Mechanical Energy 21 Start and Stop Energy Conversion 22 Translate Torque to Wheels 23 1 Enable Rolling 24 Release Energy as Heat 25 1 Fuel Supply System 26 1 Engine System [Internal Combustion] 27 1 Starter Generator 28 Cooling System 29 Powertrain Power Management/Distribution 30System Battery 31 1 1 Electric Motor / Generator 32 1 Vehicle Driveline 33 1 Wheels 34 1 1 Brakes 35 1 Steering 36 Suspension 37 1 1 Vehicle Interior 38 1 Body Exterior 39 1 1 1 Body Structure 40 1 3 Vehicle Power & Data Mgmt & Dist 41 3
4
Vehicle Body Vehicle Electrical Sy
page 107
1
1
2
1
1
1
3
4 1 1 1 1 1
1
1
1
1
1
1
1
2%
1
1
1
1 2%
1
1
1
1 2%
1
1
1
1
1
1
1
1
1
1
1
2%
1 1
1
1
Related Design Components
1 1
2%
1
Range 1 Extender
1 2% 2% 2%
1
1
1
IC Engine1
2%
1 12% 1
1
1
1
1 2%
1
1
1
1 2%
1
1
1
1
1
1 2%
1
1
1
1 2%
1
1
1
1 1 1 1
1
1
1
1
1 Functional Allocations/ Traceability
1
1
Chunks of Behavior
Regenerative Braking
Feature Traceability
Powertrain Chassis Vehicle Design Components Design Component
Design Components
GroupFeature Feature Feature Availability Comfort Carrying &Feature Performance Operation ofReliability Vehicle Comsumables Passenger Cost Compatibility Passenger Vehicle Propelling Systems Vehicle Features Vehicle Functional Roles Feature Functional Role
Requirement X
1 2 3 4 5 6 7 8 9 10 11 12 13 14 15 16 17 18 19 20 21 22 23 24 25 26 27 28 29 30 31 32 33 34 35 36 37 38 39 40 41
Features
1
Electric Drive
1
1 2%
1
1
1 3%
1
1 Chassis
1
1
Power/Data Bus 1
1
1
1
1
1
1
7
6
5
5
5
5
5
17
4
1
5
1
5
1
5
1
5
1
5 5
1
1
1
4
1 2%
1
1
5
1
1 2%
1
1
1
3
1 2%
1 2%
1
3
1
Body1
1
1 2%
1
4
8
5
1
1
6
1 2%
1
5
1 2%
6
1
1
1
11 12
6 12%
4. Design for Change Improving System Resiliency Designing for Change Benefits: GroupFeature Feature Feature Availability Comfort Carrying &Feature Performance Operation ofReliability Vehicle Comsumables Passenger CostCompatibility Passenger Vehicle Propelling Systems Vehicle Features Vehicle Functional Roles Feature Functional Role
1 1 1 Range 1 2% 2% Consumalble Typ 2 2% Fuel Type 3 1 2% Comfort Issue 4 2% Operating Cost 5 2% Refuel Cost 6 1 2% Infrastructure Availability 7 1 2% Vehicle Management Feature 8 1 2% Vehicle Management System 9 2% Vehicle External Appearance Subsystem 10 2% 1 1 Vehicle Interior Structural Subsystem 11 1 2% 1 Vehicle Passenger Environment Subsystem 12 5% Vehicle Exterior Structural Subsystem 13 2 1 1 4 2% Vehicle Chassis Structure Subsystem 14 2% 1 Fuel Tank Capacity [Store Fuel] 15 1 2% Convert Fuel to Mechanical Energy 16 2% Rolling Resistance [Slow or Stop Vehicle] 17 1 1 Convert Mechanical Energy to Electrical Energy 18 1 Functional Role.Vehicle Functional Roles.Vehicle 19 Propulsion Subsystem.Flow Energy [Control Energy Flow] Store Electric Energy 20 1 Convert Electrical Energy to Mechanical Energy 21 Start and Stop Energy Conversion 22 Translate Torque to Wheels 23 1 Enable Rolling 24 Release Energy as Heat 25 1 Fuel Tank 26 1 IC Engine System 27 1 Starter Generator 28 Electric Drive 29 Cooling System 29 Powertrain Power Management/Distribution 30System Battery 31 1 1 Electric Motor 32 1 Vehicle Driveline 33 1 Wheels 34 1 1 Brakes 35 1 Steering 36 Suspension 37 1 1 Vehicle Interior 38 1 Body Exterior 39 1 1 1 Body Structure 40 1 3 Vehicle Power & Data Mgmt & Dist 41 3
– Provide a means to accommodate rapidly changing needs
Powertrain Vehicle Design Components Design Component
26 27 28 29 33 34 35 36 37 38 39 40 41
Vehicle Body Vehicle Electrical System
Fuel Tank IC Engine System Starter Generator Electric Drive Vehicle Driveline Wheels Brakes Steering Suspension Vehicle Interior Body Exterior Body Structure Vehicle Power & Data Mgmt & Dist
– Improve new ility system characteristics Vehicle Body Vehicle Electrical System
– Supports platform methods reducing total life cycle cost
26 27 28 29 33 34 35 36 37 38 39 40 41
1 1
1 1 1
1 1
1
1
1
1 1
1 1 1 1
1
1
1
1
1
1
1
1
1
7
6
5
17
4
1
5
1
5 4 5 3
1
1 1
1
1
1 1
1
3
1
1 1
1
4
8
5
1
1
1
11 12
1
6
1
5
1
6 6
# of Elements
1
1
2
1
1
3
4 1 1 1 1 1
1 1
1
1
1
2% 1
1 1 1
1
1 2% 1
1 1
1
1
1
1
1
1 1
1
1
1
1
1
2%
1
1
1 1
1 2% 1
1
1
1
2%
1
1 2% 1
1
1 2% 2%
1 2% 1
1 1
1 12% 1
1
1 1
• Assuming that evaluation of accommodating an uncertainty based upon average conditions gives a correct result1. 1. Flexibility in Engineering Design: de Neufville and Scholtes, 2011 - http://mitpress.mit.edu/books/flexibility-engineering-design
1
1
1
1
1
%
1
1
1
1
1
1
1 2% 1
1
1
1
1
1
1 2% 1
1
1
1
3
1
4
1
5
1 1
1
5
1
5
1
1
1 2% 1
1
5
1
1
1
5
1
5
1
1 2% 1
1
1 3% 1 1 2% 1
1
1
1
1
1 2% 1
1
1
1 2% 1
1
1
4 5 3
1 2%
1 2% 1
5 11 10 8 11 8 10 6 4 8 7 17 102
1
1
1
1
# Dependencies
3 6 4 4 5 5 5 4 4 3 3 8 11
1
1 2% 1
1 1
1
1
1 1
– Avoids the Flaw of Averages
page 108
1
1
Chassis
Powertrain Chassis Vehicle Design Components Design Component
– Measure change impact and improve pattern management evolution and leverage
4
1
1
1
1
1
1
1
1
7
6
5
5
5
5
5
17
4
8
5
1
6
1 2% 1
5
1
1
1 2% 6
1
11 12
6 12%
5. Using Patterns to Improve Risk Analysis: Example • •
Concept: A System Pattern can be used to generate more complete risk analyses, and with less effort; Because the Feature Pattern by intention represents the stakeholder level concerns of all classes of stakeholders: – Features are the only things that can possibly be at risk!
•
For example, in an FMEA, the only possible “Effects” at risk are the system Features: – The System Pattern can provide a pre-stored library of Impacts of non-delivery / nonperformance of each Feature, even before a design exists.
•
•
Similarly, analysis and management of Project Risks, Technology Risks, doing a Preliminary Hazard Analysis (PHA), Fault Tree Analysis, integrating Technology Readiness Levels (TRLs), or other forms of risk analysis can all be viewed through the integrated lens of Stakeholder Features This has a nice integration effect—for example, project “top level” risk reports or views can be expressed in the form of master risk views . . . .
page 109
5. Using Patterns to Improve Risk Analysis: Example
Personal Vehicle Application Feature Group
V V V
Vehicle Config A Vehicle Config B Vehicle Config C
V V V
Vehicle Config A Vehicle Config B Vehicle Config C
Vehicle Config A Vehicle Config B Vehicle Config C
V V V
Vehicle Config A Vehicle Config B Vehicle Config C
Vehicle Config A Vehicle Config B Vehicle Config C
Vehicle System Configurations: Summary Scoring
V V V
V V V
Safety Feature Group
Environmental Compatibility Feature
Consumable Compatibility Feature
Vehicle Performance Feature
Reliability & Availability Feature
Vehicle Delivery Feature
Vehicle Aesthetics Feature Group
Vehicle Comfort Feature Group
Cost of Operations Feature
Operability Feature
Maintainability Feature
Security Feature
Configurability Feature
Accountability Feature
Communications Feature Group
Remote Management Access Feature
STATUS LEGEND: Unsatisfied or unknown Satisfied, low margin Satisfied, in margin Satisfied, high margin Not applicable to this config
COLUMN LEGEND:
Vehicle Config A Vehicle Config B Vehicle Config C
page 110
5. Using Patterns to Improve Risk Analysis: Example Physical Entity
Failure Mode
Vehicle ECM
Dead ECM
Vehicle ECM
Network Connector Open
Vehicle ECM
Network Connector Short
Vehicle ECM
Erratic ECM
Battery
Discharged Battery
Battery
Battery Cell Short
Battery
Battery Cell Open
Battery
Battery Leak
Panel Display
Fractured Display
Panel Display
Illuminator Fail
Bluetooth Module
Module Hard Fail
Bluetooth Module
Transmitter Fail
Bluetooth Module
Receiver Fail page 111
Using Patterns to Improve Risk Analysis: Failure Modes • The pattern is used to accumulate experience in the following Risk Model areas: – Feature Impacts: The stakeholder impact of non-delivery of a Feature – Counter-Requirements: An (abnormal) behavior violating a System Requirement – Failure Mode: A state of an entity in which its behavior includes at least one Counter Requirement
page 112
Using Patterns to Improve Risk Analysis: Example Feature
Effect (Failure Impact)
Severit y
Functional Failure (Counter Requirement)
Component
Navigation Feature [GPSbased Location Sensing]
No Confidence in Displayed Position
Serious (4)
The system displays a location that is not accurate to 10 feet.
Vehicle ECM
Erratic ECM
0.0015
Nav Backup Mode: External Nav Module
Navigation Feature [GPSbased Location Sensing]
False Confidence in High Error Displayed Position
Critical (5)
The system displays Vehicle ECM a location confidence indicator that is not correct.
Erratic ECM
0.0015
None
Navigation Feature [GPSbased Location Sensing]
No Displayed Location
Serious (4)
The system does not display the graphic map presentation.
Fractured Display
0.0003
Nav Backup Mode: External Nav Module
Panel Display
Failure Mode
Probability
Mitigation (Control)
page 113
Design Component
Failure Mode
Functional Role
Probability
Physical Failure Mode Space
Logical CounterRequirements Space
Stakeholder Language
Feature
FMEA Failure Effects
Failure Impact
Functional Interaction
Requirement Counter Requirement
Severity
Stakeholder
page 114
Technical Language
FMEA Functional Failures
Combinatorial “matching up” of requirements-design pairs Logical CounterRequirements Space
•
Physical Failure Mode Space
The Functional Failures (counter requirements) and Failure Effects (feature failure impact) data can be prepopulated independent of the system’s internal design, and the Failure Mode data for standard component roles can be pre-populated independent of the system’s external requirements. – So, when both the requirements and a candidate design have become known, how do these two halves of the failure analysis model get connected to each other? – This turns out to be a combinatorial algorithm.
•
First, it turns out that the counter-requirements (functional failures) obtained by reversing the requirements statements may describe some hypothetical external behaviors that are never (or with probability too small to matter) caused by component failure modes. – This will cause some pre-populated functional failures to be dropped. – For example, a requirement that a product weigh less than one pound has a counter-requirement that it weighs more than one pound. – It may be determined that there is no component failure mode that impacts weight, so that this functional failure is dropped from the list. – Notice that even this failure mode could happen for some products—for example, a hazard protection suit that becomes wet weighs more.
•
Second, it turns out that some failure modes of a physical component have no consequence on the product’s required behavior, because the failure mode goes with a role not allocated to the part in this particular product design. – For example, an integrated circuit may have built-in circuitry for performing certain functions which are not used by a certain product’s design, even though other portions of that chip are used.
•
The connection of the requirements half of the failure analysis to the design half of the failure analysis is made by matching up “mating” pairs, and discarding what is left as not applicable (after checking for missed cases this approach also helps us find—another benefit) . . .
115
Combinatorial “matching up” of requirements-design pairs Logical CounterRequirements Space
•
Physical Failure Mode Space
The “matching up” is accomplished through the matching of counter-requirements with failure modes. – Each failure mode causes some abnormal behavior. – All abnormal behavior is described by counter requirements. When we find a counter-requirement belonging to a failure impact is equal to a counter-requirement for a failure mode, that pair is associated together, completing two major sections of a row in a failure analysis table. – Some failure modes may connect to multiple counter requirements and some counter requirements may connect to multiple failure modes.
•
This process may use two levels of requirements, in the form of system black box requirements and their decomposed white box requirements (allocated to physical parts), in which case counter-requirements may be developed at both levels. – A simpler alternate method is to use only one level of counter-requirements, with the component failure modes associated directly with the resulting abnormal behavior at the black box level—in which case the association of failure modes with abnormal behavior is dependent upon knowing the system level design. – Likewise, the states discussed above may be at two levels, representing states (and failure modes) of system components and the whole system, or simplified to states of the whole system, in which case the failure modes are modes of the whole system and again dependent upon its design.
•
The discussion above assumes failure modes originate in internal system components, typical of analyses such as a Design FMEA (D-FMEA). – Also discussed later below are failure modes of external people or processes (actors) that impact upon the subject system, as seen in an Application FMEA (A-FMEA) or a Process FMEA (P-FMEA). – The counter-requirements and physical mode matching-up approach is substantially the same in these cases.
5. Using Patterns to Improve Risk Analysis: Example • Benefits: – Generate initial FMEA or other risk analyses with less initial effort; – More complete—reduces omissions; – Feels more systematic than the usual FMEA process; – Generates the “normal” FMEA view – Easier to generate from pattern; – Stages—without failure modes versus with failure modes – The Pattern provides a clear place to accumulate new learning (e.g., additional Requirements); • No free lunch: – Analysis should still pass through normal SME review—this is just a way to generate the first draft faster and in more complete form; – Incomplete models of features, requirements, or failure modes means incomplete failure risk analysis. page 117
6. Using Patterns to Improve Verification • Concept: Patterns help generate better Verification Plans faster—including plans for Design Review, Simulation, System Test, etc. • Verification is concerned with confirming that a candidate design will meet requirements; • In some domains (medicine, flight, etc.), verification represents a high fraction of large costs and time investment—patterns can help reduce this; • Patterns represent: Requirements, Design, and connecting relationships—including the degree of their consistency with each other, as well as the means of verifying it. page 118
There are a limited number of types of potential misalignments to check and close
Scope of Design Verification
Scope of Requirements Review
Shortfall? Overshoot?
Stakeholder Needs
“Keep the product cool.”
Shortfall? Overshoot?
Stakeholder Features
“Product Protection”
Shortfall? Overshoot?
Black Box Requirements
“Maintain storage space o air temperature at 45 o F, +/- 2 .”
Shortfall? Overshoot?
White Box Requirements
Design Component or Subsystem Capabilities
“Measure air temperature accurate o to 0.3 F.”
“Thermodyne Model TC-58 measures air temperature o accurate to 0.25 F.”
(All these misalignments are ultimately measured in terms of their impact on Features.)
page 119
Six questions for Design Review:
5. Do the Components fulfill the requirements allocated to them?
page 120
6. Using Patterns to Improve Verification: An Example • Using the System Pattern, configuring its Features not only configures the Requirements, it also populates the Verification Approach (plan):
page 121
6. Using Patterns to Improve Verification: An Example • Configuring both the Requirements, as well as the High Level Design, also configures the Decomposition and related Verification:
“Maintain storage space o air temperature at 45 o F, +/- 2 .”
“Measure air temperature accurate o to 0.3 F.”
Black Box Requirements
White Box Requirements
Temperature Range (Required) Temperature Range (Capability)
Accuracy (Required) Accuracy (Capability)
“Thermodyne Model TC-58 measures air temperature o accurate to 0.25 F.” Design Component or Subsystem Manufacturer Model No.
page 122
6. Using Patterns to Improve Verification • “Test” includes not just functional testing, but also characterization testing, such as planned in the methods of DOE and Taguchi:
“Keep the product cool.” Stakeholder Needs
“Product Protection for Xiamine”
“Maintain storage space o air temperature at 45 o F, +/- 2 .”
“Measure air temperature accurate o to 0.3 F.”
Stakeholder Features
Black Box Requirements
White Box Requirements
Product Potency (Required) Product Potency (Capability)
Characterization of these parametric couplings is the realm of market research, human factors analysis, consumer research.
Temperature Range (Required) Temperature Range (Capability)
Accuracy (Required) Accuracy (Capability)
“Thermodyne Model TC-58 measures air temperature o accurate to 0.25 F.” Design Component or Subsystem Manufacturer Model No.
Characterization of these parametric couplings is the realm of DOE and Taguchi methods
page 123
6. Using Patterns to Improve Verification • Benefits: – Accumulation of good test methods reduces re-invention of the testing “wheel”. – Accumulation of known design review trace information reduces effort to generate paper design review analysis. – The Pattern provides a place to accumulate this learning.
• No Free Lunch: – Just because we are re-using these assets does not mean we don’t have to think. – For example, we need to assure ourselves that previous test methods and design review decompositions really do apply in the next case at hand.
page 124
Challenges and Opportunities 1. Human hurdles: Inventing from scratch, expertise 2. Organizational hurdles: Better business models are nevertheless unfamiliar Exercise / group discussion: Approaches to my situation
page 125
Human hurdles • Engineers and other designers enjoy creating things—sometimes even if the thing has been created before: – This may lead to re-traveling paths, sometimes re-discovering things the hard way (e.g., overlooking requirements, using oversimplifications, etc.) – In any case, it can expend time and effort in re-generating, revalidating, and re-verifying what others had already done. • In other cases, human subject matter experts provide great expertise: – but it is accessible only in the form of the presence of the SME, and after accumulating years of experience. – Seemingly more a craft of journeymen experts than a discipline based upon teachable principles. • All these challenges can be viewed as resistance to expressing and applying explicit patterns. page 126
Human hurdles • A broad issue across human life: – The science of irrationality – Daniel Kahneman, Nobel Laureate, “Thinking, Fast and Slow”) – “Moneyball”, Oakland A’s, Billy Beane.
• Engineering teams more rational than others? – Ever encounter a bad decision? – A significant fraction of requirements are left unstated
• Patterns existing in Nature do not mean the patterns are recognized by humans page 127
Organizational hurdles: Better business processes are nevertheless unfamiliar
page 128
Challenges and Opportunities: Organizational hurdles • Better business processes may nevertheless be unfamiliar; • Some familiar organizational paradigms can be leveraged in explaining to others: e.g.: – Standards groups, change control boards – Platform management processes – Standard parts processes
page 129
Exercise: What seems most important? What seems most actionable? Pattern Applications & Benefits
Importance
Actionable
1. Stakeholder Features and Scenarios: Better stakeholder alignment sooner 2. Pattern Configuration: Generating better requirements faster 3. Selecting Solutions: More informed trade-offs and design reviews 4. Design for Change: Analyzing and improving platform resiliency 5. Risk Analysis: Pattern-enabled FMEAs
6. Verification: Generating better verifications, tests faster
• Rank importance (1-6 ; 1 = most important) • Rank actionable (1-6 ; 1 = most actionable)
page 130
Exercise / Group Discussion: Approaches to my situation • Write your ideas about what you could do next, in these areas: – Learn more: – Try an experiment: – Build a pattern: – Apply PBSE to: – Take a class: – Other: • The INCOSE Patterns Working Group will meet at IW2017 in LA (January 28-31, 2017): – Contact
[email protected] or
[email protected] if you are interested in this INCOSE working group.
page 131
Conclusions 1. Patterns abound in the world of systems engineering. 2. These patterns extensively impact our projects, whether we take advantage of them as Explicit Patterns, or we are negatively impacted by Dark Patterns. 3. Pattern-Based Systems Engineering (PBSE) offers specific ways to extend MBSE to exploit Patterns. 4. Patterns provide benefits across many SE areas, through better models available at lower costs per project. 5. MBSE comes first—Patterns without Models is like orbital mechanics before Newton: useful but not as powerful as it could be. 6. We’ve had good success applying pattern-based methods in mil/aerospace, automotive, medical/health care, advanced manufacturing, and consumer product domains. 7. In site of the net benefits, change is difficult, so both MBSE and PBSE are not without challenges.
page 132
Representing Systems:
References
1.W. Schindel, “Requirements statements are transfer functions: An insight from model-based systems engineering”, Proceedings of INCOSE 2005 International Symposium, (2005). 2.W. Schindel, “What Is the Smallest Model of a System?”, Proc. of the INCOSE 2011 International Symposium, International Council on Systems Engineering (2011). 3.Schindel, W., “System Interactions: Making The Heart of Systems More Visible”, Proc. of INCOSE Great Lakes Regional Conference, 2013. 4.W. Schindel, “Got Phenomena? Science-Based Disciplines for Emerging Systems Challenges”, Proc. Of the INCOSE 2016 International Symposium, Edinburgh, UK, 2016. Patterns; Pattern-Based Systems Engineering: 5.INCOSE Patterns Working Group, “MBSE Methodology Summary: Pattern-Based Systems Engineering (PBSE), Based On S*MBSE Models”, V1.5.5A, retrieved from: http://www.omgwiki.org/MBSE/doku.php?id=mbse:pbse 6.INCOSE MBSE Initiative Patterns Working Group web site, at http://www.omgwiki.org/MBSE/doku.php?id=mbse:patterns:patterns 7.W. Schindel, “Pattern-Based Systems Engineering: An Extension of Model-Based SE”, INCOSE IS2005 Tutorial TIES 4, (2005). 8.J. Bradley, M. Hughes, and W. Schindel, “Optimizing Delivery of Global Pharmaceutical Packaging Solutions, Using Systems Engineering Patterns” Proceedings of the INCOSE 2010 International Symposium (2010). 9.W. Schindel, and V. Smith, “Results of applying a families-of-systems approach to systems engineering of product line families”, SAE International, Technical Report 2002-01-3086 (2002). 10.W. Schindel, “The Impact of ‘Dark Patterns’ On Uncertainty: Enhancing Adaptability In The Systems World”, INCOSE Great Lakes 2011 Conference, Dearborn, MI, 2011. 11.W. Schindel and T Peterson, “Introduction to Pattern-Based Systems Engineering (PBSE): Leveraging MBSE Techniques”, Tutorial at INCOSE Great Lakes Regional Conference, September, 2016. Systems Engineering in Innovation:
12.Schindel, W., “Introduction to the Agile Systems Engineering Life Cycle MBSE Pattern ”, Proc. Of the INCOSE 2016 International Symposium, Edinburgh, UK, 2016. 13.W. Schindel, S. Peffers, J. Hanson, J. Ahmed, W. Kline, “All Innovation is Innovation of Systems : An Integrated 3-D Model of Innovation Competencies ”, Proc. of ASEE 2011 Conference (2011).
page 133
References Analysis of Architecture, Changeability, Modularity: 14.Carlos A. Osorio, Dov Dori, Joseph Sussman, “COIM: An Object-Process Based Method for Analyzing Architectures of Complex, Interconnected, Large-Scale Socio-Technical Systems”, Systems Engineering Vol. 14, No. 4, pp. 364382, 2011. 15.Jason E. Bartolomei, Daniel E. Hastings, Richard de Neufville, and Donna H. Rhodes, “Engineering Systems Multiple-Domain Matrix: An Organizing Framework for Modeling Large-Scale Complex Systems”, Systems Engineering, Vol. 15, No. 1, pp. 41- 61, 2012. 16.Azad M. Madni, “Adaptable Platform-Based Engineering: Key Enablers and Outlook for the Future”, Systems Engineering, Vol. 15, No. 1, pp. 95-107, 2012. 17.Tobias K.P. Holmqvist and Magnus L. Persson, “Analysis and Improvement of Product Modularization Methods: Their Ability to Deal with Complex Products”, Systems Engineering, Vol. 6, No. 3, pp. 195-209, 2003. 18.Ernst Fricke, and Armin P. Schulz, “Design for Changeability (DfC): Principles To Enable Changes in Systems Throughout Their Entire Lifecycle”, Systems Engineering, Vol. 8, No. 4, pp. 342-359, 2005 19.Avner Engel, * and Tyson R. Browning, “Designing Systems for Adaptability by Means of Architecture Options”, Systems Engineering, Vol. 11: pp. 125–146, 2008. 20. David M. Sharman and Ali A. Yassine, “Characterizing Complex Product Architectures”, Systems Engineering, Vol. 7, No. 1, pp. 35-60, 2004. 21.Adam M. Ross, Donna H. Rhodes, and Daniel E. Hastings, “Defining Changeability: Reconciling Flexibility, Adaptability, Scalability, Modifiability, and Robustness for Maintaining System Lifecycle Value”, Systems Engineering, Vol. 11, No. 3, pp. 246-262, 2008. Other Systems Engineering References: 22.ISO/IEC 15288: Systems Engineering—System Life Cycle Processes. International Standards Organization (2008). 23.INCOSE Systems Engineering Handbook: A Guide for System Life Cycle Processes and Activities, Version 3.2, International Council on Systems Engineering (2010). 24.NASA Systems Engineering Handbook, NASA/SP-2007-6105, Rev 1, U.S. National Aeronautics and Space Administration (2007). 25.W. Schindel, “Failure Analysis: Insights from Model-Based Systems Engineering”, Proceedings of INCOSE 2010 Symposium, July 2010.
page 134
About the presenters Troy Peterson, the Vice President of Systems Strategy, Inc., is a Systems Engineering thought leader helping clients confront critical systems challenges. He's led several teams in the delivery of complex systems and has instituted numerous methodologies to speed development times. His experience spans academic, commercial and government environments across all product life cycle phases. Troy is INCOSE Assistant Director for Transformation of Systems Engineering to a Model Based Discipline, and co-chair of the INCOSE Patterns Working Group. William D. (Bill) Schindel, president of ICTT System Sciences, practices advance of Pattern-Based Systems Engineering across multiple industry domains and applications. His engineering career began in mil/aero systems with IBM Federal Systems, included faculty service at Rose-Hulman Institute of Technology, and founding of three systems enterprises. Bill co-led a project on Systems of Innovation in the INCOSE System Science Working Group. He co-leads the INCOSE Patterns Working Group and is a member of lead teams of the INCOSE Agile SE Life Cycle Discovery Project and the INCOSE Transformation. page 135