Ivo Adan and Jacques Resing: Queueing theory, Eindhoven, The. Netherlands,,
p. 180 ... Advantages. – Simulation allows great flexibility in modeling complex.
Queueing Theory The study of queueing theory requires some background in probability theory and in mathematical simulation.
Mgr. Šárka Voráčová, Ph.D. voracova @ fd.cvut.cz http://www.fd.cvut.cz/department/k61 1/PEDAGOG/K611THO.html
References Sanjay K. Bosse: An Introduction to Queueing Systems, Kluwer Academic, 2002 Ivo Adan and Jacques Resing: Queueing theory, Eindhoven, The Netherlands,, p. 180, 2001 (free pdf, chapter 1-5) Andreas Willig: A Short Introduction to Queueing Theory, Berlin, p. 42, 1999 (free pdf )
Some situations in which queueing is important Supermarket. How long do customers have to wait at the checkouts? What happens with the waiting time during peak-hours? Are there enough checkouts? Post office In a post office there are counters specialized in e.g. stamps, packages, nancial transactions, Are there enough counters? Separate queues or one common queue in front of counters with the same specialization? Data communication. communication In computer communication networks standard packages called cells are transmitted over links from one switch to the next. In each switch incoming cells can be buered when the incoming demand exceeds the link capacity. Once the buffer is full incoming cells will be lost.What is the cell delay at the switches? What is the fraction of cells that will be lost? What is a good size of the buffer?
Utilization
X Waiting Time
Queueing is a common phenomenon in our daily lives. It is impossible to avoid queueing as long as the number of people arrived is greater than the capacity of the service facility. � A long waiting time may result dissatisfaction among customers. However, if one tries to reduce the waiting time, he has to increase the investment. There is a trade off. How to balance efficiency and cost? At this time, Queueing Theory is introduced to solve the problems. � Queueing Theory is important when we study scheduling and network performance. �
Queuing psychology: Can waiting in line be fun � � �
Invironment - Occupied time feels shorter than unoccupied time Expectation - Uncertain waits are longer than known, finite waits Unexplained waits are longer than explained waits Fair Play - Unfair waits are longer than equitable waits
Historie Agner Krarup Erlang, a Danish engineer who worked for the Copenhagen Telephone Exchange, published the first paper on queueing theory in 1909. � David G. Kendall introduced an A/B/C queueing notation in – 1953 Kendall notation – 1969 Little’s formula – 1986 1st No - The Journal of Queueing Systems – 1995 1st international symposium THO �
Investigation Methods - Simulation �
Advantages – Simulation allows great flexibility in modeling complex systems, so simulation models can be highly valid – Easy to compare alternatives – Control experimental conditions
�
Disadvantages – Stochastic simulations produce only estimates – with noise – Simulations usually produce large volumes of output – need to summarize, statistically analyze appropriately
Estimation of quantities: Expected value - Mean, Probability - rel.frequency
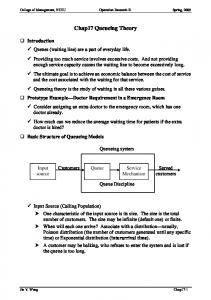
Example - Traffic system Intersection Signal Control Optimization Dynamic signal control for congested traffic
Dependance of delay and traffic intensity
Dependance of delay and duration of the cycle of signál plan
E(tw)/[t]
E(tw)[t]
bez SSZ
800
SSZ
Intensity car/hour
C
Duration
Queueing System
Customers arrive
Queue
Service system
Waiting lines
Customers exit
Fundamentals of probability � � � �
The set of all possible outcomes of random experiment - sample space Event – subset of the sample space Impossible event – empty set All sample points – certain event
N ( A) N →∞ N
P( A) = lim
Property of probability
0 ≤ P( A) ≤ 1 P( A ∪ B) = P( A) + P(B) − P( A ∩ B) P( A´) = 1− P( A) A ⊂ B ⇒ P( A) ≤ P(B)
Independent Events � �
Two events are said to be independent if the result of the second event is not affected by the result of the first event Example
P( A ∩ B) = P( A).P( B)
Random variable
� �
Discrete (can be realized with finite or countable set) Continuous (can be realized with any of a range of values I⊂R) – Cumulative distribution function
F ( x) = P( X ≤ x)
- Probability density function x
F ( x) =
∫
−∞
b
f (u )du
F (b) − F (a ) = ∫ f (u )du a
Mean, Variance, Standart Deviation �
Expected value – Discrete
– Continuous
E [ x ] = ∑ xi P ( X = xi ) i
E[ X ] =
∞
∫ x ⋅ f ( x ) dx
−∞
Properties: E[c.X] = c.E[X] E[X+Y] = E[X] + E[Y] E[X .Y] = E[X] . E[Y] for independent X, Y
�
Variance – Discrete
V [ x ] = ∑ ( xi − E [ X ] ) P ( X = xi ) 2
i
– Continuous
V[X ] =
∞
∫ ( x − E( X ))
−∞
2
⋅ f ( x ) dx
Probability Distributions
�
Discrete –if variable can take on finite ( countable) number of values – Binomial – Poisson
�
Continuous – if variable can take on any value in interval – – – –
Uniform Normal Exponential Erlang
http://www.socr.ucla.edu/htmls/SOCR_Distributions.html
Binomial Distribution �
probability of observing x successes in N trials, with the probability of success on a single trial denoted by p. The binomial distribution assumes that p is fixed for all trials. n i E[ X ] = n ⋅ p p = P( X = i) = p (1 − p ) n −i
i
i
V [ X ] = np (1 − p )
Příklad: Test consists of 10 questions, you can choose from 5 answers. 1. Probability, that all answers are wrong 10
1 P ( X = 0 ) = 1 − � 0,11 5 2.
Probability, that all answers are right 10
3.
1 P ( X = 0 ) = � 0, 0000001 5
At least 7 correct answers
P ( X ≥ 7 ) = P ( X = 7 ) + P ( X = 8 ) + P ( X = 9 ) + P ( X = 10 ) � 0, 000864 4.
Expected value of No of correct marked answers 1 E ( X ) = 10 ⋅ = 2 5
Uniform distribution
f ( x) =
1 ; a≤ x≤b b−a
( a + b) a+b ; V[X ] = E[ X ] = 2 12
2
Příklad: Subway go regularly every 5 minut. We come accidentally. 1. Probability,That we will wait at the most 1 minute 1 f ( x) = ; 0 ≤ x ≤ 5 5 1
2.
Expected waiting time
1
1 1 1 P ( x < 1) = ∫ dx = x = 5 5 0 5 0
5 E[ X ] = ; 2
Exponential distribution f ( x) = λ e − λ x ; 0 ≤ x F ( x) = 1 − e − λ x E[ X ] =
1
λ
; V[X ] =
1
λ2
Example: 1. Period between two cars (out of town)Has exponential distribution λ. The mean number of cars per hour: E[T ] =
2.
1
λ
Trouble free time for new car ~ exp(1/10) [time unit - year]. a) 5 year without any fault. 1 1 − x − 10 2 P ( X ≥ 5) = 1 − F ( 5 ) = 1 − 1 − e = e = 0, 606
b) Expected value for period without defect. E[T ] =
1 = 10 (let ) 0.1
Poisson distribution of disrete random variable �
probability of a number of events occurring in a fixed period of time if these events occur with a known average rate and independently of the time since the last event. P ( N (t ) = k ) =
(λ t ) k!
k
e − λt
E[ X ] = λ ⋅ t
Erlang distribution X~ Erlang(λ,k)
(λ x) ; f ( x) = λ e− λ x ( k − 1)! k −1
0 ≤ x E[ X ] =
k
λ
; V[X ] =
k
λ2
Sum of k independent exponential random variable Xi ~exp(λ) X ~ Erlang(λ,k)
Normal distribution X ~ N(µ,σ2)
1 f ( x) = e 2πσ
2 x−µ ) ( −
2σ 2
Introduction to Simulation and Modeling of Queueing Systems
THE NATURE OF SIMULATION
System: A collection of entities (people, parts, messages, machines, servers, …) that act and interact together toward some end (Schmidt and Taylor, 1970) � To study system, often make assumptions/approximations, assumptions/approximations both logical and mathematical, about how it works � These assumptions form a model of the system � If model structure is simple enough, could use mathematical methods to get exact information on questions of interest — analytical solution �
input
S
output
Systems �
Types of systems – Discrete • State variables change instantaneously at separated points in time • Bank model: State changes occur only when a customer arrives or departs – Continuous • State variables change continuously as a function of time • Airplane flight: State variables like position, velocity change continuously
�
Many systems are partly discrete, partly continuous
ADVANTAGES OF SIMULATION �Most
complex systems reguire complex models
�Uncommon �Easy
situation
to campare alternatives
�Expenditures –Build it and see if it works out? –Simulate current, expanded operations — could also investigate many other issues along the way, quickly and cheaply
�Simulation
process
provide better comprehension of inner
Drawback of Simulation – Models of large systems are usually very complex • But now have better modeling software … more general, flexible, but still (relatively) easy to use – Stochastic simulations produce only estimates – with noise • Simulations usually produce large volumes of output – need to summarize, statistically analyze – Impression that simulation is “just programming” • In appropriate level of detail - tradeoff between model accuracy and computational efficiency • Inadequate design and analysis of simulation experiments – simulation need careful design and analysis of simulation models – simulation methodology
Application areas – Designing and operating transportation systems such as airports, freeways, ports, and subways – Evaluating designs for service organizations such as call centers, fast-food restaurants, hospitals, and post offices – Analyzing financial or economic systems
Monte Carlo Simulation
Number of runs N
No time element (usually) � Wide variety of mathematical problems � Example: Evaluate a “difficult” integral – –
b
NB =0, SΩ=
I = ∫ f ( x) a
Let x~ U(a, b), and let y ~ U(a, b); Algorithm: Generate x ~ U(a, b), let y ~ U(a, b); repeat; integral will be estimate on a relative frequency.
Ω
d
i=1..N x ∼ U a, b
Ω = a, b × 0, d
y ∼ U 0, d
area of Ω: SΩ = d b − a
f(x)
[ x, y ] ∈ B +
b
y
B a
I = ∫ f ( x) = SB
X
NB = NB+1
a
x
X … random point from Ω
b X ∈ B ⇔ f ( x) > y
Geometric probability: P( X ∈ B ) =
S B = SΩ
SB SΩ
Probability is estimate on frequency P ( X ∈ B ) =
NB NΩ
S B = SΩ
NB N
NB N
0.5069337796517863 -1.1990260943909907 0.26505726444267585 -1.854711766852047 -1.4050150896076032 -0.17275028150144303 -0.3817032401725773 -0.43513693709188666 0.5542356519201573 0.3889663414546052 2.859126301717398 0.9727562577423773 0.5598916815276701 0.38242700896374465 -0.07907552859173163 0.5357541687700696 -0.04447830919338274 1.7795888259824646 -1.4581832070349238 0.12294379539951389 0.657723445793143 -1.5941767391224992 -1.2708787314281355 -0.5238183331104613 -0.36917071169315707 -1.3565030009127183 0.28153491504853023 1.348719082678584 -0.10598961382359845 0.10833847688122822 -1.3677192275044773 -0.051733234063638056 -1.0245136587486698 -0.4719250601619712 2.5932463936402032 -0.5468976666902965
Random variable
Y=rand(n)
Random number generator
1. Uniform distribution < a ,b >
1
1 b−a
a
b
a
b
Suppose, we have random number from unimormly distributed variable Y ∼ uniform a, b 1
Yi = a + (b − a ) X i 0
1
X ∼ uniform 0,1
Universal method for random number transformation Values of Distribution function Xi=F(Yi) have a uniform distribution X i ∼ uniform 0,1
F(y) F(yi)=x1i
P (Yi < Y0 ) = F (Y0 )
yi a
b
Y
P (Yi < F −1 ( X 0 ) ) = X 0
(
)
Y ∼ uniform a, b
P F (Y )i < X 0 = X 0
y−a x = F ( y) = b−a Yi = X i (b − a ) + a
P ( Xi < X0 ) = X0 F ( X0 ) = X0
2. Exponential distribution f ( y ) = λe−λ y F ( y ) = 1 − e−λ y
x = 1 − e−λ y e−λ y = 1 − x −λ y = ln (1 − x ) y=
ln (1 − x ) −λ
function y=randexp(n,b) %random variable~exp(b) for i=1:n x(i)=rand; y(i)=-log(1-x(i))/b; End
>> delay=randexp(200,2); >> hist(delay,30)
3. Erlang distribution f ( y) =
λ k y k −1
( k − 1)!
e− λ y
součet k nezávislých náhodných veličin s exponenciálním rozdělením
function y=erlang(n,b,k) %vector(n,1) of random %variable ~ erlang(b,k) for i=1:n y(i)=0 for j=1:k x(j)=randexp(1,b); y(i)=y(i)+x(j); end end
>> delay=erlang(5000,2,3); >> hist(delay,50)
4. Normal normální rozdělení f ( y) =
1 ⋅e σ 2π
2 y−µ ) ( −
2σ 2
X=randn(n) function y=norm_ab(n,s) %vector(n,1) of normal %variable ~ N(a,b) x=randn(n,1); y=x*s+n
X ∼ N ( 0,1)
Y ∼ N ( µ ,σ 2 )
Y = µ +σ X
>> delay=norm_ab(1000,4,2); >> hist(delay,30)
4. Raylleigh distribution F ( y) = 1 − e
f (t ) =
2( y − a) ⋅e 2 c
−
2 y −a ) ( −
c2
Yi = a + c − ln X i
( y − a )2 c2
>> delay=norm(1000,1,4); >> hist(delay,30) function y=randreyll(n,a,c) %vector(n,1) of Reyll’s %variable ~ R(a,c) x=rand(n,1); y=c*sqrt(-log(x))+a;
Time-Advance Mechanisms Simulation clock: Variable that keeps the current value of (simulated) time in the model � Two approaches for time advance �
– Next-event time advance – Event: Instantaneous occurrence that may change the state of the system – Fixed-increment time advance
Matlab - Simulink