Proceedings of the International Multiconference on Computer Science and Information Technology pp. 117–123
ISBN 978-83-60810-22-4 ISSN 1896-7094
Intrusion Detection in Web Applications: Evolutionary Approach Jaroslaw Skaruz Institute of Computer Science, University of Podlasie, Sienkiewicza 51, 08-110 Siedlce, Poland, Email:
[email protected]
Franciszek Seredynski Polish-Japanese Institute of Information Technology, Koszykowa 86, 02-008 Warsaw Polish Academy of Sciences, Ordona 21, 01-237 Warsaw, Poland, E-mail:
[email protected] Abstract—A novel approach based on applying a modern metaheuristic Gene Expression Programming (GEP) to detecting web application attacks is presented in the paper. This class of attacks relates to malicious activity of an intruder against applications, which use a database for storing data. The application uses SQL to retrieve data from the database and web server mechanisms to put them in a web browser. A poor implementation allows an attacker to modify SQL statements originally developed by a programmer, which leads to stealing or modifying data to which the attacker has not privileges. While the attack consists in modification of SQL queries sent to the database, they are the only one source of information used for detecting attacks. Intrusion detection problem is transformed into classification problem, which the objective is to classify SQL queries between either normal or malicious queries. GEP is used to find a function used for classification of SQL queries. Experimental results are presented on the basis of SQL queries of different length. The findings show that the efficiency of detecting SQL statements representing attacks depends on the length of SQL statements. Additionally we studied the impact of classification threshold on the obtained results.
I. I NTRODUCTION
N
OWADAYS a lot of business applications are deployed in companies to support them with their business activity. These applications are often built with three layer manner: presentation, logical and data. Examples of the data layer are files and the databases containing data while the form of the presentation layer can be a desktop window or a Web site presenting data derived from the data layer and providing application functions. The logical layer is responsible for establishing connection to the database, retrieving data and putting them at the presentation layer. To manage data in the database usually SQL statements are used. When a user executes an application function then SQL query is sent to the database and the result of its execution is shown to the user. Possible security violations exist due to poor implementation of the application. If data provided by the user are not validated then he can set malicious values of some parameters of SQL query, which leads to the change of the form of the original SQL query. In that case the attacker receives not authorized
access to the database. While SQL is used to manage data in the databases, its statements can be ones of sources of events for potential attacks. The security concern related to business applications aims at ensuring data integrity and confidentiality. One security solution is an intrusion detection system available on the market. It is the application based on attack signatures. When malicious activity matches a signature then an attack is detected. The drawback of this class of security countermeasure is that only those attacks can be detected, which signatures exist. Unfortunately, every a few weeks or even days new security holes are discovered, which allow the attacker to break into the application and steal data [15]. The objective of this work is to build an intelligent system based on GEP, which detects currently known attacks and those, which can occur in the future. In the literature there are some approaches to intrusion detection in Web applications. In [10] the authors developed anomaly-based system that learns the profiles of the normal database access performed by web-based applications using a number of different models. A profile is a set of the models, to which parts of SQL statement are fed to in order to train the set of the models or to generate an anomaly score. During training phase the models are built based on training data and anomaly score is calculated. For each model, the maximum of anomaly score is stored and used to set an anomaly threshold. During detection phase, for each SQL query anomaly score is calculated. If it exceeds the maximum of anomaly score evaluated during training phase, the query is considered to be anomalous. The number of attacks used in that work was small and the obtained results with the final conclusion should be confirmed. Besides that work, there are some other works on detecting attacks on a Web server which constitutes a part of infrastructure for Web applications. In [6] a detection system correlates the server-side programs referenced by clients queries with the parameters contained in these queries. It is a similar approach to detection to the previous work. The system analyzes HTTP requests and builds data model based on the attribute length of requests, attribute character distribution, structural inference
117
118
PROCEEDINGS OF THE IMCSIT. VOLUME 4, 2009
and attribute order. In a detection phase built model is used for comparing requests of clients. In [9] the authors discuss some hints for intruders to be not detected by intrusion detection systems.The study shows weakness of intrusion detectors and shows how an attacker can effectively modify common exploits to take the advantage of those weakness in order to craft an offensive mechanism that renders an anomaly-based intrusion detector blind to the on-going presence of those attacks. In [1] logs of Web server are analyzed to look for security violations. However, the proposed system is prone to high rates of false alarm. To decrease it, some site-specific available information should be taken into account which is not portable. The paper is organized as follows. The next section discusses SQL attacks. In section 3 we describe GEP. Section 4 shows training data used for experiments. Next, section 5 contains experimental results. Last section summarizes results. II. SQL
ATTACKS
SQL injection attack consists in such a manipulation of the application communicating with the database, that it allows the user to gain access or to allow it to modify data for which the user has not privileges. To perform an attack in the most cases Web forms are used to inject part of SQL query. Typing SQL keywords and control signs the intruder is able to change the structure of SQL query developed by a Web designer. If variables used in SQL query are under control of a user, he can modify SQL query which will cause change of its meaning. Consider an example of a poor quality code written in PHP presented below.
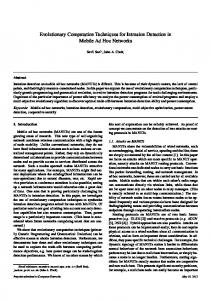
Two dashes comment the following text. Boolean expression 1=1 is always true and as a result the user will be logged with privileges of the first user stored in the table users. III. G ENE E XPRESSION P ROGRAMMING A. Overview GEP is a modern metaheuristic originally developed by Ferreira [2]. It incorporates ideas of natural evolution derived from genetic algorithm (GA) and evolution of computer programs, which comes from genetic programming (GP) [5]. Since its origination GEP has been extensively studied and applied to many problems such as: time series prediction [7][14], classification [12][13] and linear regression [3]. GEP evolves a population of computer programs subjected to genetic operators, which leads to population diversity by introducing a new genetic material. GEP incorporates both linear chromosomes of fixed length and expression trees (ET) of different sizes and shapes similar to those in GP. It means that in opposite to the GP genotype and phenotype are separated. All genetic operators are performed on linear chromosomes while ET is used to calculate fitness of an individual. There is a simple method used to translation from genotype to phenotype and inversely. The advantage of distinction between genotype and phenotype is that after any genetic change of a genome ET is always correct and solution space can be searched through in a more extent. The scheme of the algorithm is presented in the figure 1.
$connection=mysql_connect(); mysql_select_db("test"); $user=$HTTP_GET_VARS[’username’]; $pass=$HTTP_GET_VARS[’password’]; $query="select * from users where login=’$user’ and password=’$pass’"; $result=mysql_query($query); if(mysql_num_rows($result)==0) echo "authorization failed"; else echo "authorization successful" The code is responsible for authorizing users. User data typed in a Web form are assigned to variables user and pass and then passed to the SQL statement. If retrieved data include one row it means that the user filled in the form login and password the same as stored in the database. Because data sent by a Web form are not validated, the user is free to inject any strings. For example, the intruder can type: ’ or 1=1 - - in the login field leaving the password field empty. The structure of the SQL query will be changed as presented below. $query="select * from users where login =’’ or 1=1 --’ and password=’’";
Fig. 1.
GEP scheme
At the beginning chromosomes are generated randomly. Next, in each iteration of GEP, a linear chromosome is
JAROSLAW SKARUZ ET. AL: INTRUSION DETECTION IN WEB APPLICATIONS
119
expressed in the form of ET and executed. The fitness value is calculated and termination condition is checked. To preserve the best solution in a current iteration, the best individual goes to the next iteration without modifications. Next, programs are selected to the temporary population, they are subjected to genetic operators with some probability. New individuals in temporary population constitute current population.
ET of different sizes and shapes. A genetic change of the gene causes lengthen and shorten of ET. A chromosome can be built from a few genes. Then subETs are linked by a function - parameter of GEP. For detailed explanation of all genetic operators see [2], [3].
B. The Architecture of Individuals The genes of GEP are made of a head and a tail. The head contains elements that represent functions and terminals while the tail can contain only terminals. The length of the head is chosen as a GEP parameter, whereas the length of the tail is calculated according to the eq. 1: tail = h(n − 1) + 1,
(1)
where h is the length of the head and n is a number of arguments of the function with more arguments. Consider an example of a gene presented in eq. 2: +Qd/ + cabdbbca.
(2)
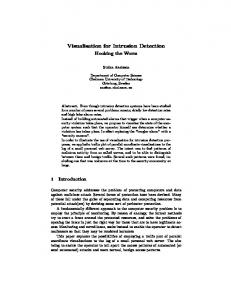
Its encoded form is represented by ET and shown in figure 2. The length of the gene head presented in eq. 2 equals to 6
C. Fitness function In the problem of anomaly detection there are four notions, which allow to look inside performance of the algorithm. True positives (TP) relates to correctly detecting attacks while false positive (FP) means that normal SQL queries are considered as an attack. False negative (FN) concerns attacks as normal SQL queries and true negative (TN) relates to correctly classified normal SQL statements. It is obvious that the larger both TP and TN the better mechanism of classification. To assess an individual, its fitness should be evaluated. In this work we use sensitivity and precision, which are the most widely used statistics used to describe a diagnostic test [8]. The sensitivity measures proportion of correctly classified attacks and precision refers to the fraction of correctly classified attacks over the number of all SQL queries, which are classified as attacks. Sensitivity and precision are calculated according to eq. 4 and eq. 5: sensitivity =
TP , TP + FN
(4)
TP . (5) TP + FP Eq. 6 relates to fitness calculation of an GEP individual: precision =
f itness = 2 ∗
precision ∗ sensitivity . precision + sensitivity
(6)
An individual representing the optimal solution of the problem has fitness equals to 1.0 and the worst chromosome has 0.0. GEP evolve the population of individuals to maximize their fitness value. IV. T RAINING Fig. 2.
Expression tree
and the length of the tail equals to 7 according to eq. 1. The individual shown in figure 2 can be translated to the mathematical expression 3: r a+b + d. (3) c To construct ET from the linear gene, the analysis must start from the left to the right of the gene elements. The first element of the gene is a root of ET. Next, take the such a number of the following elements of the gene that equals to the number of parameters of the function previously taken and put them below it. If a node is a terminal then a branch is completed. If this algorithm of constructing ET is followed it can be seen that some of elements in the tail of the gene do not occur in ET. This is a great advantage of GEP as it is possible to build
DATA
All experiments were conducted using synthetic data collected from a SQL statements generator. The generator takes randomly a keyword from selected subset of SQL keywords, data types and mathematical operators to build a valid SQL query. Since the generator was developed on the basis of the grammar of the SQL language, each generated SQL query is correct. We generated 3000000 SQL statements. Next, the identical statements were deleted. Finally, our data set contained thousands of free of attack SQL queries. The set of all SQL queries was divided into 20 subsets (instances of the problem), each containing SQL statements of different length, in the range from 10 to 29 tokens (see below). Data with attacks were produced in the similar way to that without attacks. Using available knowledge about SQL attacks, we defined their characteristic parts. Next, these parts of SQL queries were inserted randomly to the generated query in such a way that it provides grammatical correctness of these new statements. Queries in each instance were divided into two
120
PROCEEDINGS OF THE IMCSIT. VOLUME 4, 2009
TABLE I A
TABLE II S ETTINGS OF THE ALGORITHM
PART OF A LIST OF TOKENS AND THEIR CODING VALUES
token SELECT FROM ... ... UPDATE ... number string
index 1 2 ... ... 9 ... 35 36
coding value 0.1222 0.1444 ... ... 0.3 ... 0.8777 0.9
parts: for training GEP and testing it. Each of the part contains 500 SQL statements. Classification of SQL statements is performed on the basis of their structure. Each SQL query is divided on distinct parts, which we further call tokens. In this work, the following tokens are considered: keywords of SQL language, numbers and strings. We used the collection of SQL statements to define 36 distinct tokens. The table I shows selected tokens, their indexes and the coding real values. Each token has assigned the real number. The range of these numbers starts with 0.1 and ends with 0.9. The values assigned for the tokens are calculated according to eq. 7: coding vallue = 0.1 + (0.9 − 0.1)/n ∗ k,
(7)
where n is the number of all tokens and k is the index of each token. Below, there is an example of a SQL query: SELECT
name
F ROM
users
(8)
To translate the SQL query the table I is searched through to meet a token. The first token of the SQL query shown in eq. 8 is SELECT and the corresponding coding value equals to 0.1222. This step is repeated until all tokens are translated. Finally a vector: 0.1222, 0.9, 0.1444, 0.9 is received as an encoded form of query represented by eq. 8. All elements of the vector are terminals used to generating individuals of GEP. V. E XPERIMENTAL
RESULTS
In this section we are going to use GEP to find a function that can be used to classify SQL statements. Data used in this experiment are described in section IV. Each of twenty instances of the problem consists of two parts: training and testing data. Each time GEP was run first on training part of an instance of the problem and next found classification rule was tested on the second part of the instance. A. Study on the threshold value Widely used methodology of experimental study first involves evaluating the values of parameters of the algorithm, for which the algorithm performance is the best. This task is often performed in the following way. First examine a value of the first parameter in some extent and check the performance of the algorithm. Next choose the best value of the first parameter as a constant and evaluate the other parameters in the same way. However, there is a problem with that approach. There
number of generations population size function set terminal set threshold head length number of genes linking function chromosome length mutation rate inversion rate IS transposition rate RIS transposition rate one-point recombination rate two-point recombination rate gene recombination rate gene transposition rate
500 100 +-*/ 10-29 0.0-2.0 8 3 + 51 0.044 0.1 0.1 0.1 0.3 0.3 0.1 0.1
TABLE III T HE AVERAGE OF FALSE ALARMS - TRAINING PHASE threshold value avg fp avg fn
0.1 29.65 7.53
0.5 28.62 7.71
1.0 29.67 6.68
1.5 29.36 7.48
2.0 32.57 5.81
could be some relations between parameters and the correct sequence of evaluating of parameters is unknown. Difficulties increase according to the number of parameters, which relates especially to GEP using 17 parameters. In this work we apply in the most cases the same values of parameters as in [4]. All parameters of GEP are presented in the table II. As the search space is bigger than this in [4], the number of individuals was increased to 100. In classification problems the output of a classification algorithm is often binary. Here, we must convert a real value which is a product of an evolved computer program into 0 or 1. For this reason we use a threshold value which is a parameter of the GEP. When the result of execution of an GEP individual is greater than value of the threshold then SQL query is normal, otherwise it is considered as an attacker activity. Threshold value was selected experimentally. GEP was run 10 times and the obtained results we averaged. The percentage average of false positive and false negative for 5 different values of threshold are presented in the tables III and IV. The experiment was performed using 20 instances. Average value of false alarms was calculated among results of all instances. From the table III we can see differences between false alarms for various threshold values. The lowest false positive rate is obtained for 0.5 value of the threshold while the lowest false negative rate relates to 2.0. These two values of the threshold are appropriate for this specific classification probTABLE IV T HE AVERAGE OF FALSE ALARMS - TESTING PHASE threshold value avg fp avg fn
0.0 30.28 8.22
0.5 29.17 8.38
1.0 30.51 7.29
1.5 29.95 8.06
2.0 33.43 6.85
JAROSLAW SKARUZ ET. AL: INTRUSION DETECTION IN WEB APPLICATIONS
121
lem. Search space of each problem is different and the shape of landscape can involve using some problem specific values of parameters. The table IV presents results of classification data from the testing set. It confirms that values evaluated during training are appropriate. The lowest sum of false alarms rate relates to 0.5 value of the threshold. The best efficiency of detecting misuse SQL statements was obtained when 2.0 value of the threshold was used. While it is more essential for the algorithm to detect more abnormal SQL queries (lower false negative rate), we finally chose 2.0 value.
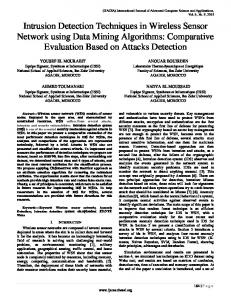
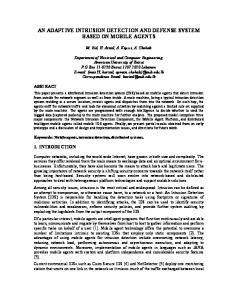
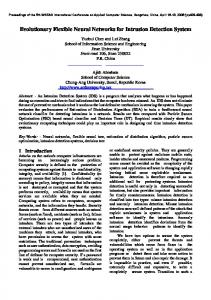
alarm rate are averaged over 10 runs of GEP. Such results of the experiment allow to say that the best evolved mathematical expression classifies SQL queries in the testing set with nearly the same efficiency as in the training set. One of the reasons this happens is that although SQL statements are placed randomly to both data sets, they features similar structure in both data sets, which were used in the classification task. From the figure 4 it can be seen that the false negative rate changes in small extent for SQL queries of different length. The averaged FN over SQL queries with various number of tokens equals to 6.85 (see table IV) and the standard deviation equals to 2.6. At the same time the averaged FP rate equals to 33.43 with the standard deviation equals to 14.54. SQL statements constituted from 10 to 15 tokens are classified with lower error than longer SQL queries. For these shorter queries, the averaged sum of false alarms for each length of SQL equals to 17.4%. Figure 4 presents common behavior of all anomaly detection systems. In the most cases FP increase leads to FN decrease. When FP decreases then FN increases. Such a feature exists because for any classification algorithm it is easy to assign all data to eg. class I. When data, which belong to class II are moved to class II there are some data of class I which are classified incorrectly. Figure 5 shows fitness of the best individual for SQL queries consisting of 10, 20 and 29 tokens.
B. Intrusion detection accuracy In this classification problem very simple set of functions was chosen, which consists of arithmetic operators (+, -, *, /). The set of terminals depends on the length of SQL queries used for training. The number of terminals equals to the number of tokens, which constitute SQL query. As a selection operator roulette wheel was chosen. Figures 3 and 4 show detection system performance during training and testing, respectively. False alarms - training phase 50 false positive false negative
False alarms
40
30
GEP performance
20 1
10 20 29 0.95
10
0.9 10
12
14
Fig. 3.
16
18 20 22 The length of SQL query
24
26
28
GEP performance for training phase
fitness function
0 0.85
0.8
0.75 False alarms - testing phase 0.7
50 false positive false negative
0.65 5
40
False alarms
Fig. 5.
10
15
20 iteration
25
30
35
40
Algorithm run for SQL queries made of 10, 20 and 29 tokens
30
20
10
0 10
12
14
Fig. 4.
16
18 20 22 The length of SQL query
24
26
28
GEP performance for testing phase
It is easily noticeable that the false alarms rate in both figures are very similar. Presented percentage values of false
The findings show a great ability of GEP to find a good solution. At the beginning of the algorithm better solutions are found quickly. Next, they are improved a few times. The best fitness is obtained for SQL queries made of 10 tokens. The longer SQL statements are classified with nearly the same extent, which is confirmed by the charts in 40 generation for queries with 20 and 29 tokens. This happens because the search space increased greatly in this experiment. There are two times more input features than in queries with 10 tokens. The solution found in the first iteration of the algorithm for the instance with 29 tokens is a bit worse than in the both previous cases but quickly (in 6 iteration) better solution was found. The
122
PROCEEDINGS OF THE IMCSIT. VOLUME 4, 2009
TABLE V T HE AVERAGE OF FALSE ALARMS FOR EACH LENGTH SQL QUERY length of SQL query 10 11 12 13 14 15 16 17 18 19 20 21 22 23 24 25 26 27 28 29
avg of FP and FN 7.53 6.14 4.97 8.07 11.66 13.84 22.38 17.9 22.21 25.68 24.02 24.97 22.34 21.76 24.54 23.96 21.26 25.78 25.65 21.93
Fig. 6.
fitness of the best individual is a bit greater than the fitness of the best individual related to experiment on 20 length SQL queries. To better understand classification accuracy of SQL queries, in the table V we show averaged FP and FN for each length of SQL query. The ability of classifying longer than 15 tokens SQL queries equals to about 75%-79%. For shorter queries correct detection efficiency is over 90%. The form of the best individual for the instance with SQL statements constituted from 10 tokens is shown below. The chromosome consists of three genes, each one linked by plus operator.
The best individual for SQL queries with 10 tokens
where the numbers in the classification function depict positions of tokens within SQL statements. The classification function for the instance with 10 tokens was discovered in 36 iteration of GEP. When the function represented by the chromosome is used with the threshold 2.0, 56 normal SQL queries are classified as attacks and all attacks are classified correctly in the training set. In the test set 64 SQL normal statements are classified as attacks and all attacks were detected. Figure 7 presents expression tree representing the best individual for the instance with SQL queries constituted from 20 tokens.
+.1.7.9.2.7.5.*.10.7.6.1.9.3.5.2.7 *.9.*.5.10.+.1.10.3.1.6.1.5.9.2.7.10 +.7.3.5.10.*./.10.10.8.9.1.9.6.10.2.10 Dots separate elements of the genes. The numbers above represent subsequent tokens, which exist as the product of division of SQL statements on tokens. In the first gene the function in the root is plus function, which takes two arguments. The following arguments: terminal number 1 and 7 are put on the second level in ET. Let us consider an example of SQL query presented below. select name, surname, age, address from users order by 2 The first terminal is keyword SELECT, the second terminal is data type string. The last terminal is data type number. To calculate the value of the function represented by the first gene of the best individual for the SQL query presented above terminals 1 and 7 should be added. From the table I coding value of the keyword select and data type string are read and used to calculation the result. The same procedure is repeated for the next genes. The form of ET related to the individual presented above is shown in the figure 6. ET transformed to the mathematical expression is presented in eq. 9: 1 + 7 + (9 ∗ 5 ∗ 10) + 7 + 3,
(9)
Fig. 7.
The best individual for SQL queries with 20 tokens
Similar to the previous ET, it contains only the subset of tokens, which may occur on various positions in SQL query. It means that during evolution the most informative tokens were included into individual while tokens, which were not important in classification task did not take part in building the best individual.
JAROSLAW SKARUZ ET. AL: INTRUSION DETECTION IN WEB APPLICATIONS
123
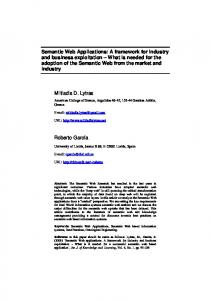
Figure 8 shows the number of various tokens used for constructing the classification rule during each iteration of GEP. The number of tokens was calculated among the best
genotype leads to a great change in phenotype, which is also considered in the literature [11]. The drawback of this is that it is quite difficult to pass a lot of good quality individuals in the next generations. On the other hand search space is searched through in more extent. Undisputed advantage of GEP is ability to find a good quality solution very quickly, in a few iterations. Our research will focus on studying GEP in details. We believe that it is possible to keep the advantages of GEP and at the same time to make ETs less susceptible to great changes.
Evolution of the classification function 1 4 5 6 7 8
25
maximum number of tokens
20
15
R EFERENCES
10
5
5
10
15
20
25
30
35
40
iteration
Fig. 8.
The form of the classification rule evolution
20 individuals. It can be noticed that there are two groups of tokens presented in the figure 8. In the first iteration of GEP the initial number of tokens contained in 20 individuals is nearly the same. During evolutionary process some tokens, which make the classification function more powerful, occur more often in the individuals. At the same time there are also some unuseful tokens, which does not allow classify SQL queries. Tokens at position 8, 6 and 4 within SQL queries are not needed for classification of SQL queries made of 10 tokens and their existence in the individuals decreases in the next iterations of GEP. VI. C ONCLUSIONS In the paper we have presented an application of modern evolutionary metaheuristic to the problem of detecting intruders in Web applications. We shown typical SQL attack and transformation the problem of anomaly detection to classification problem. An interesting improvement of GP GEP was presented and its the most important part, which is genotype and phenotype. Experiments were conducted on the basis of synthetically generated SQL queries of length the from 10 to 29 tokens. Classification accuracy depicts great efficiency for SQL queries constituted from 10 to 15 tokens. For longer statements the averaged FP and FN equals to about 23%. We have also presented dynamics of GEP, which reveals some important features. On the one hand minimal change in
[1] M. Almgren, H. Debar, M. Dacier, “A lightweight tool for detecting web server attacks”, Proc. ISOC Symposium on Network and Distributed Systems Security, San Diego, CA, Feb. 2000, pp. 157–170 [2] C. Ferreira, “Gene Expression Programming: A New Adaptive Algorithm for Solving Problems”, Complex Systems, vol. 13, issue 2, 2001, pp. 87–129 [3] C. Ferreira, Gene Expression Programming: Mathematical Modeling by an Artificial Intelligence. Portugal: Angra do Heroismo, 2002 [4] C. Ferreira, “Gene Expression Programming and the Evolution of Computer Programs”. in Handbook of Intelligent Control: Neural, Fuzzy, and Adaptive Approaches (Recent Developments in Biologically Inspired Computing), Edited by L. N. de Castro and F. J. Von Zuben, Idea Group Publishing, 2004 [5] J. R. Koza, Genetic Proramming: On the Programming of Computers by Means of Natural Selection, Cambridge, MA: MIT Press, 1992 [6] C. Kruegel, G. Vigna, “Anomaly Detection of Web-based Attacks”, Proc. 10th ACM Conference on Computer and Communication Security, 2003, pp. 251–261 [7] V. I. Litvinenko, P. I. Bidyuk, J. N. Bardachov, V. G. Sherstjuk, and A. A. Fefelov, “Combining Clonal Selection Algorithm and Gene Expression Programming for Time Series Prediction”. Proc. Third Workshop 2005 IEEE Intelligent Data Acquisition and Advanced Computing Systems: Technology and Applications, 2005, pp. 133–138, [8] S. Linn, “A New Conceptual Approach to Teaching the Interpretation of Clinical Tests”, Journal of Statistics Education, vol. 12, no. 3, 2004 [9] K. M. C. Tan, K. S. Killourhy, R. A. Maxion, “Undermining an AnomalyBased Intrusion Detection System Using Common Exploits”, Proc. 5th International Symposium on Recent Advances in Intrusion Detection, Springer, LNCS, 2002, pp. 54–73 [10] F. Valeur, D. Mutz, G. Vigna, “A Learning-Based Approach to the Detection of SQL Attacks”, Proc. Conference on Detection of Intrusions and Malware and Vulnerability Assessment, Austria, 2005 [11] L. Xin, C. Zhou, W. Xiao, P. C. Nelson, “Prefix Gene Expression Programming”. Proc. Genetic and Evolutionary Computation Conference, Washington, D.C., USA, 2005. [12] C. Zhou, P. C. Nelson, W. Xiao, T. M. Tirpak, “Discovery of Classification Rules by Using Gene Expression Programming”. Proc. International Conference on Artificial Intelligence, Las Vegas, 2002, pp. 1355–1361 [13] C. Zhou, W. Xiao, P. C. Nelson, T. M. Tirpak, “Evolving Accurate and Compact Classification Rules with Gene Expression Programming”, IEEE Transactions on Evolutionary Computation, vol. 7(6), 2003, pp. 519–531 [14] J. Zuo, C. Tang, C. Li, C. Yuan and An-long Chen, “Time Series Prediction Based on Gene Expression Programming”. Advances in Web-Age Information Management, Springer, LNCS, vol. 3129, 2004, pp. 55–64 [15] http://securityfocus.com.