Int. J. Internet Protocol Technology, Vol. 8, Nos. 2/3, 2014
77
Intrusion detection method based on nonlinear correlation measure Mohammed A. Ambusaidi, Zhiyuan Tan, Xiangjian He*, Priyadarsi Nanda, Liang Fu Lu and Aruna Jamdagni Center for Innovation in IT Services and Applications (iNEXT), School of Computing and Communication, Faculty of Engineering and Information Technology, University of Technology, Sydney, Australia Email:
[email protected] Email:
[email protected] Email:
[email protected] Email:
[email protected] Email:
[email protected] Email:
[email protected] *Corresponding author Abstract: Cyber crimes and malicious network activities have posed serious threats to the entire internet and its users. This issue is becoming more critical, as network-based services, are more widespread and closely related to our daily life. Thus, it has raised a serious concern in individual internet users, industry and research community. A significant amount of work has been conducted to develop intelligent anomaly-based intrusion detection systems (IDSs) to address this issue. However, one technical challenge, namely reducing false alarm, has been along with the development of anomaly-based IDSs since 1990s. In this paper, we provide a solution to this challenge. A nonlinear correlation coefficient-based (NCC) similarity measure is proposed to help extract both linear and nonlinear correlations between network traffic records. This extracted correlative information is used in our proposed IDS to detect malicious network behaviours. The effectiveness of the proposed NCC-based measure and the proposed IDS are evaluated using NSL-KDD dataset. The evaluation results demonstrate that the proposed NCC-based measure not only helps reduce false alarm rate, but also helps discriminate normal and abnormal behaviours efficiently. Keywords: intrusion detection; nonlinear correlation coefficient; NCC; mutual information; MI; DoS attacks. Reference to this paper should be made as follows: Ambusaidi, M.A., Tan, Z., He, X., Nanda, P., Lu, L.F. and Jamdagni, A. (2014) ‘Intrusion detection method based on nonlinear correlation measure’, Int. J. Internet Protocol Technology, Vol. 8, Nos. 2/3, pp.77–86. Biographical notes: Mohammed A. Ambusaidi is a PhD student at the Faculty of Engineering and Information Technology (FEIT) of the University of Technology, Sydney (UTS), also a research member of Research Centre for Innovation in IT Services and Applications (iNEXT). His primary research interests include computer and network security and on pattern recognition techniques for efficient network intrusion detection and anomalous behaviour detection. Zhiyuan Tan is a Research Associate in the School of Computing and Communications and a research member of the Research Centre for Innovation in IT Services and Applications (iNEXT), University of Technology, Sydney (UTS), Australia. He received his PhD from UTS in 2014. His research interests are network security, pattern recognition, machine learning and distributed systems. Xiangjian He received his BSc in Mathematics from Xiamen University in 1982, MSc in Applied Mathematics from Fuzhou University in 1986, MSc in Information Technology from the Flinders University of South Australia in 1995, and PhD in Computing Sciences from the University of Technology, Sydney, Australia in 1999. From 1982 to 1985, he was with Fuzhou University. From 1991 to 1996, he was with the University of New England. Since 1999, he has been with the University of Technology, Sydney, Australia. He is the Director of Computer Vision and Recognition Laboratory and a Deputy Director of the Research Centre for Innovation in IT Services and Applications at the University of Technology, Sydney.
Copyright © 2014 Inderscience Enterprises Ltd.
78
M.A. Ambusaidi et al. Priyadarsi Nanda joined UTS in 2001. He is a Senior Lecturer in the School of Computing and Communications, and Core Research Member at Centre for Innovation in IT Services Applications (iNEXT). His research interests are network QoS, network securities, assisted healthcare using sensor networks, and wireless networks. Liang Fu Lu received his Bachelor of Science in Mathematics and Applied Mathematics from Department of Mathematics Yantai Normal University, Yantai, China, Master of Science in Computational Mathematics from Department of Mathematics, School of Science Nanjing University of Aeronautics and Astronautics, Nanjing, China and PhD in Visual Analytics from Visual Data Mining Faculty of Engineering and IT University of Technology, Sydney, Australia. Aruna Jamdagni received her PhD from University of Technology Sydney, Australia in 2012. She is a Lecturer in the School of Computing and Mathematics, University of Western Sydney (UWS), Australia, and a research member of Research Centre for Innovation in IT Services and Applications (iNEXT) at University of Technology Sydney (UTS), Australia. Her research interests include computer and network security and on pattern recognition techniques and fuzzy set theory. This paper is a revised and expanded version of a paper entitled ‘A nonlinear correlation measure for intrusion detection’ presented at The International Conference on Frontier of Computer Science and Technology, 7th, Suzhou, China, 21 November 2012.
1
Introduction
Network technologies have made significant progress in development, while the security issues alongside with these technologies have not been well addressed. Current research on network security mainly focuses on developing preventative measures, such as security policies and secure communication protocols. Meanwhile, attempts have been made to protect computer systems and networks against malicious behaviours by using intrusion detection systems (IDSs). Clearly, the collaboration of IDSs and preventative measures can provide a safe and secure communication environment. Intrusion detection has been a hot topic since 1990s. Intrusion detection techniques can be generally classified into two main categories: signature-based and anomaly-based detection. Signature-based or misuse-based detection systems detect on-going anomalies by looking for a match with any pre-defined attack signature (Vigna and Kemmerer, 1998). Signature-based detection systems can identify types of malicious attacks based on the pre-defined signatures and even activate responses to some particular intrusions. These systems are widely used because they are simple and efficient. More importantly, they have a small number of false positive alarms. Bro is a well-known example, and it is a stand-alone system for monitoring real-time traffic and detecting incoming intrusions (Paxson, 1999). However, one of the disadvantages of these systems is that the detection accuracy and efficiency heavily depend on the quality of attack signatures. Furthermore, to extract such high quality signatures, it requires the involvement of experts in extensive study of malicious behaviours, which is costly and time consuming. Moreover, the signature of an intrusion is required before the system can detect the respective. Consequently, this type of IDS cannot detect any previously unknown attacks due to the lack of attack signatures.
The second category is anomaly-based detection systems, which has been in favour of research community. Anomaly-based detection makes an assumption that intruders’ behaviours are different from those of normal network traffic (Hassanzadeh and Sadeghian, 2008). Therefore, intrusions can be defined as network traffic patterns that do not confirm the expected pattern of normal traffic behaviour (Barford et al., 2002). In comparison with signature-based detection systems, anomaly-based detection systems enjoy the advantage of detecting unknown attacks and variants of known attacks. That is because they make use of statistical analysis to evaluate the deviations of the behaviours of observed traffic flows from those of the normal traffic. They study normal traffic behaviours on a network and then create models for normal flows. After that any deviations from the normal flows are considered as suspicious behaviours. Recent research works have widely used machine learning techniques to build anomaly-based IDSs. Machine learning techniques are capable of improving the performance of detection algorithms, namely higher detection rates (DRs) and lower false positive rates (FPRs). Numerous machine learning techniques, including Bayesian network (Kruegel et al., 2003), support vector machine (SVM) (Ying et al., 2012), mutual information (MI) (Amiri et al., 2011) and Markov models (Ye et al., 2004), have been used in anomaly-based detection systems. The main advantages of these approaches are the ability of recognising known and unknown attacks, and no need of continuous update of the attack knowledge base. However, the major weaknesses of these techniques include that they are prone to high FPRs with newly occurring normal network traffic, and low DRs with attacks that mimic normal network traffic behaviours. These limitations encourage us to focus on developing anomaly-based detection systems that can overcome such weaknesses.
Intrusion detection method based on nonlinear correlation measure In this paper, we intend to provide a solution to the problem of false positive alarm. Although various techniques have been proposed to address this issue in the recent decade (Yu, 2012), there is still no perfect solution. The main contribution of this paper is to propose a scheme, named nonlinear correlation coefficient-based (NCC) MI extraction. It can accurately extract the correlation between network traffic records. Moreover, our proposed method is sensitive to both linear correlation and nonlinear correlation. Theoretically, NCC-based measure is more rational than Pearson’s correlation coefficient-based (PCC) measures. NCC-based measure can help improve the performance of intrusion detection (Shen et al., 2011). In addition, to demonstrate the effectiveness of our proposed NCC-based measure in extracting the correlation between network traffic records, we compare our results with the results using the PCC-based scheme. The rest of the paper is organised as follows. Section 2 conducts a review on the works which are closely related to our research. The linear-based correlation (i.e., PCC) measure and the nonlinear-based correlation (i.e., NCC) measure are introduced in Section 3. Section 4 proposes an intrusion detection algorithm based on correlation coefficient measures. Experimental results, analysis and performance comparison are given in Section 5. Finally, the conclusion and future work are presented in Section 6.
2
Related works
Despite many intrusion detection methods are used to detect different types of attacks within networks, reducing FPR is still a major issue. Over time, large number of intrusion detection techniques have been proposed to overcome this problem and maintain the reliability of networks (Liao et al., 2013). Recent literatures on intrusion detection techniques have shown that correlation analysis is one of the effective ways to improve the detection ability and reduce FPR. Next-generation intrusion detection expert system (NIDES) was one of the earliest statistical intrusion detection algorithms that could operate in real-time for continuous monitoring of user activities (Anderson et al., 1995). It uses statistical measures to build the normal profile and then use this profile to detect anomalies. Beauquier and Hu (2007) proposed a model named Pearson’s correlation coefficients-rank (PCC-R), which applied PCC to evaluate distances between different known methods including uniqueness, naive Bayes, Bayes one-step Markov and probabilistic finite state automata (PFSA). They built their intrusion detection model based on the combination of those methods. While this model showed improvement in the DR, the false alarm rates were still high. Jin et al. (2007) utilised covariance matrix of sequential samples to detect multiple network attacks. In order to investigate the performance of their model, they applied two different statistical pattern recognition approaches, namely threshold-based detection approach and traditional decision tree approach, to detect anomalies. Experimental results show that both approaches can distinguish multiple known attacks in the covariance
79
feature space effectively. However, one of the disadvantages of this model is that such a scheme is susceptible to any attacks which linearly change the monitored features. Lately, Anuar et al. (2008) proposed a hybrid statistical approach using combination of data mining and decision tree classification in identifying the false alarms. Hu et al. (2008) proposed a detection method based on AdaBoost algorithm, where decision stumps are used as weak classifiers and decision rules are provided for categorical and continuous features. By combining the weak classifiers for continuous and categorical features into a strong classifier, the relations between these two different types of features are handled naturally. Their experimental results have shown that this method has low false rates. Some new ideas were proposed lately to deal with the problem of linear changes to the monitored features and to reduce FPR. Tsai and Lin (2010) proposed a method based on triangle area-based nearest neighbours (TANN). TANN combined clustering and classification techniques to detect attacks. Compared with the previously proposed methods, TANN shows significant enhancement in DR and FPRs. Jamdagni et al. (2010) has proposed a geometrical structure anomaly detection (GSAD) model. GSAD is a pattern recognition method using Mahalanobis distance map (MDM) to extract correlations between packet payload features. To reduce the processing overhead of GSAD model, Tan et al. (2010) proposed a two-tier system based on linear discriminant method. More recently, Tan et al. (2012) proposed an effective multivariate correlation analysis (MCA) technique that investigates geometrical correlations (triangle areas) between features in a single network traffic record. However, these approaches either ignore the correlations between traffic records or do not take nonlinear correlation into account. Considering that in real world communication the correlations can also be nonlinear, we propose IDS that can measure both linear and nonlinear correlations of multiple records which are presented in Section 4.
3
Linear and nonlinear correlation analysis
In this section, two correlation analysis methods are introduced. They are PCC and NCC. Correlation coefficient is a type of statistical measure that indicates the magnitude of relationship between the two variables. It also shows how the two variables interact with each other.
3.1 Pearson’s correlation coefficient PCC (Rodgers and Nicewander, 1988) is one of the basic linear correlation methods used to measure dependence between two variables. Given two random variables X and Y, shown in (1) and (2) respectively, X = { x1 , x2 ,… , xn } ,
(1)
Y = { y1 , y2 ,… , yn } ,
(2)
80
M.A. Ambusaidi et al.
where n is the total number of samples in X and Y. The PCC of the variables X and Y is defined in (3). PCC ( X , Y ) =
cov( X , Y )
σ X σY n
∑ ( x − X )( y − Y ) i
(3)
i
i =1
=
n
,
n
∑ (x − X ) ∑ ( y − Y ) 2
i
i =1
i
2
H r ( X ,Y ) = −
i =1
∑
∑
n n x and Y = 1 y indicate the n n i =1 i i =1 i means of X and Y respectively. The value of a PCC is ranged from –1 to 1. It indicates the degree of the linear correlation between two random variables. As it has been claimed in Rodgers and Nicewander (1988) and Shen et al. (2009), when the PCC value is close to 1 or –1, it denotes a strong relationship. If the value is close to 0, it means a weak relationship between the two variables. A positive correlation coefficient denotes that the two variables are in the same direction, and a negative one indicates that the two variables are in the opposite direction.
where X = 1
Y is in state yi respectively. In (7), P(xi, yj) denotes the joint probability that X is in state xi and Y is in state yi. The disadvantage of MI is that it does not range in a definite closed interval [–1, 1] as the correlation coefficient does (Wang et al., 2005). Therefore, Wang et al. (2005) developed a revised version of the MI, named NCC. The revised joint entropy of the two variables X and Y is given by (8). b
b
(4)
where H(X) and H(Y) are the information entropies of the variables X and Y, which are defined in (5) and (6) respectively, n
H(X ) = −
∑ P ( x ) ln P ( x ) , i
(5)
i
i =1
n
H (Y ) = −
∑ P ( y ) ln P ( y ) , j
(6)
j
j =1
and H(X, Y) is the joint entropy of X and Y shown in (7), n
H ( X ,Y ) = −
n
∑∑ P ( x , y ) ln P ( x , y ). i
j
i
j
(7)
i =1 j =1
In (5) and (6), P(xi) and P(yi) denote the probabilities that the random variable X is in state xi and the random variable
N
,
(8)
where b × b rank grids are used to place the sample pairs {(xi, yj)}, for 1 ≤ i ≤ n and 1 ≤ j ≤ n, to the rank sequences of X and Y, nij is the number of samples located in the (i, j)th rank grid, and N is the total number of samples. The NCC is defined in (9). NCC ( X ; Y ) = H r ( X ) + H r (Y ) − H r ( X , Y ),
(9)
where Hr(X) and Hr(Y) are the revised entropies of the variables X and Y, which are given in (10) and (11). H r (X ) = −
3.2 Nonlinear correlation coefficient
I ( X ; Y ) = H ( X ) + H (Y ) − H ( X , Y ),
b
i =1 j =1
b
nij
∑ N log
nij b
i =1
Although PCC can reveal the linear correlation between two dependent random variables, in real world the correlation between two variables can be nonlinear. Thus, we need an approach to analyse the nonlinear correlation between variables. NCC is a method based on MI, which is a quantity measuring the relationship between two discrete random variables. MI provides a generalised correlation analogous to linear correlation coefficient, but it is sensitive to both linear and nonlinear correlations (Roulston, 1999). Given the same random variables X and Y, the MI is denoted by (4).
nij
nij
∑∑ N log
H r (Y ) = −
b
nij
∑ N log j =1
(10)
,
N
nij b
(11)
N
Therefore, the NCC(X; Y) in (9) can be rewritten into (12). b
NCC ( X ; Y ) = 2 +
b
nij
∑∑ N log i =1 j =1
nij b
N
,
(12)
and describes the correlation between two discrete random variables, which is within a definite closed interval [–1, 1] where –1 and 1 indicate the weakest and the strongest relationships respectively. For a multi-record scenario, the correlation matrix S of n observed records can be written as ⎛ s11 ⎜ s S = ⎜ 21 ⎜ ⎜ ⎝ sn1
s12
...
s22
...
sn 2
...
s1n ⎞ ⎟ s2 n ⎟ , ⎟ ⎟ snn ⎠
(13)
The elements of the matrix S are the correlation coefficients between distinct pairs of records. The values of elements can be obtained using (3) and (12) for linear correlation and nonlinear correlation respectively. It is noticed that S is a symmetric matrix and the elements’ value along its diagonal are equal to one this is because sij = sji, where i ≠ j, 1 ≤ i ≤ n and 1 ≤ j ≤ n. The aforementioned PCC, NCC and correlation matrix S are applied in our intrusion detection algorithm proposed in Section 4.
Intrusion detection method based on nonlinear correlation measure
4
Intrusion detection based on correlation coefficient
In this section, we propose an intrusion detection algorithm, which can apply PCC and NCC to extract linear correlations and nonlinear correlations of network traffic records and form correlation matrices using (13). It is to be noticed that our detection algorithm includes two main components: normal profile and a pre-defined threshold σ. The process of generating the normal profile and choosing the threshold value σ are described in the following subsections.
4.1 Normal profile generation using NCC To determine the similarity between the normal record and new incoming record, we separate the detection method into two different stages. Firstly, normal profile is built for normal records and obtain the mean value of correlation coefficient among the normal ones, which can extract the linear and nonlinear correlation of the traffic records. Secondly, we set threshold value to determine whether the new incoming record is normal or not. Given a set of m normal training traffic samples normal X = {x1normal , x2normal ,..., xmnormal }, we first calculate the NCC using (12), between the n normal records and then, generate the correlation matrix S using (13) for the normal records. After that, the mean Scn of each column c in S is defined as h,q
Scn =
1 NCCcn,,ij , h i , j =1
∑
(14)
n
The mean NCC for the Scn is finally calculated using: n
4.3 Detection algorithm Similar to the normal profile development process, for any new incoming record n + 1, the NCCn,n+1 between the new incoming record and the records in the normal profile is calculated using (12). Then, the mean NCC NCCn,n+1 values is defined as NCC
∑
n , n +1
=
1 r
NCC − NCC
4.2 Threshold selection The selection of the threshold value σ is a delicate task when designing IDS. It directly influences the false positive and DRs. In other words, larger value of the threshold generates less false positive alarms and small value of the threshold leads to higher DRs and vice versa. In this paper, the value of the threshold σ is ranged from 0 to 1. In fact, the key point of the method between the PCC measure and NCC measure, as explained in Section 3.1, is the correlation between the two variables. To the best of our knowledge, there is no exact mathematical solution to
l
n , n +1
of the
(16)
,
l =1
n , n +1
(17)
,
Finally, the incoming record is considered as an attack or n
abnormal if the difference between NCC and NCC greater than a pre-defined threshold σ or not. n
(15)
Scn .
r
∑ NCC
n , n +1
where r is the number of NCC values between the new incoming record and the normal profile records. After that, the difference between the mean of the normal profile given in (15) and the mean in (16) is defined as
g
1 Scn,,hk g k =1, h =1
where g indicates the number of means in the correlation matrix
determine the threshold value as the degree of strong or weak correlations. Therefore, without loss of generality, we can utilise the mean of the two extreme values 1 and 0, i.e., 0.5, to differentiate the strong and weak correlation of the two variables. This value is rational because it is similar to the Hurst parameter which is a value to reveal the network self-similarity (Rose, 1996). During the training phase we have tested various values for the threshold range from 0 to 1. The experimental result shows that the large threshold value leads to less false positive alarm but less DR as well. Therefore, empirically we found the threshold values between 0.1 and 0.5 give higher DRs and low FPR. More explanation about the threshold selection is given in Section 5.2.
n
where h indicates the NCC values in each column in the correlation matrix S and q indicates the row number in matrix S.
NCC =
81
NCC − NCC
n , n +1
>σ,
n , n +1
is
(18)
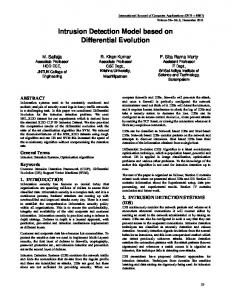
The flow chart given in Figure 1 illustrates the aforementioned processes of the detection algorithm. This detection algorithm has been applied to PCC as well. The comparison results between NCC detection algorithm and PCC detection algorithm are explained in the next section.
5
Experimental results and analysis
In this section, we describe the results obtained by applying the proposed algorithm in Section 4.3 and the selected threshold as described in Section 4.2 and Table 4, to detect the normal records and six different types of DOS attacks. We set detection, false positive and accuracy rates to evaluate the performance of our proposed algorithm.
82 Figure 1
M.A. Ambusaidi et al. The flow chart of the proposed algorithm
NCC n
σ n +1
N C C n + 1, n
N C C n + 1, n
NCC n − NCC n +1, n ≤ σ
5.1 Dataset selection In this experimentation, NSL-KDD dataset (http://iscx.ca/NSL-KDD), as an enhanced version of KDD Cup 99 dataset, is utilised to demonstrate our approach. Even though KDD Cup 99 dataset is a well-known dataset and widely used for network-based intrusion detection techniques, it contains some problems such as including huge number of redundant records, which affect the effectiveness of evaluated systems greatly and consequently lead to poor detection results. To overcome these issues, Tavallaee et al. (2009) presented a new revised version of KDD Cup 99 termed as NSL-KDD. The training and testing datasets of NSL-KDD dataset consist of about 125,973 and 22,544 connection records, respectively. Each record is labelled as either normal or attack, and has 41 features. There are 22 types of attacks available in the dataset. They
can be categorised into four classes, namely probe, denial of service (DOS), user to root (U2R) and remote to user (R2U). The attacks distribution is listed in Table 1.
5.2 Experimental results In our experiments, detection and FPRs are used as standard metrics to evaluate the performance and effectiveness of our algorithm. During the training and testing phases, six types of attacks including smurf, Neptune, land, teardrop, back and pod attacks are randomly selected for training and testing. The distribution of records of various types in training and testing phases are listed in Tables 2 and 3 respectively.
Intrusion detection method based on nonlinear correlation measure Table 1
Attack distribution in NSL-KDD dataset
Attack type
Figure 2
Attack name
Probing
nmap
⎛ ⎜ ⎜ ⎜ ⎜ ⎜ ⎜ ⎜ PCC ⎜ S =⎜ ⎜ ⎜ ⎜ ⎜ ⎜ ⎜ ⎜ ⎜ ⎝
ipsweep portsweep satan DoS
back land neptune pod smurf rootkit
⎛ ⎜ ⎜ ⎜ ⎜ ⎜ ⎜ ⎜ ⎜ SNCC =⎜ ⎜ ⎜ ⎜ ⎜ ⎜ ⎜ ⎜ ⎜ ⎝
perl loadmodule buffer-overflow R2L
ftp-write spy phf guess-passwd imap wrezmaster
However, to differentiate normal and abnormal records exactly, it is necessary to define the pre-defined sensitive threshold σ firstly. To our best knowledge, there is no good way to solve this value theoretically. Hence, we adopt the conventional method to determine this value by setting different values for the threshold. The value varies from 0.1 to 0.5 with the step length 0.1, and these are discussed in Table 4 and Figure 3. Here, we mainly focus on detection and FPRs during the training stage, and it is noticed that good detection results depend on σ greatly when it is neither too small nor too large, such as σ = 0.2 or 0.3. From the comparison between the various threshold values and results illustrated in Table 4 and Figure 3, when σ = 0.3, the DR for normal records decreases slightly from 100% to when σ = 0.5 with a DR of 99.85%. However, the average FPR between different types of attacks has a significant decrease from approximately 3.08 to 0.28 with the decrease of σ from 0.5 to 0.3. In addition, even though there is a slight difference in the DR when σ = 0.3 and σ = 0.1, the FPR between normal records when σ = 0.1 is obviously higher than when σ = 0.3. To sum up, it is the best way that we choose σ = 0.3 as a fixed threshold value for our detection algorithm. Here, we describe the detection method in detail. During the test process, the mean correlation coefficient NCC m +1,i among each new record and the corresponding normal profile which is built based on the normal traffic records is calculated. If the distance between mean coefficient of normal profile and NCC m +1,i exceeds the pre-defined threshold 0.3 it would be taken into account as abnormal
Sample distribution on the training dataset Attack Neptune Land Smurf Teardrop Back Pod 590
19
1980 Table 3 Normal
251
169
365
Total
162
1,556
3,536
Sample distribution on the testing dataset Attack Neptune Land Smurf Teardrop Back Pod 1,840
14,590
19
1,566
1.0000 0.9696 0.8087 0.8087 0.8441 0.7341 0.6166 0.6493 0.5764 0.5426 0.7341 0.7341⎞ ⎟ 0.9696 1.0000 0.9696 0.9696 0.9339 0.8424 0.7744 0.7249 0.6633 0.6166 0.8424 0.6633⎟ 0.8087 0.9696 1.0000 0.8087 0.8441 0.7341 0.8326 0.6493 0.5764 0.5426 0.7341 0.5764⎟ ⎟ 0.8087 0.9696 0.8087 1.0000 0.8441 0.7341 0.6166 0.6493 0.5764 0.5426 0.7341 0.5764⎟ 0.8441 0.9339 0.8441 0.8441 1.0000 0.7249 0.7041 0.7530 0.7249 0.8148 0.9339 0.9339⎟ ⎟ 0.7341 0.8424 0.7341 0.7341 0.7249 1.0000 0.7744 0.9339 0.6633 0.6166 0.6633 0.6633⎟ ⎟ 0.6166 0.7744 0.8326 0.6166 0.7041 0.7744 1.0000 0.7041 0.7744 0.5463 0.7744 0.5747⎟ 0.6493 0.7249 0.6493 0.6493 0.7530 0.9339 0.7041 1.0000 0.9339 0.8148 0.7249 0.7249⎟ ⎟ 0.5764 0.6633 0.5764 0.5764 0.7249 0.6633 0.7744 0.9339 1.0000 0.7716 0.8424 0.6633⎟ 0.5426 0.6166 0.5426 0.5426 0.8148 0.6166 0.5463 0.8148 0.7716 1.0000 0.6166 0.7716⎟ ⎟ 0.7341 0.8424 0.7341 0.7341 0.9339 0.6633 0.7744 0.7249 0.8424 0.6166 1.0000 0.6633⎟ 0.7341 0.6633 0.5764 0.5764 0.9339 0.6633 0.5747 0.7249 0.6633 0.7716 0.6633 1.0000⎟⎠
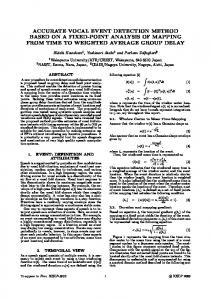
(b)
Source: Olusola et al. (2010)
Normal
1.0000 0.8972 0.8892 0.9548 0.9841 0.4312 0.3832 0.4599 0.8789 0.7032 0.6321 0.6721⎞ ⎟ 0.8972 1.0000 0.9997 0.7694 0.8131 0.0320 0.0536 0.0434 0.6265 0.4233 0.3632 0.3771⎟ 0.8892 0.9997 1.0000 0.7623 0.8023 0.0215 0.0337 0.0278 0.6147 0.4130 0.3445 0.3560⎟ ⎟ 0.9548 0.7694 0.7623 1.0000 0.9636 0.6152 0.4005 0.6289 0.9340 0.8142 0.6016 0.6388⎟ 0.9841 0.8131 0.8023 0.9636 1.0000 0.5677 0.4622 0.5998 0.9388 0.7915 0.6777 0.7401⎟ ⎟ 0.4312 0.0320 0.0215 0.6152 0.5677 1.0000 0.4942 0.9517 0.7553 0.8314 0.4528 0.5442⎟ ⎟ 0.3832 0.0536 0.0337 0.4005 0.4622 0.4942 1.0000 0.5443 0.3967 0.2477 0.9494 0.9208⎟ 0.4599 0.0434 0.0278 0.6289 0.5998 0.9517 0.5443 1.0000 0.8017 0.8756 0.5039 0.6145⎟ ⎟ 0.8789 0.6265 0.6147 0.9340 0.9388 0.7553 0.3967 0.8017 1.0000 0.9515 0.5528 0.6586⎟ 0.7032 0.4233 0.4130 0.8142 0.7915 0.8314 0.2477 0.8756 0.9515 1.0000 0.3461 0.4842⎟ ⎟ 0.6321 0.3632 0.3445 0.6016 0.6777 0.4528 0.9494 0.5039 0.5528 0.3461 1.0000 0.9763⎟ 0.6721 0.3771 0.3560 0.6388 0.7401 0.5442 0.9208 0.6145 0.6586 0.4842 0.9763 1.0000⎟⎠
warezclient multihop
Table 2
Matrices expressions of two different measures for normal profiles, (a) PCC-based correlation matrix (b) NCC-based correlation matrix
(a)
teardrop U2R
83
1,313
7,487
Total
988 1,761 22,077
During the training phase, we have applied both NCC measure and PCC measure. By following the proposed detection algorithm shown in Figure 1, we calculate the correlation coefficients (sij) between the selected records to generate the normal profile using both PCC measure and NCC measure respectively. Figure 2 illustrates the two different correlation matrices SPCC and SNCC of normal profiles for the same samples. Each element sij in the matrices describes the linear correlation coefficient or the NCC between the ith and jth records.
84
M.A. Ambusaidi et al.
record. Otherwise it would be considered as legitimate traffic.
comparison between NCC-based IDS and PCC-based IDS is given in Section 5.3.
Table 4
5.3 Performance comparison and analysis
DR for various threshold values on the training dataset Threshold σ
Type of records
0.1
Normal
0.2
0.3
0.4
0.5
95.81%
97.57%
99.85%
99.94%
100%
Teardrop
100%
99.41%
99.41%
98.22%
94.08%
Smurf
100%
99.60%
99.60%
98.41%
97.61%
Pod
100%
100%
100%
100%
98.76%
Neptune
99.83%
99.66%
99.66%
99.32%
98.81%
Back
99.45%
99.45%
99.18%
98.35%
97.26%
Land
100%
100%
100%
95%
95%
Figure 3
FPR for various threshold values on the training dataset (see online version for colours)
Considering the selected threshold value 0.3, the confusion matrix presented in Table 5 shows that our intrusion detection algorithm using NCC measure achieves high accuracy in detecting both normal records (99.84%) and attack records (99.55%). Table 5
Normal
Attack
Correct (%)
Normal
1,977
3
99.84
Attack
7
1,549
99.55
Table 6
Confusion matrix
Actual
DR =
TP × 100%, TP + FN
FPR =
Prediction Normal
Attack
Normal
TP
FN
Attack
FP
TN
The performance of intrusion detection technique is defined by its ability to make correct predictions. Comparing an event with the predications from the IDS, there are four possible outcomes shown in Table 6. These outcomes are known as the confusion matrix. The performance
(19)
FP × 100%, FP + TN
(20)
where •
true positives (TP): the number of actual attacks classified as attack
•
true negatives (TN): the number of actual normal classified as normal
•
false positives (FP): the number of actual normal classified as attack
•
false negatives (FN): the number of actual attack classified as normal.
Considering the selected threshold value σ = 0.3, the results presented in Table 7 show that during the testing phase our detection algorithm achieves higher DR and lower FPR than PCC measure. As shown in Table 7 the DR of NCC-based IDS (98.754%) outperforms the DR of PCC-based and other proposed methods. More importantly, for the FPR of NCC-based IDS (1.246%) also performs better than other proposed methods. Table 7
Confusion matrix for NCC-training set
Predicted actual
The effectiveness of a detection system is defined by DR and FPR. While the DR represents the capability of IDS in detecting attacks, the FPR refers to the probability of IDS triggering an alarm when there is no attack occurring. The DR and FPR can be obtained by
Comparison of detection and false alarm between different IDS using NSL-KDD dataset False positive rates (%)
Detection rates (%)
NCC-MI (proposed method)
1.246
98.754
PCC
2.367
97.632
Naïve Bayes Tree (Bhat et al., 2013)
2.0
**
SVM (de la Hoz et al., 2013)
14
93.4
DM – Naïve Bayes (Panda et al., 2010)
3.0
96.5
Methods
Note: **Indicates data not provided by the author in their paper.
Intrusion detection method based on nonlinear correlation measure Additionally, given the columns in PCC and NCC matrices and S NCC respectively. We use the covariance of are S PCC j j these two columns to illustrate the significant difference as shown in (22).
(
Cov S PCC , S jNCC j
(
)
PCC = E ⎡ S PCC ⎣ j − ES j
)( S
NCC j
)
⎤ − ES NCC j ⎦
(21)
It should be noticed that the correlation coefficient matrices are symmetric. Therefore, the dimension of columns that we need to calculate the covariance decreases gradually.
6
Conclusions and future work
This paper has introduced a NCC measure for discrete variables which is designed based on MI. We have proposed an intrusion detection algorithm based on the assumption that intrusion behaves differently between normal network traffic. To equip our intrusion detection algorithm with high accuracy in recognising deviation of an attack from the normal traffic flow, we have adopted the NCC into detection algorithm to extract the correlation between network traffic records. This makes our algorithm not only feasible in linear correlation extraction but also nonlinear correlation extraction. We have also verified our findings by experimentation and comparison with PCC measure. The experimental results have shown that NCC-based intrusion detection algorithm achieves not only lower FPR but also higher DR than those of PCC-based intrusion detection algorithm. However, the proposed intrusion detection scheme still needs to be further studied in some aspects. For instance, we will consider when an attack occurs and what type of an attack is. These are the research objectives in our future works. In addition, we are going to apply our approach on a large sized enterprise network.
References Amiri, F., Rezaei Yousefi, M., Lucas, C., Shakery, A. and Yazdani, N. (2011) ‘Mutual information-based feature selection for intrusion detection systems’, Journal of Network and Computer Applications, Vol. 34, No. 4, pp.1184–1199. Anderson, D., Frivold, T. and Valdes, A. (1995) Next-generation Intrusion Detection Expert System (NIDES): A Summary, SRI International, Computer Science Laboratory, Menio Park, CA. Anuar, N.B., Sallehudin, H., Ghani, A. and Zakaria, O. (2008) ‘Identifying false alarm for network intrusion detection system using hybrid data mining and decision tree’, Malaysian Journal of Computer Science, Vol. 21, No. 2, pp.110–115. Barford, P., Kline, J., Plonka, D. and Ron, A. (2002) ‘A signal analysis of network traffic anomalies’, Internet Measurement Conference: Proceedings of the 2nd ACM SIGCOMM Workshop on Internet Measurement, pp.71–82.
85
Beauquier, J. and Hu, Y. (2007) ‘Intrusion detection based on distance combination’, CESSE07, Venice, Italy, World Academy of Sciences, WAS. Bhat, A.H., Patra, S. and Jena, D. (2013) ‘Machine learning approach for intrusion detection on cloud virtual machines’, International Journal of Application or Innovation in Engineering & Management (IJAIEM), Vol. 2, No. 6, pp.56–66. De La Hoz, E., Ortiz, A., Ortega, J. and De La Hoz, E. (2013) Network Anomaly Classification by Support Vector Classifiers Ensemble and Non-linear Projection Techniques, Hybrid Artificial Intelligent Systems, Springer Berlin Heidelberg, LNAI, Vol. 8073, pp.103–111. Hassanzadeh, A. and Sadeghian, B. (2008) ‘Intrusion detection with data correlation relation graph’, Availability, Reliability and Security, ARES 08. Third International Conference on, IEEE, pp.982–989. Hu, W., Hu, W. and Maybank, S. (2008) ‘Adaboost-based algorithm for network intrusion detection’, Systems, Man, and Cybernetics, Part B: Cybernetics, IEEE Transactions on, Vol. 38, No. 2, pp.577–583. Jamdagni, A., Tan, Z., Nanda, P., He, X. and Liu, R.P. (2010) ‘Intrusion detection using GSAD model for HTTP traffic on web services’, Proceedings of the 6th International Wireless Communications and Mobile Computing Conference, ACM, pp.1193–1197. Jin, S., Yeung, D.S. and Wang, X. (2007) ‘Network intrusion detection in covariance feature space’, Pattern Recognition, Vol. 40, No. 2, pp.2185–2197. Kruegel, C., Mutz, D., Robertson, W. and Valeur, F. (2003) ‘Bayesian event classification for intrusion detection’, Computer Security Applications Conference, Proceedings, 19th Annual, IEEE, pp.14–23. Liao, H-J., Lin, C-H.R., Lin, Y-C. and Tung, K-Y. (2013) ‘Review: intrusion detection system: a comprehensive review’, J. Netw. Comput. Appl., Vol. 36, No. 1, pp.16–24. Olusola, A.A., Oladele, A.S. and Abosede, D.O. (2010) ‘Analysis of KDD’99 intrusion detection dataset for selection of relevance features’, Proceedings of the World Congress on Engineering and Computer Science, pp.20–22. Panda, M., Abraham, A. and Patra, M.R. (2010) ‘Discriminative multinomial naïve Bayes for network intrusion detection’, Information Assurance and Security (IAS), Sixth International Conference on, IEEE, pp.5–10. Paxson, V. (1999) ‘Bro: a system for detecting network intruders in real-time’, Computer Networks, Vol. 31, Nos. 23–24, pp.2435–2463. Rodgers, J.L. and Nicewander, W.A. (1988) ‘Thirteen ways to look at the correlation coefficient’, The American Statistician, Vol. 42, No. 1, pp.59–66. Rose, O. (1996) Estimation of the Hurst Parameter of Long-range Dependent Time Series, University of Wurzburg, Institute of Computer Science Research Report Series, Wurzburg, Germany, February. Roulston, M.S. (1999) ‘Estimating the errors on measured entropy and mutual information’, Physica D: Nonlinear Phenomena, Vol. 125, Nos. 3–4, pp.285–294. Shen, Z., Wang, Q. and Shen, Y. (2009) ‘A new non-liner correlation measure’, Information, Computing and Telecommunication, YC-ICT ‘09, IEEE Youth Conference on, 20–21 September, pp.11–14.
86
M.A. Ambusaidi et al.
Shen, Z., Wang, Q. and Shen, Y. (2011) ‘Effects of statistical distribution on nonlinear correlation coefficient’, Instrumentation and Measurement Technology Conference (I2MTC), IEEE, pp.1–4. Tan, Z., Jamdagni, A., He, X., Nanda, P. and Liu, R.P. (2012) ‘Triangle-area-based multivariate correlation analysis for effective denial-of-service attack detection’, Trust, Security and Privacy in Computing and Communications (TrustCom), IEEE 11th International Conference on, IEEE, pp.33–40. Tan, Z., Jamdagni, A., He, X., Nanda, P., Liu, R., Jia, W. and Yeh, W-C. (2010) ‘A two-tier system for web attack detection using linear discriminant method’, Information and Communications Security, Vol. 6476, pp.459–471. Tavallaee, M., Bagheri, E., Lu, W. and Ghorbani, A-A. (2009) ‘A detailed analysis of the KDD CUP 99 data set’, Proceedings of the Second IEEE Symposium on Computational Intelligence for Security and Defence Applications. Tsai, C-F. and Lin, C-Y. (2010) ‘A triangle area based nearest neighbors approach to intrusion detection’, Pattern Recognition, Vol. 43, No. 1, pp.222–229.
Vigna, G. and Kemmerer, R.A. (1998) ‘NetSTAT: a network-based intrusion detection approach’, Computer Security Applications Conference, Proceedings. 14th Annual, IEEE, pp.25–34. Wang, Q., Shen, Y. and Zhang, J.Q. (2005) ‘A nonlinear correlation measure for multivariable data set’, Physica D: Nonlinear Phenomena, Vol. 200, Nos. 3–4, pp.287–295. Ye, N., Zhang, Y. and Borror, C.M. (2004) ‘Robustness of the Markov-chain model for cyber-attack detection’, Reliability, IEEE Transactions on, Vol. 53, No. 1, pp.116–123. Ying, K-C., Lin, S-W., Lee, C-Y. and Lee, Z-J. (2012) ‘An intelligent algorithm with feature selection and decision rules applied to anomaly intrusion detection’, Applied Soft Computing, Vol. 12, No. 10, pp.3285–3290. Yu, Y. (2012) ‘A survey of anomaly intrusion detection techniques’, J. Comput. Sci. Coll., Vol. 28, No. 1, pp.9–17.