tion of internal gravity waves by perturbations to the mean flow caused by the .... with the return flow of stratified fluid that is established by the release of the lock ...
J. Fluid Mech. (2004) c 2004 Cambridge University Press Copyright
1
Intrusive Gravity Currents and Internal Gravity Wave Generation in Stratified Fluid By M O R R I S R. F L Y N N a n d B R U C E R. S U T H E R L A N D Department of Mathematical and Statistical Sciences, University of Alberta, Edmonton, AB, Canada T6G 2G1 (Received 1 May 2003 and in revised form 4 May 2004)
The excitation of internal gravity waves by fluid intrusions that propagate along the interface between a uniform upper layer and a uniformly stratified lower layer is examined by way of laboratory experiments. Intrusions are generated using a simple lock-release apparatus. Experiments are conducted in which the density gradient of the uniformly stratified layer, the density jump across the interface and the density difference between the lock fluid and the uniform upper layer are varied. In all cases, the fluid intrusions traveled at a constant speed. The forcing imparted by the generated internal gravity waves did not deform the intrusion head or significantly retard the intrusion’s rate of forward advance. For a limited range of density parameters, good agreement was obtained between the experimental data and the two-layer analytical theory of Holyer & Huppert (1980) which provides estimates for the intrusion speed and depths of penetration into the upper and lower layers. Internal gravity wave excitation is due to the initial collapse of the lock fluid and the forcing imparted by the head of the intrusion. Waves are visualised and their amplitudes measured using “synthetic schlieren”. The vertical flux of horizontal momentum due to internal gravity wave excitation is related to measurable properties of the fluid intrusion. This analysis suggests that outflows produced by tall convective storms that travel along the tropopause may excite non-hydrostatic internal gravity waves in the stratosphere whose momentum flux, at least during the transient generation time, is comparable to that of waves generated by topographic forcing.
1. Introduction Gravity currents (also known as density currents or buoyancy currents) and internal gravity waves are ubiquitous phenomena in the atmosphere and ocean. The former arise when fluid of one density propagates horizontally into fluid of another density. Atmospheric manifestations of this phenomenon include thunderstorm outflows and sea breeze fronts (Simpson (1982), Simpson (1997)). Most experimental and theoretical studies of gravity currents have examined the propagation of dense fluid along a rigid boundary beneath a uniform ambient (Keulegan (1957), Benjamin (1968), Simpson (1972), Britter & Simpson (1978), Simpson & Britter (1979), Huppert & Simpson (1980), Klemp, Rotunno & Skamarock (1994), D’Alessio et al. (1996), Hallworth et al. (1996), H¨ artel et al. (1997), Shin, Dalziel & Linden (2003)). A gravity current that propagates along an interface within a stratified fluid we refer to as a fluid intrusion. These have been studied theoretically and experimentally by Holyer & Huppert (1980), Britter & Simpson (1981),
2
M. R. Flynn and B. R. Sutherland
D’Alessio et al. (1997), Rooij (1999), Rooij, Linden & Dalziel (1999), Mehta, Sutherland & Kyba (2002). Internal gravity waves, which propagate within density stratified environments play an important role in atmospheric circulation. For example, it is well known that the breakdown of internal gravity waves imparts a significant drag on the zonal winds (Lindzen (1981), Kida (1984), Gavrilov & Roble (1994) and Becker & Schmitz (2002)). Although the largest proportion of momentum transport by internal gravity waves is associated with those generated by topographic forcing (Fritts & Nastrom (1992)), other dynamic excitation mechanisms can also result in significant momentum fluxes. In particular, convective forcing may represent the most important source of atmospheric internal gravity waves in the Southern Hemisphere and the tropics (Alexander, Holton & Durran (1995)). Beres, Alexander & Holton (2002) have identified three means by which convective motion may excite waves (see also Mason & Sykes (1982), Clark, Hauf & Kuettner (1986) and Fovell, Durran & Holton (1992)). “Quasi-stationary forcing” describes the generation of internal gravity waves by perturbations to the mean flow caused by the pressure field of a rising convective element. Because the element thereby acts as a “fluidic” (i.e. non-rigid) obstacle, this mechanism is also known as the “obstacle effect.” In the absence of a background mean flow, waves may be generated through the oscillatory deflection to the boundary of a stratified layer due to the successive rising and falling of convective eddies. This scenario is similar to the experiments of Plumb & McEwan (1978) in which boundary deflections were established using mechanical means. The mechanism is therefore referred to as the “mechanical oscillator effect.” The third means for wave excitation is the “deep heating effect” which describes the generation of internal gravity waves due to the thermal forcing associated with the latent heat release within a convective storm. Internal gravity wave generation is thus due to fluid expansion; the wave’s vertical wavelength is approximately twice that of the vertical extent through which heating occurs (Salby & Garcia (1987)). Whereas Clark, Hauf & Kuettner (1986) determined that a strong wind shear was required for the generation of strong internal gravity waves, Fovell, Durran & Holton (1992) found that this was not the case when considering the deep convection associated with mesoscale convective storms, even though their analysis did not explicitly consider the “deep heating effect.” In addition to topographic and convective forcing, atmospheric internal gravity waves may also be generated by the vortices produced in an unstable parallel shear flow, a mechanism referred to as “shear generation” (Lindzen (1974), Sutherland, Caulfield & Peltier (1994), Sutherland (1996) and Sutherland & Linden (1998)). Qualitatively, internal gravity waves are anticipated when the stratification of the strongly-sheared region is low compared to that of the surrounding strongly stratified ambient as characterised by Richardson numbers less than and greater than 1/4, respectively. Here, we initiate an idealised experimental study examining a novel variation of the convective and shear mechanisms for wave generation in which stratospheric internal gravity waves are excited by the propagation of a fluid intrusion along the tropopause, the boundary separating the weakly stratified troposphere (below) from the strongly stratified stratosphere (above). As demonstrated in Figure 1, examples of such flows include laterally spreading anvil clouds, propagating high-level rope clouds that form by detaching from the leading edge of anvil clouds (Simpson (1997)) and, more exotically, laterally spreading volcanic clouds (Rose et al. (2001)). Previous investigations into the generation of internal gravity waves in a uniformly stratified fluid by density driven currents fall under two principal categories: those in which wave excitation is due to a bottom-propagating gravity current (Maxworthy et al. (2002),
Intrusive Gravity Currents and Internal Gravity Wave Generation . . . Int er n W al G Stratosphere av ra es vit y
3
Tropopause Rope Clouds Anvil Cloud ~ 15 km Troposphere
Ground Level 666666666666666666666666666666666 666666666666666666666666666666666 666666666666666666666666666666666 666666666666666666666666666666666 FIG. 1. The ascent of a tall anvil cloud. When the mass of hot, moist air reaches the tropopause it may, under certain conditions, begin to spread laterally giving rise to a fluid intrusion that propagates along the interface between a strongly stratified fluid (above) and a weakly stratified fluid (below).
Ungarish & Huppert (2002)) and those in which the current propagates at some intermediate depth (Schooley (1967), Wu (1969), Schooley & Hughes (1972), Manins (1976), Amen & Maxworthy (1980), Britter & Simpson (1981), Faust & Plate (1984), Rooij (1999)). In the experiments of Maxworthy et al. (2002), the gravity current was released using a standard lock-release apparatus. Direct excitation of internal gravity waves occurred when the current’s velocity was below that of the linear, mode-one long wave in the wave guide, a condition referred to by Maxworthy et al. (2002) as “subcritical” (see also Long (1955)). At this point, “first-mode waves were formed which interacted with the head of the advancing gravity current to destroy the original front and to cause a succession of gravity-current heads” (Simpson (1982)). In other words, a rhythmic coupling was established that alternately accelerated and decelerated the gravity current head. By contrast, no such behaviour has been observed in studies involving a non-stratified ambient for which the gravity current speed is constant over a horizontal distance of approximately ten lock-lengths (Simpson (1997)). Experiments involving the propagation of a homogeneous mixed region within a stratified fluid typically ignore boundary effects. Wu (1969) divided the gravitational collapse of the mixed region into three distinct stages: the “initial” stage, during which the rate of collapse is constant, the “principal” stage during which the collapse rate begins to decrease and the “final” stage in which the mixed region becomes wedge-shaped and propagates so slowly that viscous effects become significant. Internal gravity waves are generated both above and below the collapsing mixed layer. Whereas Wu (1969) did not observe a resonant interaction between the intrusion and the internal gravity waves, such behaviour was noted in the related study of Amen & Maxworthy (1980),
4
M. R. Flynn and B. R. Sutherland
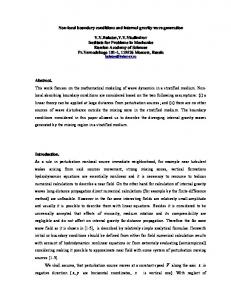
a) Previous studies Lock Release
b) Present study Gravity Current
Direct
Return Flow of Stratified Fluid
Indirect
Internal Gravity Wave Excitation
Lock Release
Gravity Current
Direct
Internal Gravity Wave Excitation
FIG. 2. Comparison between the mechanisms of internal gravity wave excitation in the studies of (a) Wu (1969), Amen & Maxworthy (1980) and Maxworthy et al. (2002) and (b) the present study.
for whom the initial height of the mixed region relative to the depth of the stratified ambient was notably larger. As in the experiments of Maxworthy et al. (2002), this interaction resulted in the irregular advance of the intrusion head. For both classes of experiment described above, internal gravity wave generation is due to two factors: direct excitation by the gravity current and indirect excitation associated with the return flow of stratified fluid that is established by the release of the lock (see Figure 2a). Experiments performed in the present study are different from those described above in two fundamental respects. They consider the behaviour of a fluid intrusion in a two-layer system in which the lower layer is uniformly stratified and the top layer is uniform in density. As in the investigations of Wu (1969), Amen & Maxworthy (1980) and Maxworthy et al. (2002), flow is established using a simple lock-release apparatus. In the present case, however, the lock fluid initially spans only the height of the uniform layer and the collapse of the mixed region therefore occurs strictly within non-stratified surroundings. Consequently, the collapse of the lock fluid does not induce a return flow in the stratified (lower) layer. As indicated in Figure 2b, internal gravity wave generation is due solely to the direct mechanism: forcing by the fluid intrusion. Whereas previous experiments are characterised by the appearance of columnar modes (internal gravity waves of infinite horizontal wavelength that are associated with a bulk flow of stratified fluid within a closed geometry), these features are only apparent in the present study when the forcing exerted by the fluid intrusion on the lower layer is relatively large. The excitation of columnar modes is undesirable because it effectively changes the mean density and velocity profiles in the region (Baines (1995)). Although the atmosphere’s potential temperature and velocity profiles are more complicated than the corresponding background profiles considered in the present study, the experiments bear some resemblance to the interfacial flow phenomenon depicted in Figure 1. In particular, although the experiments capture only Boussinesq dynamics, they nonetheless provide an important starting point for assessing the importance of thunderstorm outflows as sources of internal gravity waves given that the vertical extent over
Intrusive Gravity Currents and Internal Gravity Wave Generation . . .
5
which wave forcing occurs in the atmospheric circumstance is small relative to the local scale height. The paper is organized as follows: §2 provides an overview of the analytic theory of Holyer & Huppert (1980) (hereafter HH80) which describes the propagation of a fluid intrusion between two uniform layers. Simplifications to their original equations are derived by employing the Boussinesq approximation. In addition, the theory of Rooij, Linden & Dalziel (1999), which considers the behaviour of a fluid intrusion in a two-layer system under more restrictive conditions, will be discussed. The experimental set-up is summarized in §3. §4 presents a comparison between the measured intrusion properties and those predicted by HH80. The behaviour of the internal gravity waves is analyzed in §5. Finally, §6 considers the application of the experimental data to the atmospheric flow depicted in Figure 1.
2. Theory The behaviour of an inviscid gravity current propagating into a uniform ambient of depth hT was considered theoretically by Benjamin (1968). Using conservation of mass and momentum, he demonstrated that for energy-conserving flows in which surface tension and mixing can be neglected, the current depth hgc was half the total fluid depth (hgc = hT /2) and the current speed, vgc , was given by 1 p ′ g hgc . vgc = √ 2
(2.1)
Here we represent the reduced gravity by g ′ = g(ρgc − ρ0 )/ρ00 , in which g is the acceleration due to gravity, ρgc is the gravity current density, ρ0 is the density of the ambient fluid and, in the Boussinesq approximation, ρ00 is a characteristic reference density that we take to equal ρ0 . These results were extended by HH80 who derived equations describing the propagation of a fluid intrusion in a two-layer system consisting of uniform layers for which the interfacial thickness is vanishingly small. For non-dissipative intrusive flows, they obtained a coupled system of cubic polynomial equations for r0 and r1 , the relative decrease in depth of the ambient fluid as it moves respectively above and below the intrusion. By invoking the Boussinesq approximation, this system of equations was simplified by Sutherland, Kyba & Flynn (2004) who further derived approximate solutions from perturbation expansions about ǫ, measuring the relative density difference between the intrusion and the average density of the ambient. Explicitly, using the notation represented in Figure 3, they defined ǫ= where ρ¯ =
ρi − ρ¯ , ρ1 − ρ0
h 1 ρ1 + h 0 ρ0 , hT
and hT = h1 + h0 . The analysis presented here starts with the coupled polynomial equations (2.4) and (2.5) of Sutherland, Kyba & Flynn (2004). However, rather than determining perturbation solutions about ǫ = 0, here we expand about a small parameter Γ representing the relative density difference between the intrusion and the upper layer. This is the relevant parameter for the experiments presented here because in the majority of our experiments the intrusion propagates with most of its bulk in the upper (uniform density)
6
M. R. Flynn and B. R. Sutherland
r0 h0 h0
ρ0 ρi
hi0
hi
hi1 ρ1
h1
r1 h1
1111111111111111111111111111111111 1111111111111111111111111111111111 1111111111111111111111111111111111 1111111111111111111111111111111111 FIG. 3.1111111111111111111111111111111111 The propagation of a fluid intrusion of density ρ between uniform layers of densities ρ (above) and ρ (below). i
0
1
layer and with only weak penetration into the lower (stratified) layer. Thus increasing Γ corresponds to increasing forcing of internal waves in the stratified fluid. (In the theory presented below, both layers of the ambient are assumed to have uniform density. But, if Γ is small, the current structure and speed should not depend on whether the lower layer is stratified.) We further require that Γ, unlike ǫ, be independent of the lower-layer depth, which should be insignificant in cases when the intrusion penetrates only weakly into the lower layer. We therefore define ρi − ρ0 Γ= . (2.2) ρ1 − ρ0 For intrusions moving along the interface we must have 0 < Γ < 1. Alternately, we could 10 i have defined ζ = Γ − 1/2, in which ζ = ρiρ−hρ and hρ10 i = (ρ1 + ρ0 )/2 is the average 1 −ρ0 of the densities on either flank of the interface. The parameter ζ was first introduced by Rooij, Linden & Dalziel (1999) in their study of intrusions in fluid with equal upperand lower-layer depths. Here we work with Γ because it is a more suitable perturbation parameter for the cases we are interested in, specifically, 0 ≤ Γ ≪ 1. We transform from the equations of Sutherland, Kyba & Flynn (2004) involving ǫ to equations involving Γ using the relation ǫ=Γ−
h1 . hT
As Γ → 0, we find r0 = 1/2 and r1 = 1. We therefore find perturbation solutions by substituting r0 = 1/2 + δ0 and r1 = 1 − δ1 into the coupled cubic polynomial equations to give and
Γ(1 + 2δ0 )2 (1 − 2δ0 ) = 8H1 δ1 (1 − Γ)(1 − δ1 )2
(2.3)
δ0 Γ(1 − 2δ0 )2 = 2δ12 (H1 )2 (1 − Γ)(2δ1 − 1),
(2.4)
in which H1 = h1 /h0 .
Intrusive Gravity Currents and Internal Gravity Wave Generation . . .
7
These equations are perturbed about small Γ by assuming δ0 = Γδ0 (1) + O(Γ2 ) and δ1 = Γδ1 (1) +O(Γ2 ). Substituting these into eqs. (2.3) and (2.4) and matching like powers of Γ, we thereby determine the heights, hi0 and hi1 , of the intrusion above and below the interface, respectively. Relative to the upper layer ambient depth, h0 , we find Hi0 ≡
1 1 hi0 = + Γ + O(Γ2 ) h0 2 32
(2.5)
and hi1 1 = Γ + O(Γ2 ). (2.6) h0 8 Thus, for Γ sufficiently small, the total relative intrusion depth is Hi ≡ Hi0 + Hi1 ≃ 1/2 + 5Γ/32. Figure 4 presents comparisons between the exact results of HH80 and the first order perturbation expansions given by eqs. (2.5) and (2.6), the latter being represented by long-dashed lines. Note that the exact solution of HH80 has three solutions for a range of Γ. These are discussed in detail by Sutherland, Kyba & Flynn (2004) but are irrelevant to the discussion here because they occur for sufficiently large Γ that they occur outside the range of interest as represented by our perturbation parameter. In the asymmetric case with H1 = 2 (typical of our experiments) and for Γ ≤ 0.2, the leading order perturbation theory gives 0.2% and 21.9% accuracy for Hi0 and Hi1 , respectively. Likewise, in the symmetric case H1 = 1, the perturbed solutions reasonably estimate the exact < behaviour for Γ ∼ 0.2. The intrusion speed is given generally by p (2.7) vi = r0 2Γσgh0 (1 − r0 ) Hi1 ≡
in which σ = (ρ1 − ρ0 )/ρ00 . For small Γ, we find r � � vi Γ 3 2 √ = 1 − Γ + O(Γ ) . 2 16 σghi
(2.8)
Figure 5 compares the leading order perturbation solutions of eq. (2.8) with the exact solutions of HH80 in the case with h0 = h1 and h0 ≪ h1 . In both cases, the approximate theory is accurate to within 0.5% of the exact result for Γ ≤ 0.2. We expect eq. (2.8) should be equivalent to eq. (2.1) in the limit Γ → 0. Indeed, in this limit vi → vgc , hi → hgc and σΓg → g ′ . The correction terms in eq. (2.8) reflect that the relative speed of the intrusion decreases as it penetrates more deeply into the lower layer. Figure 5 explicitly compares the formula derived by Benjamin (1968) (the curve labeled ‘B68’) with our formula for a two-layer fluid. Also shown in Figure 5 is a curve (denoted by ‘RLD99’) due to the analytic theory of Rooij, Linden & Dalziel (1999). Their model represents a simplification of HH80 in that they assume both layers are infinite in extent and hence effectively equal in depth. Their solution, which is applicable to both energy-conserving and dissipative currents, expresses vi as an explicit function of ζ: r p Fr p Fr ρ0 p vi √ (2.9) 1 − 4ζ 2 ≃ 1 − 4ζ 2 ≡ Fr Γ(1 − Γ). = 2 ρ 2 σghi i
Here the Froude number, Fr, is defined by requiring that the predicted solution approach + that given √ by Benjamin (1968) and HH80 in the limit Γ → 0 . Specifically, we set Fr = 1/ 2. As indicated by Figure 5, the solution of Rooij, Linden & Dalziel (1999) is < well approximated by eq. (2.8) for Γ ∼ 0.2.
8
M. R. Flynn and B. R. Sutherland
FIG. 4. (a) Intrusion heights hi0 , hi1 and hi (normalized by h0 ) versus Γ for h1 = 2h0 and (b) hi0 and hi (normalized by h0 ) versus Γ for h1 = h0 . In the intervals over which HH80 predicts non-unique solutions, the physically anticipated solution is denoted by the thick solid line. First order perturbation expansions about Γ = 0+ are indicated by the long dashed lines.
3. Experimental Methods Experiments were performed in a glass tank measuring 197.1 cm long by 19.9 cm wide by 48.5 cm tall (see Figure 6). A 30.0 cm tall, 19.6 cm long platform that spanned the width of the tank was installed at one end. The non-uniform density profile was established using a two-step process. First, a 30.0 cm deep layer of uniformly salt stratified fluid was added to the tank using the “double bucket” technique (Oster (1965)). Thus the top of the stratified fluid was at the level of the top of the platform. A 15.0 cm deep
Intrusive Gravity Currents and Internal Gravity Wave Generation . . .
9
FIG. 5. Predicted normalized intrusion velocities as a function of Γ. The thick curves plot the values in cases with h0 = h1 and h0 ≪ h1 , as indicated. In the former case, thin lines are drawn in the overlap region for values corresponding to non-maximal mass flux (see Sutherland, Kyba & Flynn (2004)). The curve labelled ‘Pert.’ is the second order accurate perturbation approximation about Γ = 0, the curve labelled ‘B68’ is that predicted by Benjamin (1968), and the curve labelled ‘RLD99’ is that predicted by Rooij, Linden & Dalziel (1999).
layer of fresh or slightly saline water was then layered on top of the stratified fluid by trickling it through a sponge float. A traversing conductivity probe was used to measure the resulting density profile. The initial interfacial thickness was approximately 1 cm. After filling the tank, a 0.4 cm thick gate was inserted between a pair of vertical glass guides to the level of the platform. NaCl and a small amount of dye were then added to the lock fluid after which it was made homogeneous by vigorous mixing for a period of approximately 15 s. The resulting fluid had a density ρi . In total, 39 experimental runs were performed in which three parameters were varied: the strength of stratification of the lower layer, as measured by the squared buoyancy frequency, N 2 ; the relative density jump, σ, across the interface; and the relative density of the intrusion as measured by σi0 = (ρi − ρ0 )/ρ00 ≡ σΓ. Note that our definition of σ is the same as that for a two-layer fluid with uniform-density upper and lower layers. Here, however, ρ1 is strictly taken to be the density immediately below the interface between the uniform and stratified layer. Experiments were performed with N 2 ranging from 0.37 s−2 to 1.21 s−2 (±0.04 s−2 ), σ ranging from 0.0015 to 0.0102 (±0.0001) and σi0 ranging from 0.0005 to 0.0023 (±0.0001). With these values, we find the corresponding intrusion depth and speeds give typical Reynolds numbers of Re ≃ 1500. As such, it is reasonable to neglect the role of viscosity in the dynamics of the fluid intrusion. Our interest is in the response of the stratified layer to disturbances caused by intrusions for which the depth of penetration into the stratified (lower) layer is relatively
10
M. R. Flynn and B. R. Sutherland a) Front view Ll = 18.6 cm
h0=15cm
Ο
Tank
z
Lw = 87 cm Screen
h1=30cm
ρ0 ρ1 ρb
Lt = 197.1 cm
ρ
b) Side view Tank
Screen
Fluorescent Bulbs
LG = 1.2 cm
Camera
Lg = 17.6 cm Lc = 400 cm
Ls = 27.9 cm
FIG. 6. (a) Front view of the tank showing the lock-release mechanism by which intrusions are released along the interfacial layer. Also shown is a schematic representation of the density profile. For the purposes of our subsequent analysis, we place the origin of an (x, z) coordinate system at the point denoted by O. (b) Side view of the tank showing the relative positions of the grid of black and white lines, the tank and the CCD camera. (Figures not to scale.)
small because this is most representative of the atmospheric flow depicted in Figure 1 (Cotton & Anthes (1989)). Hence, in the majority of experiments, ρi < hρ10 i (i.e. σi0 < σ/2). In this density regime, the forcing imparted by the fluid intrusion on the lower layer is insufficient to induce a significant bulk motion of stratified fluid. As described in §1, such flows are undesirable because they may excite columnar modes. Runs began by rapidly removing the gate from the tank. The lock fluid then collapsed to form an intrusion that propagated along (or in three extreme cases immediately below) the interfacial layer. The purpose of the platform was two-fold. It inhibited the vertical motion of the fluid intrusion during the initial collapse stage and thereby reduced the magnitude of the transient impulse delivered to the stratified layer. In addition, because the lock fluid extended only to the depth of the platform, and hence to the depth of the interface between the uniform and stratified fluid, no mean flow was induced as a result of stratified ambient fluid replenishing the collapsed lock fluid; only the unstratified ambient developed such a return flow. The resulting fluid motions were recorded to video tape using a CCD camera located Lc = 400 cm in front of the tank. The zoom on the camera was set such that the field of view spanned a horizontal distance Lw = 87 cm with the gate at the left extrem-
Intrusive Gravity Currents and Internal Gravity Wave Generation . . .
11
ity of the field of view. The camera was connected to a computer running DigImage (Dalziel (1992)), a robust image processing program. Experiments were run three-at-a-time. In other words, three intrusions, of progressively larger densities, were released in sequence where in each case, sufficient time (∼ 10 min) was allowed between runs to permit the decay of the internal gravity waves in the stratified fluid. Although mixing and deposition of lock fluid at the interface resulted in successively broader interfacial thicknesses between runs, separate experiments showed that the depth of this mixed region was sufficiently smaller than the intrusion depth that this variation in the density profile had negligible effect. The internal gravity waves that appeared in the stratified (lower) layer were visualised using “synthetic schlieren”, the properties of which are described in detail in Sutherland et al. (1999). The technique exploits variations in the index of refraction with salinity in order to visualize and measure the deflection of light rays as they travel through stratified fluid of spatially and temporally varying density gradient. In the present case, the internal gravity waves were visualised by measuring the distortion of an image of evenly spaced 0.5 cm thick horizontal black and white lines placed Ls = 27.9 cm behind the tank (see Figure 6b). Assuming that the wave field is span-wise uniform (a reasonable approximation given the symmetry of the lock-release mechanism), it is possible to relate the change in the squared buoyancy frequency, ∆N 2 , to the apparent vertical displacement of the lines, ∆z, which under typical conditions, can be measured to within 0.002 cm. Explicitly, ∆N 2 ≃ −α∆z,
(3.1)
Nt2 ≃ −α∆z/∆t.
(3.2)
where α depends upon the refractive indices of air, water and glass as well as Ls , the inside width of the tank, Lg , and the tank wall thickness, LG (see Figure 6b). For the present study, α = 6.4 cm−1 s−2 . The resulting change in the vertical density gradient is then expressed in terms of the change in the squared buoyancy frequency, ∆N 2 . In addition to measuring the apparent displacement of a point from its original position, one may also compute the displacement that occurs during a short time interval, ∆t (typically 0.1 s to 0.2 s). Hence, it is possible to estimate the time derivative of the ∆N 2 field, Nt2 , from Internal gravity waves were observed in all cases except the three experiments with the weakest stratification for which N 2 = 0.37 s−2 . For these three experimental runs, the absence of observed waves is primarily an artifact of the synthetic schlieren technique: for a wave of fixed amplitude and spatial structure, the apparent displacement of the horizontal lines, ∆z, is proportional to N 3 . Hence, the signal from internal gravity waves can be detected and enhanced above noise levels only if N is sufficiently large.
4. Fluid Intrusions 4.1. Qualitative Observations Gravity currents propagating in stratified media are subject to interactions with internal gravity waves whenever vi is less than approximately vLW = N hT /π, the velocity of the longest linear mode-one wave that can exist in a uniformly stratified fluid of depth hT (Maxworthy et al. (2002)). Indeed, the simple calculation in Appendix A shows that symmetric intrusions in uniformly stratified fluid typically exist in a subcritical regime, in which they excite internal waves. (In contrast, bottom-propagating currents in a uniformly stratified ambient are supercritical if their density is sufficiently large, as can
12
M. R. Flynn and B. R. Sutherland
FIG. 7. Image of the intrusion head for the experiment in which N 2 = 0.67 s−2 , σ = 0.0038 and σi0 = 0.0006 (Γ = 0.16). The interface corresponds to the line z = 0 cm. The distances hi0 , hi1 and li are as indicated.
be done without restriction in theory.) Generally speaking, however, strong interactions are noted only when the magnitude of forcing is large. For example in the study of Amen & Maxworthy (1980), (hi /hT )t=0 ≥ 0.40 and a strong internal gravity waveintrusion interaction was observed. By contrast, no such interaction developed in the experiments of Wu (1969) for whom (hi /hT )t=0 = 0.25. In the present study, we primarily consider fluid intrusions with 0 ≤ Γ ≪ 1 and hence whose relative depth of penetration into the stratified layer, hi1 /h1 , is small. This is demonstrated for example by Figure 7 which shows a representative image of the fluid intrusion head. Consistent with the analysis of Faust & Plate (1984) and Rooij (1999), we find that no rhythmic coupling between the intrusion and the internal gravity waves occurs and that over the domain of interest (0 ≤ x ≤ Lw ), the intrusion behaves as a slumping gravity current; vi and hi are approximately constant. In all cases, experiments are terminated before the intrusion’s motion becomes self-similar. The image shown in Figure 7 is similar to Figure 3c of Rottman & Simpson (1983). In particular, we note that when the return flow of non-stratified fluid reaches the tank wall, its reflection generates a forward-propagating rear bore that travels behind the intrusion head. Because the lock fluid does not extend into the stratified (lower) layer initially, no rear bore is excited along the underside of the intrusion (e.g. see Moodie (2002)), though in some experiments undulating waves are evident along the lower interface of the intrusion. 4.2. Determination of vi , hi0 , hi1 , li and ωi As described in Mehta, Sutherland & Kyba (2002), vi was determined from horizontal time series of the digitized experimental images. Values for hi0 and hi1 were found from time series constructed along the vertical slice x ≃ Ll = 18.6 cm. Measurements were made roughly half way between the leading and trailing edges of the intrusion head. In those experiments in which undular patterns were observed along the underside of the intrusion, hi1 was measured halfway between an undular peak and an undular trough. For the intrusion depicted in Figure 7 for example, hi0 = 5.7 ± 0.2 cm whereas hi1 = 1.0 ± 0.2 cm.
Intrusive Gravity Currents and Internal Gravity Wave Generation . . .
13
Vertical time series along x ≃ Ll = 18.6 cm were also employed in determining li , the horizontal extent of the intrusion head. More precisely, li corresponds to the distance between the intrusion’s typically sharp tip and the projected location at which the height of the intrusion head is equal to the height of the trailing tail. For example, Figure 7 shows an intrusion for which li = 37.2 ± 5.0 cm. Errors associated with li are due to the development of the rear bore and billows along the top and back of the intrusion head both of which make it difficult to determine the precise location at which the trailing tail begins. From li , one can estimate characteristic values for ωi , the frequency associated with the forcing imparted by the intrusion. Explicitly, vi (4.1) ωi = 2π . li 4.3. Flow Instabilities Figure 7 shows the development of a series of undular patterns along the underside of the intrusion head. These undulations were noted in 19 of the 39 trials and are believed to result from a weak Kelvin-Helmholtz instability. They were also noted in the studies of Sutherland, Kyba & Flynn (2004), who considered the propagation of a fluid intrusion between uniform layers, and Dugan, Warn-Varnas & Piacsek (1976), who developed a numerical model describing the gravitational collapse of a mixed region in a stratified ambient. Generally speaking, the undulations were observed in runs for which σ was relatively small and σi0 was relatively large. Because vi increases with ρi the stress imparted by the intrusion on the fluid below the interface and the undulation amplitude, Au , are expected to increase with σi0 . Conversely, as σ −σi0 increases, a larger amount of energy is required to lift fluid at or near the interfacial layer. Therefore, Au is expected to decrease with increasing σ in circumstances where ρi < hρ10 i. These observations can be formalized by computing the interfacial Richardson number, Ri, defined as (see equation (1) of Wu (1969)) � �� � ghi 1 ∆ρ . (4.2) Ri = 16 ρ00 vi2 Along the lower flank of the intrusion, ∆ρ/ρ00 = σ − σi0 whereas along the upper flank, ∆ρ/ρ00 = σi0 . Generally speaking, undulations are observed along the intrusion’s lower flank when Ri is less than 1/4. Because the density difference is smaller between the intrusion and ambient across the upper flank, the instability may grow to such large amplitude that it overturns forming billows. 4.4. Comparison with Holyer & Huppert (1980) Figure 8 shows measured values of Hi0 and Hi1 as a function of Γ. In 36 of 39 experiments, ρi < ρ1 , and so Γ < 1. In three experiments, however, the intrusion was sufficiently dense that its bulk propagated below the interface and well within the stratified lower-layer ambient. We plot results for these experiments with values Γ = 1. For comparison, Figure 8 also shows theoretical curves determined from HH80’s coupled system of cubic polynomials for the case where h0 ≪ h1 . Also presented are the first order perturbation expansions given by equations (2.5) and (2.6). Experimental values for Hi0 are effectively independent of Γ and N 2 ; the theory of HH80 moderately overpredicts the observed data. Their model provides a reasonable, albeit somewhat depressed, estimate of the trend exhibited by the experimental data < shown in Figure 8b for Γ ∼ 0.75. Theoretical values typically underpredict experimental > values by 25 to 50%. For relatively dense intrusions (Γ ∼ 0.75), the depth of penetration becomes dependent on the strength of stratification: strongly stratified layers inhibit the
14
M. R. Flynn and B. R. Sutherland
FIG. 8. Normalized depth of penetration into the (a) upper and (b) lower layers. Data point types are as follows - closed hexagons: N 2 = 0.37 s−2 ; open squares: N 2 ≃ 0.67 s−2 ; stars: N 2 = 0.92 s−2 ; closed triangles: N 2 ≃ 1.17 s−2 . The solid and long dashed lines respectively indicate the full solutions predicted by HH80 and the first order perturbation theory approximation to these solutions. The error bars denote the typical measurement uncertainty.
vertical motion of the intrusion more effectively than those that are weakly stratified. These results suggest that, insofar as the dynamics of the intrusion are concerned, the < stratification of the lower layer is not particularly important when Γ ∼ 0.75. Thereafter, hi1 becomes dependent on N 2 and the dynamics influencing the intrusion’s motion are more complicated than those considered by HH80. This observation is consistent with the analysis of Faust & Plate (1984) who considered the propagation of a fluid intrusion within a uniformly stratified ambient and who likewise found that two-layer theory poorly predicts their propagation. The normalized velocity is shown as function of Γ in Figure 9a. Consistent with
Intrusive Gravity Currents and Internal Gravity Wave Generation . . .
15
FIG. 9. (a) Normalized intrusion velocity as a function of Γ. Data point and line types are as indicated in Figure 8. The error bar denotes the typical measurement uncertainty. (b) Log-log plot of the same data but plotted only for those experiments with Γ ≤ 0.75. The slope of the (vertically offset) best-fit line is indicated.
the results demonstrated in Figure 8b, the experimental data shows reasonably good √ < agreement with HH80’s theory for Γ ∼ 0.75. Little variation of vi / σghi with N 2 is observed; within experimental error, vi is a function of Γ alone. Explicitly, from Figure 9b, we find that vi √ ∝ Γ0.32±0.02 , Γ ≤ 0.75. (4.3) σghi The strength of the agreement between the experimental results and the two-layer model of HH80 suggests that the excitation of internal gravity waves does not extract a
16
M. R. Flynn and B. R. Sutherland
significant portion of the intrusion’s horizontal momentum. This result is consistent with the numerical analysis of Ungarish & Huppert (2002) who, in modelling the slumping stage of the bottom-propagating gravity current experiments by Maxworthy et al. (2002), showed that internal waves extracted considerably less potential energy than the gravity current. In contrast, Rooij (1999), observed significant interactions between symmetric intrusions in stratified fluids and the internal waves they generated, estimating that energy extraction by waves in a typical experiment resulted in a 71% decrease in the intrusion speed. Waves are not so energetic in our study because the intrusion’s depth of penetration into the stratified layer is initially zero and typically remains small throughout an experimental run. > We observe significant excitation of columnar modes only when Γ ∼ 0.75. In these cases, the character of the intrusion changes and the agreement between theory and experiment is poor for two reasons. First, the intrusion penetrates more deeply into the lower layer, and therefore its speed is dependent upon the value of N 2 and not just ρ1 . Second, columnar modes are larger amplitude and so interact more strongly with the intrusion in a way that retards its progress. Unfortunately, the experimental apparatus employed in this study is not well suited to distinguish the relative importance of these two affects.
5. Internal Gravity Waves 5.1. Qualitative Observations Nt2
field were constructed along 15 equally spaced columns ranging Time series of the > between x ≃ 10 cm and 35 cm to the right of the gate. For x ∼ 35 cm, upward propagating internal gravity waves reflecting from the bottom of the tank significantly interfered with the downward propagating waves. The time series were Fourier filtered to remove noise due to signal degradation and high-frequency thermal fluctuations in the air space between the camera and the tank. Figure 10 shows a composite vertical time series along the vertical slice x = 18.4 cm ≃ Ll for a particular experimental run. The shear forces exerted by the fluid intrusion generate a region of intense isopycnal distortion immediately below the intrusion head. The internal gravity waves that appear below this region are relatively regular in spatial/temporal structure. The wave amplitude decreases with vertical distance from the wave source due to the combined effects of viscous attenuation and wave dispersion. Because the intrusion speed is approximately constant, Figure 10 is roughly equivalent to a “snapshot” image with a horizontal dimension as indicated. In performing the Galilean translation from t to x, we apply vi = 2.2 cm/s, not vigw = ω/kx = 3.0 cm/s in which ω and kx represent the characteristic internal gravity wave frequency and horizontal wavenumber, respectively. Because the speeds of wave and intrusion propagation are not equal, Figure 10 cannot be regarding as a “true” snapshot image. Nonetheless, it suggests that there is a correlation between the horizontal length scale of the internal gravity waves and the head of the fluid intrusion. This idea is explored in more detail in §5.3. 5.2. Determination of ω, kx and Aξ Estimates of ω and kx were obtained by applying a Fourier analysis similar to that described in Dohan & Sutherland (2003). Consider for example Figure 11a, in which the image from Figure 10 is reproduced over the truncated vertical range −25 ≤ z ≤ −5 cm. The spectrum (in ω − kz space) corresponding to this image was averaged with the
Intrusive Gravity Currents and Internal Gravity Wave Generation . . .
17
FIG. 10. Composite time series along the vertical slice x/Ll = 0.99 corresponding to the experiment for which N 2 = 1.17 s−2 , σ = 0.0037 and σi0 = 0.0020 (Γ = 0.54). The equivalent horizontal scale is indicated by the top axis.
spectra from the 14 other vertical time series from which the arithmetic mean spectrum shown in Figure 11b was obtained. The ω profile depicted in Figure 11c was computed by summing over kz in the average spectrum. This profile was subsequently smoothed using a Gaussian smoothing procedure that employed a bin size of 0.1 s−1 . Although the smoothing routine changes the profile’s peak value, it does not significantly alter the location of the maximum, which in the present case appears at ω ≃ 0.65 s−1 . We consider this the characteristic value of ω for the internal gravity wave field generated in this particular case. We did not compute values for kz from Figure 11b because the vertical scale of the internal gravity waves was comparable with the vertical extent of the field of view. Consequently, horizontal time series of the Nt2 field were reconstructed by combining data from 27 equally spaced vertical time series ranging from x ≃ 5 cm to x ≃ 75 cm. Estimates of kx were derived by computing the associated power spectrum (in kx − ω space) then averaging this spectrum over ω (see Figures 12a, b and c). The kx profile was subsequently smoothed using a Gaussian smoothing procedure having a bin size of 0.05 cm−1 . Although characteristic values for ω could be determined from power spectra such as that shown in Figure 12b, these estimates would be less reliable than those derived directly from the vertical time series owing to the additional step associated with the reconstruction of the horizontal time series from the vertical time series. In addition, because the wave envelope is narrower in Figure 12a as compared to Figure 11a, the peaks in the corresponding power spectrum are less pronounced. Knowing N , ω and kx , values for kz and Θ = cos−1 (ω/N ), the theoretical angle which lines of constant phase form with respect to the vertical, were determined using the
18
M. R. Flynn and B. R. Sutherland
FIG. 11. (a) Vertical time series of the Nt2 field (see also Figure 10). (b) The unsmoothed average power spectrum. (c) The ω profile corresponding to (b). The dashed-and-dotted line denotes the unsmoothed profile whereas the solid line denotes the smoothed profile. In both (b) and (c), the N value (N = 1.08 s−1 ) for this particular experimental run is indicated by the vertical dashed line.
Intrusive Gravity Currents and Internal Gravity Wave Generation . . .
19
FIG. 12. (a) Time series of the Nt2 field along the horizontal slice z/hi1 = −2.0 for the experimental run described in Figures 10 and 11. (b) The power spectrum corresponding to (a). (c) The kx profiles as derived from (b). Line types are as indicated in Figure 11c.
20
M. R. Flynn and B. R. Sutherland
dispersion relation for internal gravity waves (see e.g. Lighthill (1978)). Consistent with the study of Wu (1969), we observe some evolution of the internal gravity wave field over the course of a particular experiment as characterised by an increase in Θ with x. We are primarily interested in the behaviour of the internal gravity wave field in the relatively brief period immediately following the initial, transient collapse of the lock fluid during which wave reflection off the bottom of the tank can be neglected. Hence we consider the waves to be well represented by characteristic values for ω and kx . In particular, the Fourier analysis technique described above is robust in that it is insensitive to the contribution of transient internal gravity waves excited during the initial collapse stage in which lock fluid of density ρi overshoots its point of neutral density and pushes into the stratified layer. For example, if in Figure 11b the average power spectrum included only those vertical time series for which x ≃ 19 cm to 35 cm, we would find that ω ≃ 0.61 s−1 . This result is within 6% of the value determined from Figure 11c. More caution is required, however, when considering the wave amplitude, ANt2 , which is determined from the vertical time series of the Nt2 field. Explicitly, ANt2 is measured by computing ∆I, the maximum difference in pixel intensity between an adjacent wave trough and wave crest. The wave amplitude is then computed as follows ANt2 =
∆I d ·A Nt2 , ∆IM
d where ∆IM = 512 and A Nt2 represents the threshold amplitude. For example, in generat−3 d ing Figure 10, a threshold amplitude of A is employed. Significant variability Nt2 = 0.3 s in ANt2 exists near the lock-release point indicating that the measurement technique is sensitive to the forcing of the stratified layer during the initial collapse stage. As this transient signature decays, however, the measured value for ANt2 obtains a more or less constant value subject to variations of approximately 20%. As such, characteristic values for ANt2 were determined from time series corresponding to x ≃ Ll = 18.6 cm. Furthermore, because the wave amplitude decreases as the wavepacket propagates downwards, ANt2 was measured just below the region of intense isopycnal distortion where the amplitudes were close to their largest values. Once a characteristic value for ANt2 is determined, we estimate the vertical displacement amplitude, Aξ , by assuming small-amplitude Boussinesq, plane waves in a uniformly stratified (Sutherland et al. (1999)): Aξ =
ANt2 . kz ωN 2
(5.1)
5.3. Wave Excitation The generation of internal gravity waves is due primarily to two factors: the initial collapse of the lock fluid and the forcing imparted by the head of the fluid intrusion as it propagates along the interface. Here, focus is directed only to the latter, which represents the dominant mechanism of wave generation beyond x ≃ Ll . Figure 13a shows the variation of Aξ /λx with Γ. There exists a relatively large degree of error associated with the measurement of Aξ , due primarily to the high degree of background noise in the wave field (see e.g. Figure 10). Consistent with the results of < Figure 8b, however, a positive correlation between Aξ /λx and Γ is noted for Γ ∼ 0.75: heavier intrusions penetrate more deeply into the stratified layer and result in larger deflections to the isopycnal surfaces. This in turn yields larger amplitude internal gravity waves. Although the large degree of scatter makes it difficult to determine the precise
Intrusive Gravity Currents and Internal Gravity Wave Generation . . .
21
FIG. 13. (a) Normalized amplitude of the vertical displacement field as a function of Γ. Data point types are as follows - open squares: N 2 ≃ 0.67 s−2 ; stars: N 2 = 0.92 s−2 ; closed triangles: N 2 ≃ 1.17 s−2 . The error bar denotes the typical uncertainty in the measurement of Aξ /λx . (b) Log-log plot of the same data but plotted only for those experiments with Γ ≤ 0.75. The slope of the (vertically offset) best-fit line is indicated.
relation between Aξ /λx and Γ, Figure 9b suggests that Aξ ∝ Γ0.37±0.06 , λx >
Γ ≤ 0.75.
(5.2)
When Γ ∼ 0.75, Aξ /λx also depends N 2 as a result of non-negligible interactions between the intrusion, which penetrates well below the interface, and columnar mode disturbances in the stratified lower layer. The variation of observed wavenumber, kx , with forcing wavenumber, 2π/li , is shown
22
M. R. Flynn and B. R. Sutherland
FIG. 14. (a) Normalized horizontal wavenumber of the internal gravity waves versus the normalized inverse horizontal extent of the intrusion head. The dashed line indicates where kx = 2π/li . (b) Internal gravity wave frequency as a function of the frequency of the forcing imparted by the head of the intrusion. The dashed lines indicate the lines ω = ωi and ω = 2ωi , as indicated. In both cases, data point types are as indicated in Figure 13; the error bars denote the typical measurement uncertainty.
in Figure 14a. Consistent with the interpretation of Figure 10 as a snapshot image, the collapse of the experimental data suggests that there is a direct correlation between the scale of the intrusion head and that of the internal gravity waves it generates. Explicitly, kx = C ·
2π , li
(5.3)
Intrusive Gravity Currents and Internal Gravity Wave Generation . . .
23
FIG. 15. Aξ /λx versus Θ. Data point types are as indicated in Figure 13. The error bar denotes the typical uncertainty in the measurement of Aξ /λx .
where C = 1.32 ± 0.07. It is less clear that the internal gravity wave frequency is set by the frequency at which the fluid intrusion forces the stratified layer. Figure 14b plots the relative wave frequency, ω/N , against the relative forcing frequency, ωi /N . One of the dashed lines superimposed on this plot indicates where ω = ωi . Obviously, waves are not directly excited by the intrusion because, despite the fact that the forcing frequency lies below the buoyancy frequency, in no experiments do the wave frequencies match the intrusion frequency. One might suppose that superharmonic waves are instead excited, hence we also plot the dashed line ω = 2ωi . Though this line passes through the data, there is considerable scatter about it in excess of the typical measurement variability. As an alternative explanation, consider Figure 15 which shows Aξ /λx as a function of Θ and indicates that the most pronounced internal gravity waves propagate within a relatively narrow band of angles to the vertical, Θ, ranging between 41o and 64o . Taken together, Figures 14a and 15 imply that for internal gravity waves generated by the head of an intrusion, the horizontal wavelength is determined by the size of the intrusion head whereas the frequency of propagation is established relative to the buoyancy frequency such that Θ ≃ 53o ± 11o . This narrow frequency range has been observed in a variety of other experimental studies. In his study of wave excitation by the gravitational collapse of a mixed region in uniformly stratified surroundings, Wu (1969) found that the wave energy spectrum was sharply peaked about Θ ≃ 37o . Our results are in better agreement with the more recent studies of Linden (1975) and Dohan & Sutherland (2003), who examined waves generated beneath a turbulent mixed layer in mixing-box experiments. By observing perturbations to suspended aluminum particles, Linden estimated the dominant waves propagated at an angle of 55o . Using Fourier transform analyses of digitised time series images, Dohan and Sutherland found that waves propagated in a range of angles: 42o ≤
24
M. R. Flynn and B. R. Sutherland
TABLE 1. Characteristic angle of wave propagation in five studies involving the dynamic generation of internal gravity waves. Mechanism of internal gravity wave excitation
Θ
Wu (1969)
Intrusive gravity current
≃ 37o
Linden (1975)
Turbulence (no mean flow)
≃ 55o
Sutherland & Linden (1998)
Turbulent shear flow
Dohan & Sutherland (2003)
Turbulence (no mean flow)
42o to 55o
Present study
Intrusive gravity current
41o to 64o
Study
45.9o to 59.9o
Θ ≤ 55o. Wave propagation in this range was also noted by Sutherland & Linden (1998) in their study of stratified flow over a thin barrier. A summary of the above results is presented in Table 1. Possible reasons for this frequency selection were discussed by Dohan & Sutherland (2003). They noted that waves with fixed amplitude and horizontal wavenumber have the great√ est vertical flux of horizontal momentum if their frequency ω = N/ 2, that is, if Θ = 45o . Thus waves of this frequency extract momentum most efficiently from the source and so have the most significant feedback on the generation region. 5.4. Influence of Lower Undulations Figure 16 shows ω/N as a function of the normalised frequency, ωu /N , associated with undulations on the bottom flank of the intrusion head. The plot indicates that in the vast majority of cases the undulations forced the stratified fluid at frequencies in excess of N . Furthermore, Figure 16 demonstrates that ω is not a multiple of ωu . These observations suggest that although the forcing imparted by the intrusion onto the interfacial layer results in periodic Kelvin-Helmholtz disturbances, these features are not primarily responsible for propagating internal wave excitation.
6. Discussion and Conclusions Experiments have been performed in which a fluid intrusion is released along the interface between a uniform fluid (above) and a uniformly stratified fluid (below) using a simple lock release apparatus. Because no return flow of stratified fluid is established by releasing the lock, the generation of internal gravity waves in the stratified fluid is due solely to deflections caused by the fluid intrusion. Unlike the observations made in the related studies of Amen & Maxworthy (1980) and Maxworthy et al. (2002), the intrusion’s speed of propagation is essentially constant; no rhythmic interaction is established between the intrusion and the internal gravity waves. As well as providing insight into the exact solutions of HH80, we have presented perturbation theory results in part to demonstrate the departure of the behaviour of an intrusion from that of a bottom-propagating current as the intrusion’s density increases. We find that leading order terms give estimates accurate to within 50% or better for hi0 , hi1 and vi even when Γ is as large as 3/4. For larger Γ, the intrusion’s behaviour
Intrusive Gravity Currents and Internal Gravity Wave Generation . . .
25
FIG. 16. Normalized frequency of the internal gravity waves, ω, as a function of the normalized undulation frequency, ωu . Data point types are as indicated in Figure 13. The error bars denote the typical measurement uncertainty.
is characterised by a dependence on N 2 and interactions with columnar modes. Such dynamics are more complex than those considered in HH80’s two-layer model. This study is motivated by a desire to assess the ability of thunderstorm outflows that propagate along the tropopause (hereafter referred to as interfacial outflows) to excite internal gravity waves in the stratosphere. In the present set of experiments, the intrusion’s plane of propagation lies above the stratified layer. The Boussinesq approximation suggests, however, that dynamically equivalent results would be obtained if, as in the atmosphere, the stratified layer were forced from below. The Boussinesq approximation is applicable because the dynamics we are interested in occur on scales well below the scale-height of the atmosphere near the tropopause (Spiegel & Veronis (1960)). As well as having non-zero mean horizontal flows, the effective density profile of the real atmosphere is far more complicated than that considered in the present set of experiments. In particular, although a density “step” of magnitude σρ00 was introduced between the upper and lower layers so as to minimize columnar mode excitation, the definition of σ is ambiguous in an atmospheric context (see e.g. Figure 1(b) of Birner, D¨ ornbrack & Schumann (2002)). Furthermore, because of the complexity of convective storm systems, interfacial outflows rarely have the appearance of a simple fluid intrusion. The precise definitions of li and hi are therefore also ambiguous in many circumstances. Consequently, the results described below are intended only to provide crude estimates of the wave momentum flux associated with interfacial outflows. Further study is required to confirm the applicability of the present study to real atmospheric flows. The characteristic period, T , of waves generated by interfacial outflows can be estimated by combining the results of Table 1 with the dispersion relation for internal gravity waves (see e.g. Lighthill (1978)). Taking N ≃ 0.02 s−1 for the stratosphere
26
M. R. Flynn and B. R. Sutherland
(Birner, D¨ ornbrack & Schumann (2002)), the wave period is T ≃ 9 minutes. Such highfrequency waves are known to carry a disproportionate share of the internal gravity wave momentum flux (Dewan et al. (1998), Alexander & Pfister (1995)). To estimate the momentum flux associated with wave generation by interfacial outflows, we seek an equation that relates ρ00 hu′ w′ i to those properties of the intrusion that are directly measurable: vi , hi and li . Explicitly, for Γ ≤ 0.75, the collapse of the data shown in Figure 17 suggests that: � �2.9±0.6 vi hu′ w′ i −3.7±0.3 √ = 10 . (6.1) (N li )2 σghi We assume that li = 500 m, a representative scale for the head of an interfacial outflow (e.g. as visualised by a high-level rope cloud). For the range of normalized velocities corresponding to Γ ≤ 0.75 (see Figure 9), eq. (6.1) predicts average values for ρ00 hu′ w′ i of between 0.2 N/m2 and 3 N/m2 depending on the values chosen for the empirical constants. By contrast, for topographically generated waves, average values for ρ00 hu′ w′ i typically range between 0.1 N/m2 and 1.0 N/m2 (e.g. see Table 1 of Palmer, Shutts & Swinbank (1986)). The fact that the momentum flux associated with interfacial outflows is comparable to that due to topographic forcing is somewhat surprising. Whereas flow over mountains provides a spatially broad and near-continuous source of internal gravity waves, however, large-scale convective events occur sporadically, particularly in the extra-tropics. Furthermore, not all convective storms are of sufficient height to reach the tropopause. Because the stratification of the troposphere is relatively weak, outflows that travel below the tropopause are likely less effective at exciting internal gravity waves in the stratosphere. Taken together, these results suggest that in comparison with topographic forcing, wave excitation by interfacial outflows results globally in a smaller total vertical flux of horizontal momentum in the stratosphere. Locally, however, these may constitute an important source of stratospheric internal gravity waves over the tropical oceans. Acknowledgments We would like to thank James Rottman and reviewers of this paper for their useful comments which have helped to improve the presentation of results. Experiments reported upon here were performed in the Environmental and Industrial Fluid Dynamics Laboratory at the University of Alberta. Graduate financial support was provided by the Natural Science and Engineering Research Council (NSERC) and Alberta’s iCORE program. The authors would like to thank K. Yewchuck for her assistance in taking the photograph shown in Figure 7.
Appendix A. Symmetric Intrusion-Internal Wave Coupling Here we assess theoretically under what conditions a symmetric intrusion can excite internal waves in a uniformly stratified fluid. By “symmetric” we mean that the intrusion propagates at mid-depth with density equal to the density of the ambient at middepth. This circumstance has been studied experimentally by Wu (1969), Manins (1976), Amen & Maxworthy (1980). Figure 18 shows a symmetric fluid intrusion of depth hi and density ρi propagating into a uniformly stratified ambient of depth hT . As discussed in Maxworthy et al. (2002), the internal gravity waves that are excited by the intrusion can propagate no faster than the
Intrusive Gravity Currents and Internal Gravity Wave Generation . . .
27
FIG. 17. Log-log plot of the normalized momentum flux as a function of the normalized intrusion velocity for Γ ≤ 0.75. The slope of the (vertically offset) best-fit line is indicated.
∆ρ ρi
hi
hT
∆ρ
1111111111111111111111111111111111 1111111111111111111111111111111111 1111111111111111111111111111111111 1111111111111111111111111111111111 FIG. 18. The propagation of a symmetric fluid intrusion in stratified surroundings. The density profile is indicated by the thick solid line.
linear mode-one long wave whose velocity is given by N hT . (A 1) π We compare this with the speed, vi , of an intrusive gravity current by adapting the theory of Benjamin (1968) to a two-layer fluid. We assume the speed is controlled by the vLW =
28
M. R. Flynn and B. R. Sutherland
density jump, ∆ρ, across the interface between the ambient and the intrusion head at its widest point, where it has depth hi . Otherwise, we ignore the effect of the ambient stratification. Thus, in the Boussinesq approximation, s� � ∆ρ ghi , (A 2) vi = Fr ρ00 where ρ00 is a standard reference density and the Froude number, Fr, is an order unity quantity that depends on the depth of the intrusion relative to the total depth of the domain. Though isopycnal surfaces are compressed by the passage of the intrusion, to first order, we can approximate the density jump, ∆ρ, by the change in the ambient stratification across the half-depth of the current: 1 ∆ρ ≃ − ρ′ (z)hi . 2
(A 3)
The intrusion speed is therefore Fr vi ≃ √ (N hi ) (A 4) 2 Comparing this result with (A 1), we find the intrusion speed is faster than the fastest internal wave speed only if (Fr/21/2 )(N hi ) > vLW = N hT /π. That is, the system is supercritical if the Froude number exceeds (21/2 /π)hT /hi . In typical circumstances, hT ≫ hi and so, the Froude number being order unity, symmetric intrusions propagate as subcritical disturbances that excite internal waves. REFERENCES Alexander, M. J., Holton, J. R. & Durran, D. R. 1995 The gravity wave response above deep convection in a squall line simulation. J. Atmos. Sci. 52, 2212–2226. Alexander, M. J. & Pfister, L. 1995 Gravity wave momentum flux in the lower stratosphere over convection. Geophys. Res. Lett. 22, 2029–2032. Amen, R. & Maxworthy, T. 1980 The gravitational collapse of a mixed region into a linearly stratified solution. J. Fluid Mech. 96, 65–80. Baines, P. G. 1995 Topographic Effects in Stratified Flows. Cambridge University Press, Cambridge, England. 482 pp. Becker, E. & Schmitz, G. 2002 Energy deposition and turbulent dissipation owing to gravity waves in the mesosphere. J. Atmos. Sci. 59, 54–68. Benjamin, T. B. 1968 Gravity currents and related phenomena. J. Fluid Mech. 31, 209–248. Beres, J. H., Alexander, M. J. & Holton, J. R. 2002 Effects of tropospheric wind shear on the spectrum of convectively generated gravity waves. J. Atmos. Sci. 59, 1805–1824. ¨ rnbrack, A. & Schumann, U. 2002 How sharp is the tropopause at midBirner, T., Do latitudes? Geophys. Res. Lett. 29(14), 10.1029/2002GL015,142. Britter, R. E. & Simpson, J. E. 1978 Experiments on the dynamics of a gravity current head. J. Fluid Mech. 88, 223–240. Britter, R. E. & Simpson, J. E. 1981 A note on the structure of the head of an intrusive gravity current. J. Fluid Mech. 112, 459–466. Clark, T. L., Hauf, T. & Kuettner, J. P. 1986 Convectively forced internal gravity waves: Results from two-dimensional numerical experiments. Quart. J. R. Met. Soc. 112(474), 899–925. Cotton, W. R. & Anthes, R. A. 1989 Storm and Cloud Dynamics. Academic Press, San Diego, USA. D’Alessio, S.J.D., Moodie, T.B., Pascal, J.P. & Swaters, G.E. 1996 Gravity currents produced by sudden release of a fixed volume of heavy fluid. Stud. Appl. Math. 96, 359–385.
Intrusive Gravity Currents and Internal Gravity Wave Generation . . .
29
D’Alessio, S.J.D., Moodie, T.B., Pascal, J.P. & Swaters, G.E. 1997 Intrusive gravity currents. Stud. Appl. Math. 98, 19–46. Dalziel, S. B. 1992 Decay of rotating turbulence: Some particle tracking experiments. Appl. Sci. Res. 49, 217–244. Dewan, E. M., Picard, R. H., O’Neil, R. R., Gardiner, H. A., Gibson, J., Mill, J. D., Richards, E., Kendra, M. & Gallery, W. O. 1998 MSX satellite observations of thunderstorm-generated gravity waves in mid-wave infrared images of the upper stratosphere. Geophys. Res. Lett. 25, 939–942. Dohan, K. & Sutherland, B. R. 2003 Internal waves generated from a turbulent mixed region. Phys. Fluids 15, 488–498. Dugan, J. P., Warn-Varnas, A. C. & Piacsek, S. A. 1976 Numerical results for laminar mixed region collapse in a density stratified fluid. Comp. Fluids 4, 109–121. Faust, K. M. & Plate, E. J. 1984 Experimental investigation of intrusive gravity currents entering stably stratified fluids. J. Hydraul. Res. 22(5), 315–325. Fovell, R., Durran, D. & Holton, J. R. 1992 Numerical simulations of convectively generated stratospheric gravity waves. J. Atmos. Sci. 49(16), 1427–1442. Fritts, D. C. & Nastrom, G. D. 1992 Sources of mesoscale variability of gravity waves. Part II: Frontal, convective, and jet stream excitation. J. Atmos. Sci. 49, 111–127. Gavrilov, N. M. & Roble, R. G. 1994 The effect of gravity-waves on the global mean temperature and composition structure of the upper-atmosphere. J. Geophys. Res. 99(D12), 25773–25780. Hallworth, M. A., Huppert, H. E., Phillips, J. C. & Sparks, R. S. J. 1996 Entrainment into two-dimensional and axisymmetric turbulent gravity currents. J. Fluid Mech. 308, 289–311. ¨ rtel, C., Kleiser, L., Michaud, M. & Stein, C. F. 1997 A direct numerical simulation Ha approach to the study of intrusion fronts. J. Eng. Math. 32, 103–120. Holyer, J. Y. & Huppert, H. E. 1980 Gravity currents entering a two-layer fluid. J. Fluid. Mech. 100, 739–767. Huppert, H. E. & Simpson, J. E. 1980 The slumping of gravity currents. J. Fluid Mech. 99, 785–799. Keulegan, G. H. An experimental study of the motion of saline water from locks into fresh water channels. Technical Report 5168, Nat. Bur. Stand. Rept., 1957. Kida, H. A. 1984 A numerical experiment on the general circulation of the middle atmosphere with a three-dimensional model explicitly representing internal gravity waves and their breaking. Pure Appl. Geophys. 122, 731–746. Klemp, J. B., Rotunno, R. & Skamarock, W. C. 1994 On the dynamics of gravity currents in a channel. J. Fluid Mech. 269, 169–198. Lighthill, M. J. 1978 Waves in Fluids. Cambridge University Press, Cambridge, England. 504 pp. Linden, P. F. 1975 The deepening of a mixed layer in a stratified fluid. J. Fluid Mech. 71, 385–405. Lindzen, R. S. 1974 Stability of a Helmholtz velocity profile in a continuously stratified infinite Boussinesq fluid – applications to clear air turbulence. J. Atmos. Sci. 31, 1507– 1514. Lindzen, R. S. 1981 Turbulence and stress owing to gravity wave and tidal breakdown. J. Geophys. Res. 86, 9707–9714. Long, R. R. 1955 Some aspects of the flow of stratified fluids. III Continuous density gradients. Tellus 7, 341–357. Manins, P.C. 1976 Intrusion into a stratified media. J. Fluid Mech. 74, 547–560. Mason, P. J. & Sykes, R. I. 1982 A two-dimensional numerical study of horizontal role vortices in an inversion capped boundary layer. Quart. J. Roy. Meteor. Soc. 108, 801–823. Maxworthy, T., Leilich, J., Simpson, J. & Meiburg, E. H. 2002 The propagation of a gravity current in a linearly stratified fluid. J. Fluid Mech. 453, 371–394. Mehta, A., Sutherland, B. R. & Kyba, P. J. 2002 Interfacial gravity currents: Part II - wave excitation. Phys. Fluids 14, 3558–3569. Moodie, T.B. 2002 Gravity currents. J. Comput. Appl. Math. 144, 49–83. Oster, G. 1965 Density gradients. Sci. Am. 213, 70.
30
M. R. Flynn and B. R. Sutherland
Palmer, T. N., Shutts, G. J. & Swinbank, R. 1986 Alleviation of a systematic westerly bias in general circulation and numerical weather prediction models through an orographic gravity drag parametrization. Quart. J. Roy. Meteor. Soc. 112, 1001–1039. Plumb, R. A. & McEwan, A. D. 1978 The instability of a forced standing wave in a viscous, stratified fluid: A laboratory analogue of the quasi-biennial oscillation. J. Atmos. Sci. 35, 1827–1839. Rooij, F. de 1999 Sedimenting particle-laden flows in confined geometries. Ph.D. thesis, University of Cambridge. Rooij, F. de, Linden, P. F. & Dalziel, S. B. 1999 Saline and particle-driven interfacial intrusions. J. Fluid Mech. 389, 303–334. Rose, W. I., Bluth, G. J. S., Schneider, D. J., G. G. J. Ernst, C., Riley, M., Henderson, L. J. & McGimsey, R. G. 2001 Observations of volcanic clouds in their first few days of atmospheric residence: The 1992 eruptions of Crater Peak, Mount Spurr Volcano, Alaska. J. Geol. 109, 677–694. Rottman, J. W. & Simpson, J. E. 1983 Gravity currents produced by instantaneous releases of a heavy fluid in a rectangular channel. J. Fluid Mech. 135, 95–110. Salby, M. L. & Garcia, R. R. 1987 Transient response to localized episodic heating in the tropics. Part I: Excitation and short-time near-field behavior. J. Atmos. Sci. 44, 458–498. Schooley, A.H. 1967 Wake collapse in a stratified fluid. Science 157, 421–423. Schooley, A.H. & Hughes, B.A. 1972 An experimental and theoretical study of internal waves generated by the collapse of a two-dimensional mixed region in a density gradient. J. Fluid Mech. 51, 159–175. Shin, J.O., Dalziel, S.B. & Linden, P.F. 2003 Gravity currents produced by lock exchange. J. Fluid Mech. page in press. Simpson, J. E. 1972 Effects of lower boundary on the head of a gravity current. J. Fluid Mech. 53, 759–768. Simpson, J. E. 1982 Gravity currents in the laboratory, atmosphere, and ocean. Ann. Rev. Fluid Mech. 14, 213–234. Simpson, J. E. 1997 Gravity Currents. Cambridge University Press, Cambridge, England, 2nd edition. 244 pp. Simpson, J. E. & Britter, R. E. 1979 The dynamics of the head of a gravity current advancing over a horizontal surface. J. Fluid Mech. 94, 477–495. Spiegel, E. A. & Veronis, G. 1960 On the Boussinesq approximation for a compressible fluid. Astrophys. J. 131, 442–447. Sutherland, B. R. 1996 The dynamic excitation of internal gravity waves in the equatorial oceans. J. Phys. Oceanogr. 26, 3214–3235. Sutherland, B. R., Caulfield, C. P. & Peltier, W. R. 1994 Internal wave generation and hydrodynamic instability. J. Atmos. Sci. 51, 3261–3280. Sutherland, B. R., Dalziel, S. B., Hughes, G. O. & Linden, P. F. 1999 Visualisation and measurement of internal waves by “synthetic schlieren”. Part 1: Vertically oscillating cylinder. J. Fluid Mech. 390, 93–126. Sutherland, B. R., Kyba, P. J. & Flynn, M. R. 2004 Interfacial gravity currents in two-layer fluids. J. Fluid Mech. page submitted. Sutherland, B. R. & Linden, P. F. 1998 Internal wave generation by flow over a thin barrier. J. Fluid Mech. 377, 223–252. Ungarish, M. & Huppert, H. E. 2002 On gravity currents propagating at the base of a stratified fluid. J. Fluid Mech. 458, 283–301. Wu, J. 1969 Mixed region collapse with internal wave generation in a density stratified medium. J. Fluid Mech. 35, 531–544.