Nov 30, 2009 - features and cepstral mean normalization in hostile environ- ments ..... advances in addressing sources of non-linguistic information,â in Proc.
2005 Asia-Pacific Conference on Communications, Perth, Western Australia, 3 - 5 October 2005.
INVESTIGATION OF ROBUST FEATURES FOR SPEECH RECOGNITION IN HOSTILE ENVIRONMENTS Aik Ming Toh
Roberto Togneri
Sven Nordholm
School of Electrical, Electronic, and Computer Engineering The University of Western Australia
School of Electrical, Electronic, and Computer Engineering The University of Western Australia
Western Australian Telecommunications Research Institute
Abstract— This paper presents an investigation of robust features for speech recognition in three different noisy environments. The state-of art Mel-frequency cepstral coefficients were extensively explored in additive, convolutive and reverberant environments. These environments have captured the interest of many researches in speech recognition systems. We evaluate robust speech recognition results on the TI-DIGIT database. Significant word error rate reductions were observed in the connected digit recognition experiments. The recognition experiments vindicate the robustness of Mel-frequency cepstral coefficient with dynamic features and cepstral mean normalization in hostile environments, especially additive and reverberant noise.
I. INTRODUCTION Present speech recognition systems are embedded in a diversity of applications such as mobile devices, automotive vehicles, industrial and military devices. These environments have significant level of background noise, reverberation and distortion. The performance of speech recognition systems deteriorate in a hostile environment. Major hostile environments include additive background noise, channel distortion and reverberant environment. Current approaches for noise robust speech recognition systems can be classified into three categories. The most fundamental approach is the robust feature extraction scheme. This category includes auditory models [1], signal conditioning techniques [2] and high-pass processing methods [3]. The second approach, model compensation technique, adapts the acoustic models in the pattern matching stage. The compensation scheme composed of model-based stochastic matching [4], model decomposition of speech and noise [5] and parallel model combination [6]. The last approach, data compensation method, attempts to recover the speech signal from the corrupted signal in the feature parameter domain. Probabilistic mapping [7] and probabilistic optimal filtering [8] are associated in this category. Most compensation techniques require clean speech or noise models estimation in a given environment. This limitation makes the robust feature extraction approach more attractive since it does not require estimation on the testing environments. A significant amount of effort has been devoted to establish speech feature extraction schemes for robustness and high
accuracy speech recognition in hostile environments. The state-of-art speech feature used in current speech recognition systems is the Mel-frequency cepstral coefficients. Hermansky introduced the perceptual linear predictive technique as an auditory-like spectrum based on linear predictive analysis of speech [9]. Bayya and Yegnanarayana proposed the group delay spectrum as robust features for speech recognition [10]. Other proposed features include phase features [11], temporal information [12],[13] and product spectrum [14]. In this paper, we investigate and evaluate the robustness of the most popular feature extraction technique in the presence of noise. We examine the performance and robustness of the speech features in additive background noise, convolutional distortion and reverberant noise. To date only PLP and RASTA-PLP features have been evaluated for speech recognition in reverberant environments [15]. Our work will concentrate on the robustness of the Mel-frequency cepstral coefficients and its variants in three different noisy environments including the reverberant environment. The robustness of dynamic features and cepstral mean normalization are also explored in these environments. The paper is organized as follows: We present information on the characteristic of noisy environments and feature extraction in the next two sections. Section 3 specifies the experimental setup followed by experiment results in section 4. Section 5 comprises the conclusions. II. CHARACTERISTIC OF HOSTILE ENVIRONMENTS Most background noises are modeled as additive perturbations which are uncorrelated with the signal. Additive noise is known to cause a shift in the mean and changes in the variance of the log spectral components [16]. The additive noise is assumed to be stationary in the short span of the speech frame and uncorrelated with the speech signal in spectral analysis. Convolutional spectral distortions are mostly caused by variable frequency characteristics of different communication channels or the use of different microphones. Linear timeinvariant filters introduce a fixed or slowly varying terms in
0-7803-9132-2/05/$20.00 ©2005 IEEE.
Authorized licensed use limited to: University of Western Australia. Downloaded on November 30, 2009 at 23:44 from IEEE Xplore. Restrictions apply.
956
10000
−200
Frequency
8000
−400
6000
−600 4000
0
50
100
150
200
250
300
0
50
100
150
200
250
300
0
50
100
150
200
250
300
0
50
100
150
200
250
300
−200
2000
−400 0
0
0.5
1
1.5 Time
2
2.5
−600 0
10000
−200 8000 Frequency
−400 6000
−600
4000
0 −200
2000
−400 0
0
0.5
1
1.5 Time
2
2.5
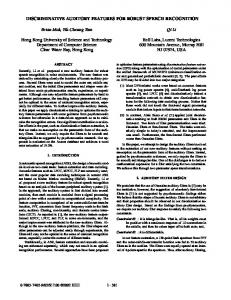
Fig. 1. Spectrograms for clean and reverberant (RT 0.3s) utterance ”1171889”
the log spectral domain. Such distortion appears as an additive constant in the logarithmic spectrum of the speech. Reverberant noise is a form of distortion that is distinct from both additive and spectral shifting [16]. It creates interference that is correlated with the speech signal. Although reverberation and channel distortion are both forms of linear convolutional distortion, the multiplicative assumption (convolution property) fails to hold for reverberation when short-term analysis is considered. The long room impulse response of the reverberation often does not achieve steady state during the short-term frame analysis. Since the impulse response duration is longer than the analysis frame, the convolution property no longer holds for reverberant effects in the short-term frame analysis. Hence cepstral mean normalization does not perform as efficiently as in linear channel distortion. Figure 1 displays the spectrogram of the clean connected digit utterance “1-1-7-1-8-8-9” and the utterance under the influence of reverberation time (RT) 0.1s. The spectrogram reveals the smearing effect in the temporal domain. This smearing effect is more prominent in the decay region of the phoneme and it causes the intensity of the speech in low speech region to increase. Figure 2 illustrates the power spectra of the entire clean speech, reverberant speech of RT 0.3s and RT 0.6s. We can observe the spectral flattening effect inflicted by the reverberation on the spectral envelope. III. FEATURE EXTRACTION Automatic speech recognition system uses feature based representation for recognition. Feature extraction is the process of obtaining different features from the speech signal. These features aim to preserve the information needed to determine the phonetic identity of a portion of speech while being as impervious as possible to factors such as speaker differences, communication channel effects and paralinguistic factors such as emotional state of speakers. A. Mel-Frequency Cepstral Coefficients The speech signal is segmented into frames and each frame is windowed and transformed into power spectrum. The power
−600
Fig. 2. Power spectra in dB for clean, reverberant (RT 0.3s, RT 0.6s and RT 0.9s) utterance ”1171889”
spectrum is then warped using Mel-scale filter bank. The Mel filter bank models the hair spacings along the basilar membrane of the human ear. It allocates more filters to the lower frequencies and emphasizes the higher frequencies. Logarithmic compression is applied to each of the Mel spectral vectors to approximate the human auditory processing [17]. The log Mel spectrum is then converted into MFCC vectors via Discrete Cosine Transform (DCT). Each frame comprises typically 12 features for baseline MFCC. B. Regression Features Cepstral vectors are often appended by a vector which indicates the rate of change (velocity or delta) and an acceleration of the spectral components (double delta parameters). Furui introduced the regression features to describe the trajectories of speech parameters in the vicinity of a given speech vector [18]. He proposed using the first three coefficients of the orthogonal polynomial representation of the trajectories of cepstral coefficients. These are used to describe the mean value, the slope and the curvature of trajectories within the given segment of cepstral feature representation. The regression feature calculation represents the FIR filtering of time trajectories of cepstral coefficients. Regression features are shown to be invariant to slowly varying linear or convolutive distortions of signals. C. Cepstral Mean Normalization Cepstral mean normalization (CMN) is a de facto standard for most large vocabulary speech recognition systems. The algorithm computes a long-term mean value of the feature vectors and subtracts the mean value from the cepstral vectors of that utterance on a sentence-by-sentence basis. CMN reduces the variability of the data and allows simple but effective channel and speaker normalization. In the cepstral domain, CMN removes the means of all time trajectories of the cepstrum and set the log spectrum mean to zero.
957
Authorized licensed use limited to: University of Western Australia. Downloaded on November 30, 2009 at 23:44 from IEEE Xplore. Restrictions apply.
TABLE I W ORD ERROR RATES FOR SPEECH RECOGNITION IN ADDITIVE PINK NOISE ENVIRONMENT Features/SNRdB
clean
40
35
30
25
20
15
10
5
0
MFCC 0 MFCC 0 D MFCC 0 D A MFCC 0 Z MFCC 0 D Z MFCC 0 D A Z
2.23 0.59 0.59 1.41 0.47 0.57
3.04 0.64 0.57 1.76 0.57 0.54
5.15 0.79 0.67 2.33 0.64 0.59
12.62 1.26 0.94 3.12 0.82 0.64
28.94 3.04 1.63 5.47 1.41 1.11
41.78 10.89 5.00 14.73 2.82 2.10
59.08 27.80 14.60 39.26 8.86 6.76
77.33 52.18 42.52 70.45 31.78 26.34
92.25 79.58 78.71 88.00 63.51 63.56
93.12 89.11 90.97 91.58 80.69 83.56
FBANK FBANK D FBANK D A FBANK Z FBANK D Z FBANK D A Z
2.08 1.06 1.53 4.98 1.56 1.76
5.92 1.44 2.18 6.86 2.30 2.18
13.29 3.02 5.59 9.31 3.07 3.09
24.38 10.12 13.04 16.16 5.67 5.82
34.33 26.81 26.73 28.94 11.73 11.93
48.12 43.81 42.72 48.49 27.90 28.39
68.39 58.54 56.73 69.73 56.98 65.79
90.02 77.23 73.02 82.40 80.82 88.02
96.14 92.48 90.42 89.23 89.90 93.51
95.62 91.91 90.37 89.55 91.83 92.13
IV. EXPERIMENTAL SETUP The TI-DIGIT corpus was used to evaluate the performance of speech features for speech recognition. This database comprised both isolated and connected digit utterances. The database was divided into a training set and a testing set. Clean speech utterances were used for training data. The testing data of 4040 utterances was corrupted or degraded for noisy speech of different hostile environments. The speech recognition process was performed using HTK. Two different background noises from the NOISEX-92 database were used to corrupt utterances for the speech recognition in additive noise. The babble noise represented a real-world non-stationary environment noise whereas the pink noise was used to capture the stationary nature of background noises. The testing data was corrupted with the additive noise at different signal-to-noise ratio (SNR) from -5dB to 40dB at the interval of 5dB. The channel distortions were simulated with a least squared FIR filter or a Hamming windowed FIR filter. The selected filter bandwidth was [400Hz 3400Hz] which was used for telephone networks [19]. Reverberation effects were captured by estimating the impulse response of the room environments from long segments of speech. The room impulse response in this experiment was designed to match the characteristic of a room with dimension of 2.2m high, 3.1m wide and 3.5m long. Both the microphone and the source speaker were positioned 0.5m from the wall at the opposite end. The speech was artificially degraded by convolving it with room impulse response of RT60. The number of filter coefficients has been adjusted according to the reverberation time. The source speech was sampled at 20 kHz. All speech files were pre-emphasized and windowed with a Hamming window. The speech signal was analyzed every 10ms with a frame width of 25ms. A Mel-scale triangular filterbank designed with 26 filterbank channels was used to generate the MFCC coefficients. There were 12 cepstral coefficients computed for both MFCC and PLP static features. The HMM model used
15 states and 5 mixtures for the connected digit recognition. The Mel-Frequency Cepstral Coefficients (MFCC) and Perceptual Linear Predictive (PLP), were used for the speech recognition. Variants of MFCC features such as zeroth cepstral coefficients (MFCC 0), Mel-spectrum (MELSPEC) and log Mel-spectrum (FBANK) were also evaluated in the recognition process. Cepstral mean normalization (Z) was utilized on MFCC 0 and PLP cepstral features. The regression features, delta (D) and double delta (D A), were used to incorporate temporal information in speech features. V. EXPERIMENT RESULTS High word error rates (WER) were obtained for both PLP and MELSPEC features. Thus, this paper presents only the results for MFCC 0 and FBANK variants. The WER was calculated by taking the recognition accuracy from 100% A. Recognition in Additive Noise 1) Stationary pink noise: MFCC 0 D A Z was clearly the optimal robust feature for speech recognition in stationary noise such as the pink noise in Table I. Both the delta and double delta features contribute significantly in WER reduction. The regression features decreased the WER by 75% for clean speech recognition. The delta feature even achieved 90% WER decrease and double delta feature reduced the WER by more than 94% for speech recognition in pink noise of SNR 25dB. The WER was maintained at less than 10% for SNR valus higher than 15dB with the combinaiton of CMN and regression features. The CMN did not contribute as much robustness as the regression features but the combination of CMN and D A gave the optimal performance. The FBANK features did not show similar trend as in MFCC 0. The regression features did improve the robustness against additive noise but the effectiveness of CMN was not consistent in the pink noise. 2) Non-stationary noise: The results from Table II do not reveal any single feature that is the most robust in all noise level conditions. The regression features, delta and double delta, significantly improved the robustness of the MFCC 0
958
Authorized licensed use limited to: University of Western Australia. Downloaded on November 30, 2009 at 23:44 from IEEE Xplore. Restrictions apply.
TABLE II W ORD ERROR RATES FOR SPEECH RECOGNITION IN ADDITIVE BABBLE NOISE ENVIRONMENT Features/SNRdB
clean
40
35
30
25
20
15
10
5
0
MFCC 0 MFCC 0 D MFCC 0 D A MFCC 0 Z MFCC 0 D Z MFCC 0 D A Z
2.10 0.52 0.50 1.31 0.37 0.47
2.33 0.47 0.50 1.53 0.47 0.52
2.45 0.42 0.50 1.63 0.47 0.57
3.09 0.45 0.54 2.18 0.64 0.54
6.78 0.69 0.79 2.92 0.84 0.57
17.97 2.70 5.57 5.37 1.21 0.94
36.01 12.00 20.15 12.87 2.80 2.13
59.93 33.89 43.14 35.30 10.27 8.17
82.10 58.12 66.98 68.71 34.46 29.63
90.20 82.85 85.50 83.89 71.61 69.13
FBANK FBANK D FBANK D A FBANK Z FBANK D Z FBANK D A Z
2.05 0.94 1.01 2.13 1.01 1.14
2.03 1.06 1.09 2.28 1.34 1.29
2.30 1.04 1.09 3.02 1.53 1.29
4.38 1.41 2.92 4.41 1.86 1.66
9.85 4.33 9.23 8.02 2.95 2.48
22.52 15.17 23.94 18.39 5.89 5.15
43.24 35.22 44.88 34.85 14.93 15.17
58.91 56.66 69.63 60.37 37.80 38.91
76.59 83.12 97.72 77.60 70.07 71.71
88.12 96.04 107.82 83.37 86.31 86.81
features. MFCC 0 D yielded about 75% to 89% of WER reduction in SNR range of 40dB to 25dB. The minimal WER for clean environment was recorded by the MFCC 0 D Z set. The MFCC 0 D A Z demonstrated its robustness in the SNR level of 25dB and lower. The robust MFCC 0 D A Z maintained WER of less than 10% even for SNR of 10dB. The FBANK features showed that delta and double delta features were important for WER reduction in additive environments. FBANK D gave the lowest WER down to an SNR of 30dB. The significance of CMN can be noticed for SNR values lower than 30dB, as shown by the FBANK D A Z, FBANK D Z and FBANK Z features. B. Recognition in Convolutional Noise The speech utterances were filtered with two different kinds of FIR filter to generate channel distorted signals. Table III records the WER results for speech recognition in convolutive noise. A significant reduction in the word error rates could be observed for all MFCC0 and FBANK features with cepstral mean normalization. The results for the MFCC 0 Z features showed that CMN contributed about 84% to 85% WER reduction to the baseline MFCC 0. The results for the FBANK features with CMN also demonstrated a WER reduction of more than 50%. The use of mean normalization, however, did not offer any contribution to WER reduction for the MELSPEC features (Not shown here). This accentuated the effectiveness of CMN in alleviating the additive constant in the logarithmic spectrum of the speech. The use of regression features, delta and double delta decreased the WER for all the features. Delta features gave a WER reduction of about 20% to 30% for most of the evaluated features. The double delta contributed a further reduction in WER for MFCC 0 and FBANK. Thus, the hybrid MFCC 0 D A Z and FBANK D A Z yielded the lowest WER compared to their baseline features. C. Recognition in Reverberant Noise Speech recognition in reverberant environment was evaluated for RT60 range of 0.0s to 1.0s. Table IV presented the
WER results up to RT 0.5s since the WER for reverberation time greater than 0.5s were all above 40%. Table IV shows that the regression features, delta and double delta, both reduce the WER of MFFC 0 and FBANK features. Cepstral mean normalization also gave slight reduction in the WER of MFCC 0. The optimal feature set for the reverberant environment was given by the MFCC 0 D A and MFCC 0 D Z. The delta feature was an important robust feature for the MFCC 0 in this environment. The acceleration contributed slight improvements in low reverberations from 0.0s to 0.2s. After 0.2s, cepstral mean normalization started to play a significant role in robustness against reverberation. The differences in WER for MFCC 0 D A and MFCC 0 D Z were less than 0.2% for reverberation range of 0.0s to 0.2s. However, a 0.05% WER reduction, as shown by MFCC 0 D A in RT 0.0s, would have 202 correct speech utterances in the recognition process. The FBANK sets indicated that both regression features and cepstral mean normalization played a significant role in the WER reduction. FBANK D A Z and FBANK D Z gave the lowest WER in low reverberation. Cepstral mean normalization remained important for FBANK throughout the reverberation time range. It became essential after reverberation time of 0.5s. VI. C ONCLUSION This paper has evaluated the optimality of dynamic features and cepstral mean normalization performed on baseline features in hostile environments. The Mel-frequency cepstral coefficients, Mel-spectrum and log Mel-spectrum were used as baseline features for speech recognition in different noisy environments. Enhancements such as dynamic features and cepstral mean normalization were appended or incorporated as robust features for speech recognition. Mel-frequency cepstral coefficients achieved optimal performances for speech recognition in hostile environments. Two different additive background noises were simulated and evaluated for speech recognition. The experiments show
959
Authorized licensed use limited to: University of Western Australia. Downloaded on November 30, 2009 at 23:44 from IEEE Xplore. Restrictions apply.
TABLE III
TABLE IV
W ORD ERROR RATES FOR SPEECH RECOGNITION IN CONVOLUTIVE
W ORD ERROR RATES FOR SPEECH RECOGNITION IN REVERBERANT NOISE
ENVIRONMENT
ENVIRONMENT
Filters Features
Least-Sq Bandpass
Least-Sq Lowpass
Hamming Bandpass
Hammng Lowpass
Reverberation time(s)
0.0
0.1
0.2
0.3
0.4
0.5
MFCC 0 MFCC 0 D MFCC 0 D A MFCC 0 Z MFCC 0 D Z MFCC 0 D A Z
79.31 46.96 37.92 12.43 5.54 3.66
70.30 37.55 28.39 10.37 3.22 2.3
78.86 47.03 40.12 13.24 7.72 4.6
73.69 42.50 34.78 12.62 6.21 3.29
MFCC 0 MFCC 0 D MFCC 0 D A MFCC 0 Z MFCC 0 D Z MFCC 0 D A Z
4.38 0.99 0.87 3.02 0.92 0.97
4.48 0.94 0.82 3.14 0.92 0.89
7.40 2.03 1.51 4.46 1.66 1.53
12.75 4.43 4.31 6.81 3.22 3.54
22.65 10.15 14.70 14.18 7.48 9.23
33.91 20.72 25.05 25.84 16.34 20.20
FBANK FBANK D FBANK D A FBANK Z FBANK D Z FBANK D A Z
81.61 49.16 47.03 35.62 19.78 15.94
70.92 43.66 40.57 34.38 18.56 19.33
82.77 51.58 49.11 38.29 22.08 19.23
72.03 47.15 45.60 38.37 22.70 14.43
FBANK FBANK D FBANK D A FBANK Z FBANK D Z FBANK D A Z
7.18 3.44 4.06 3.34 3.17 2.30
7.20 3.69 4.16 3.42 3.14 2.62
16.58 10.72 13.71 5.87 3.84 4.21
28.84 21.41 34.43 11.51 8.54 12.13
46.61 40.07 58.07 22.35 20.15 28.84
60.97 58.07 68.79 36.83 38.89 46.46
that regression features and cepstral mean normalization have improved both the recognition rate and robustness of baseline features in the presence of additive noise. However, optimal robust feature selection remains an issue in additive noise. The results in additive environment do not show any single feature set to be the most robust feature in different types of additive noise. This was largely due to the differences in stationary property of each background additive noise. Nevertheless the combination of regression features and cepstral mean normalization gave the best performances for Mel-frequency cepstral coefficients. We have shown that cepstral mean normalization has successfully alleviated the effects of convolutional spectral distortion. Cepstral mean normalization removes the means of all the time trajectories of the cepstral coefficients. The dynamic features also contributed to WER reduction since they are invariant to slowly varying linear distortions introduced by the filters. The optimal feature set for the reverberant environment was given by the MFCC 0 D A and MFCC 0 D Z. Both MFCC 0 and FBANK features indicated that the regression features and cepstral mean normalization played a significant role in the WER reduction. The delta feature, in particular, was an important robust feature for the MFCC 0 in this environment. Cepstral mean normalization contributed significantly to robustness in reverberant environment with reverberation time more than 0.2s. ACKNOWLEDGMENT The author would like to thank Alan Davis for his assistance in generating the room impulse response coefficients. R EFERENCES
[2] M.G. Rahim, B.H. Juang, W. Chou, and E. Buhrke, “Signal conditioning techniques for robust speech recognition,” in IEEE Signal Processing Lett., Apr. 1996, pp. 107–109. [3] H.Y. Jung and S.Y. Lee, “On the temporal decorrelation of feature parameters for noise robust speech recognition,” IEEE Trans. Speech Audio Processing, vol. 8, no.4, July 2002. [4] A. Sankar and C.H. Lee, “A maximum-likelihood approach to stochastic matching for robust speech recognition,” IEEE Trans. Speech Audio Processing, vol. 4, May 1996. [5] A. P. Varga and R. K. Moore, “Hidden markov model decomposition of speech and noise,” in Proc ICASSP, 1990, pp. 845–848. [6] M.J.F. Gales, “Model-based techniques for noise robust speech recognition,” Ph.D. dissertation, Univ. Cambridge, Cambridge, U.K., 1995. [7] D.Y. Kim and C.K. Un, “Probabilistic vector mapping with trajectory information for noise-robust speech recognition,” in Electron. Lett., Aug. 1996, vol. 32, no.17, pp. 1550–1551. [8] L. Neumeyer and M. Weintraube, “Probabilistic optimum filtering for robust speech recognition,” in Proc ICASSP, 1994, vol. I, pp. 417–420. [9] H. Hermansky and N. Morgan, “Rasta processing of speech,” IEEE Trans. Speech Audio Processing, vol. 2, no.4, 1994. [10] A. Bayya and B. Yegnanarayama, “Robust features for speech recognition systems,” in Proc ICSLP, 1998, p. 1121. [11] A.C. Lindgren, M.T. Johnson, and R.J. Povinelli, “Joint frequency domain and reconstructed phase space features for speech recognition,” in Proc ICASSP, May 2004. [12] B. Milner, “Inclusion of temporal information into speech features for speech recognition,” in Proc ICSLP, 1996, pp. 256–259. [13] H. Hermansky, “Mel cepstrum, deltas, double deltas, .. -what else is new?,” in Proc. Robust Methods for Speech Recognition in Adverse Condition, 1999. [14] D.Z.a.K Paliwali, “Product of power spectrum and group delay function for speech recognition,” in Proc ICASSP, May 2004. [15] B.E.D. Kingsbury and N. Morgan, “Recognizing reverberant speech with rasta-plp,” in Proc ICASSP, 1997, vol. 2, pp. 1259–1262. [16] H. Hermansky, C. Avendano, S. v. Vuuren, and S. Tibrewala, “Recent advances in addressing sources of non-linguistic information,” in Proc ESCA, 1997, pp. 103–106. [17] S.B. Davis and P. Mermelstein, “Comparison of parametric representations of monosyllabic word recognition in continuouslyspoken sentences,” IEEE Trans. Speech Audio Processing, 1980. [18] S. Furui, “Speaker-independent isolated word recognition using dynamic features of speech spectrum,” IEEE Trans. Acoustics, Speech and Signal Processing, vol. 34, no.1, pp. 52–59, 1986. [19] P.J.Moreno, “Speech recognition in telephone environments,” Master of Sc. dissertation, Carnegie Mellon University, 1992.
[1] D.S. Kim, S.Y. Lee, and R.M. Kil, “Auditory processing of speech signals for robust speech recognition in real-world noisy environments,” IEEE Trans. Speech Audio Processing, vol. 7, pp. 55–69, Feb. 1999.
960
Authorized licensed use limited to: University of Western Australia. Downloaded on November 30, 2009 at 23:44 from IEEE Xplore. Restrictions apply.