Nutrition, University of Illinois at Urbana-Champaign, 1304 W. Pennsylvania Avenue, Urbana, ... require effective seal integrity tests for quality assurance.
Investigation of Spatial Sampling Resolution of the Real-Time Ultrasound Pulse-Echo BAI-mode Imaging Technique Xiangtao Yin*', Scott A. Morris' and William D. OBrien, Jr.' 'Bioacoustics Research Laboratory, Department of Electrical and Computer Engineering, University of Illinois at Urbana-Champaign, 405 N. Mathews, Urbana, IL 61801 and 'Department of Food Science and Human Nutrition, University of Illinois at Urbana-Champaign, 1304 W. Pennsylvania Avenue, Urbana, IL 61801 Abstract - Hermetically-sealed flexible food packages require effective seal integrity tests for quality assurance purpose. 10-pmdiameter channel defects can propagate microorganisms into food. The channel diameter limits of human inspection are about 50 pm in transparent food packages. A reliable methodology is thus needed to detect 50-pmdiameter and smaller channels. The pulseecho Backscattered Amplitude Integral (BAI)mode imaging technique W C Trans, 4530, 19981 has been developed and demonstrated by us to 100% reliably detect 38-pmdiameter and larger channels in plastic films tested using a static stop-and-go transducer scanning pattern. In this study, we examined experimentally the spatial sampling issue of the BAImode imaging technique with a new real-time transducer scanning protocol to simulate continuous package production line motion. A focused transducer (17.3 MHz, - 6 d B pulseecho focal beam diameter of 173 pm) acquired RF data in a zigzag raster scanning pattern from plastic film samples bearing point reflectors arranged in a rectangular grid of varying spacings. The contrast-to-noise ratio (CNR) and the average BAI value difference (ABAI)between defected and background regions were assessed to quantitatively study image quality versus the varying grid size and the changing spatial scanning step sizes. For any given spatial grid size, the CNR and ABAI values degraded as scanning step size in each spatial dimension increased. When the CrBAI dropped below 5% of the maximum BAT value, the point targets could not be separated in the image.
contamination of the product. Both channel leaks and imperfect bonds could degrade package seal integrity and provide pathways for microbial penetration that could cause product spoilage. The smallest possible channel defects detectable by human observers are about 50 pm in diameter in transparent food packages. However, independent studies [ 13 have shown that certain microorganisms can transit through 10-pm-diameter channels. Therefore, effective and reliable seal integrity tests are needed to ensure the safety and shelf life of the food in hermetically-sealed flexible food packages. The pulseecho Backscattered Amplitude Integral (BAI)-mode imaging technique [2][3] has been developed and demonstrated by us to detect channels as small as 38 pm in diameter with 100% detection rate in bonded 2-layer plastic film samples (thickness 110 pm per layer) tested using a focused 17.3-MHz transducer. The acoustic image formation process is quite simple and does not require heavy computational burden. Moreover, channel defects as small as 6 pm in diameter could be detected occasionally. The quantity used to construct BAImode image is called the BAI value which, by its name, is computed by integrating the RF echo signal envelope at each transducer sampling position.
Flexible food packages are produced by hermetically fusing opposing seal surfaces to avoid post-process
In our previous studies, RF data were acquired in a static rectilinear stop-and-go transducer scanning pattern. We employed in this experimental study a real-time zigzag raster scanning pattern where the package sample moves continuously in the y direction while the focused transducer moves back and forth in the x direction. The zigzag scanning pattern requires the investigation of the spatial sampling resolution issue of the BAI-mode imaging technique. In this study, a focused transducer (17.3 MHz, -6-dB focal
0-7803-7177-1/01/$10.00 © 2001 IEEE
2001 IEEE ULTRASONICS SYMPOSIUM-729
I. INTRODUCTION
beam diameter of 173 pm) acquired RF data in a 2D zigzag raster scanning pattern from plastic film samples bearing tiny printer toner spots arranged in a rectangular grid of varying spacings. These toner spots served as point reflectors. BAI-mode images were formed with the experimental data collected by the transducer scanning system. Quantitatively, the contrast-to-noise ratio (CNR) and the average BAI value difference between defected and background regions (ABAI) were assessed to evaluate the image quality versus the changing grid sizes (distance between adjacent point reflectors) and the changing transducer spatial scanning step sizes.
11. EXPERIMENTAL SYSTEM AND DATA PROCESSING The scanning and data acquisition system (Figure 1) consists of focusing transducer (Panametrics V3 17), three-linear-axis positioning system, pulserheceiver (Panametrics 5800PR), digital oscilloscope (LeCroy 9354TM), system controller (Pentium 166MHz PC) and control software.
stored as binary data files for off-line data processing on a UNIX workstation using Matlab.
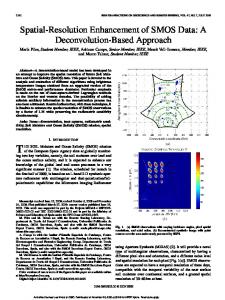
In the off-line data processing, each RF echo signal is first Hilbert transformed to get its envelope. The BAI value at each location is then obtained by integrating over the entire signal envelope. If a defect is present, the RF echo waveform will be different from that of the intact background region because the backscattered energy changes. The BAI value variation indicates potential defects. These BAI values obtained are in 2D zigzag raster pattern due to transducer scanning pattern. The BAI-mode image is constructed upon the BAI value matrix mapped at the rectilinear grid from the zigzag raster pattern by inverse distance interpolation. Figure 2 is a BAImode image example showing a 2D zigzag scanning pattern. The rectangular vertical black region at ~ 2 5 . mm 5 is a 38-pmdiameter channel defect. The circles overlaid on the zigzag raster pattern are -6-dB pulse-echo focal beam spots at each transducer scanning location. 38 u d i t e r channel defect. waterfilled
n
1
off-line procrhsing p h i tioriing
digitnl osclllc~sccYpe
receiver sample
Figure 1: Data acquisition system block diagram
The transducer, a nominal 20-MHzcenter-frequency, 6.35-mm-diameter, f/2 immersion-type spherically focused transducer, was characterized using the pulse-echo field measurement technique [4]. According to the characterization measurement, the center frequency is 17.3 MHz and the bandwidth is 7.35 MHz. The focal length is 12.4 mm and the -6dB pulse-echo focal beam diameter is 173 pm. Operating in the TransmissiodReceiving (pulseecho) mode, the transducer sends out a pulse and receives the echo signal at each location (4, yi) from the sample. The digital oscilloscope collects the RF echo waveform at 500 Msample/sec with 256 time sequence samples at each scanning location. The 3D ultrasound data set {p(,q,yi,tj):(.q,yi) E planar sample surface to be scanned, tj' [tl,tz], j=O,l,...255) are
Figure 2: 2D real-time zigzag raster scanning pattern
111. SPATIAL SAMPLING STUDY Five point-reflector samples, labeled from a through e, were made by using a 1200-DPI laser printer to print rectilinear toner dots array with different grid sizes on transparency films. The grid sizes are 848, 742, 636, 527.5, and 424 pm, respectively. The scanning area is a rectangle with 3 mm in the x direction and 2 mm in the y direction. The spatial scanning steps change in both x and y directions. The x step size is 25 pm. Changing the x step size could be simulated in off-line data processing by picking up waveforms at the desired sampling locations from the 3D data set. For instance, to simulate a 50-pm x step size and a 100-pm x step size, waveforms are picked
2001 IEEE ULTRASONICS SYMPOSIUM-730
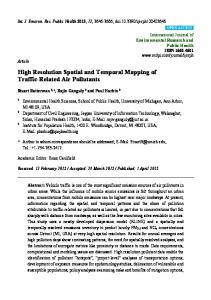
up every two and every four sampling locations, respectively. The x step sizes are chosen to be 25, 50, 75, 100, 125, 150,200,250, 300,375,500,600,750, and 1000 pm, which correspond with 120,60,40,30, 24,20, 15, 12, 10, 8, 6, 5,4,and 3 sampling points in the x direction. Figure 3 (a)-(c) illustrate the oversampling, critical-sampling and under-sampling situations in the x direction in terms of the comparison between x step size and -6-dB focal beam diameter. For each sample, y step size is set to be 200, 300,400, and 500 pm. Note that the faster the sample moves, the larger the y step size is. Figure 3 (d)-(f) demonstrates the effect of sample continuous motion on the y step size in real-time scanning. Thus, only four scans (x step size = 25 pm, y step size = 200, 300, 400, and 500 pm) are needed for each sample, which reduces data acquisition labor drastically.
Iv. RESULTS Using the zigzag-scanning pattern, twenty scans were done over the five samples with different scanning step sizes. The ABAI and CNR value curves were obtained for each sample. or&. vstepsizeoO.2mn
1(ml24 25
26
24
25
28
24
25
26
24
3
26
1.OOO mm
0.750 m m 0
0.5 1
..
x-=teRsl=e(b) &--i
(a)
IC)
1
.s 24
over-sampling
critical-sampling
Nd
Nb
pd = k z P d ,
(1)
i= I
1=1
Nb
O b
=
[$X
(Pb,
- PJ>1+
(2)
i= 1
ABAI =
Pb-pd
ma', CNR =
-.1 O b
24
25
28
"0
0.5 1 m l q b a lmn)
"0
0.5
1
ntqnbe (mn)
under-sampling
Two descriptors, ABAI and CNR, are defined to quantitatively assess the BAI-mode image quality. =$xPb,
26
Figure 4: Simulation of changing x-stepsize, y-stepsize=200 pm,grid sample-c
Figure 3: Changing the x step size [(a), (b), (c)] and changing they step size [(d), (e), (03
pb
25
1Pi 1
p b - pd max,{pi}-mini{Pi}
(3)
(4)
In (1)-(4), subscripts b and d stand for background region and defected region, respectively. Nb and Nd are the total numbers of pixels in the background and the defected regions, respectively. Image pixel value p represents the corresponding BAI value at the specific point.
Figure 4 shows an example of changing x step size. The y step size is 200 pm. The sample being scanned is c. For the over-sampling cases (x step size I 200 pm), there was no significant change in image quality according to both subjective evaluation and quantitative assessment of ABAI and CNR curves. For the under-sampling cases (x step size 2 200 pm), the image quality degraded gradually but noticeably as the x step size increased. Subjective assessment shows that when x step size was greater than twice of the -6-dB pulse-echo focal beam diameter (x step size 2 375 pm in this case), the BAI-mode image started losing the true details of sample structure. Even when the x step size was 1 mm, the transducer was still able to detect the point reflectors. The step size margin was fairly large for simple detection purposes. Overall assessment of the five samples indicated that when the ABAI dropped below 5% of the maximum BAI value, the boundary between point reflectors and background could not be identified distinctly in the image. Figure 5 shows the ABAI and CNR curves versus spatial scanning step sizes. The four curves represent the four different y step sizes. For any given spatial grid size, the CNR and ABAI values degraded as
2001 IEEE ULTRASONICS SYMPOSIUM-731
scanning step size in each spatial dimension increased as did the image quality. This observation was consistent with our previous spatial sampling study results for channel defects [ 5 ] . -tybep.3om
-+-vrbP=4om
x-stepsize (mm)
-+-I*.p”m
“0
02
0.4 0.6 x-slepsize (mrn)
0.8
mode image system is less sensitive to the variation of backscattered energy and less robust when the scanning step size becomes larger. Noticeable image quality degradation occurs after the x step size exceeds twice of the -6-dB focal beam diameter. But the step size margin is fairly large for simple detection purposes. There is a trade-off between the BAI-mode image quality and the spatial sampling step sizes of the real-time scanning pattern. Although the scanning efficiency improved, increasing scanning step sizes in both spatial dimensions sacrifices the image quality. The -6-dB focal beam diameter of the focused transducer should be considered as a major factor in determining the transducer spatial scanning step sizes.
1
Figure 5: ABM and C N R vs. spatial sampling step sizes
Figure 6 shows the ABAI and CNR curves versus the changing point-reflector grid size. ABAI and CNR values decreased as grid size reduced. But the variation of the ABAI curves was much larger than that of CNR curves. The CNR curves showed more consistent decreasing pattern than the ABAI curves did when grid size reduced. It might suggest that CNR is a more appropriate performance index for quality assessment of the BAI-mode image.
ACKNOWLEDGEMENTS
This work is supported by the C-FAR program, University of Illinois. The authors would like to thank Mr. Osama Nayfeh for his assistancewith the experiments. REFERENCES [l] C. L. Harper, B.S. Blakistone, J.B. Litchfield, and S.A. Morris, ‘Developmentsin food package integrity testing,” Food Technol., vol. 6, no. 10, pp. 336-340, 1995.
ystepsize 300 pm
[2] A. Ozguler, S. A. Morris, W. D. O’Brien, Jr., “Evaluation of defects in seal region of food packages using the backscattend amplitude integral @AI) technique,” in Proc.1997 IEEE Int. Ultrason. Symp., vol. 1, pp. 689-692. xstepsae (mm)
0
0.2
0.4 0.6 xstepsue (mm)
0.8
1
Figure 6: AI3AI & CNR curves for different grid sizes
V. CONCLUSION The spatial sampling issue of the BAI-mode imaging technique using real-time zigzag raster transducer scanning pattern was investigated. The CNR and the ABAI were assessed to evaluate the effects of changing grid sizes and transducer spatial scanning step sizes on BAI-mode image quality. The BAI-
[3] C. H M e r , Q. Tim, A. Ozguler, S. A. Moms, and W. D. O’Brien, Jr., “High contrast ultrasound images of defects in food package seals,” IEEE Trans. Ultrason., Ferroelect., Freq.Contr., vol. 47, no. 3, pp. 530-539, May 2ooo.
[4] K. Ram and W. D. OBrien, Jr., “Pulseecho field distribution measurement technique for highfkquency ultrasound sources,’’IEEE Trans. Ultrason, Ferroelect., Freq.Contr., vol. 44,No. 4, pp. 810-815, July 1997.
[5] N. N. Shah, P. K. Rooney, A. Ozguler, S. A. Moms, W. D. OBrien, Jr., “A real-time approach to detect seal defects in food packages using ultrasonic imaging,” Journal of Food Protection, vol. 64,no. 9, pp. 1392-1398,September 2001.
2001 IEEE ULTRASONICS SYMPOSIUM-732