Proceedings of the World Congress on Engineering 2013 Vol II, WCE 2013, July 3 - 5, 2013, London, U.K.
Investigations on Hierarchical Web service based on Java Technique A. Bora, M. K. Bhuyan and T. Bezboruah, Member, IAENG
Abstract —We have designed, developed and implemented a hierarchical web service using Java as programming language, apache tomcat as web server, MySQL as database server to study the performance of the web service. The web service has been tested by deploying it on Mercury Load Runner to study various attributes like load and performance of the service, scalability and reliability. In this paper, we will present in details the architecture of the service, its testing procedure and the result of different testing, performed on the service. Index Terms—Hierarchical web service, Mercury load runner, Java API, RDBMS
I. INTRODUCTION
T
HE web service (WS) is a service provider for specific business logic (BL). It is similar to the activity of remote procedure calling using client server application. Professionally a WS is designed to support interoperable machine-to-machine interaction over a network. It has an interface, described in a machine-processable format, specifically WS Description Language (WSDL). Other systems interact with the WS in a manner prescribed by its description by using Simple Object Access Protocol (SOAP) [1]. The WS can be used alone for a particular operation or may be aggregated by other WS for the enhanced flexibility in operation. The WS has potential to enhance Business to Business (B2B) collaboration by integrating compatible service to a service of higher dimension [2]. Each WS may have one or more roles, such as being a service provider, a broker or a user [3]. The WS can be invoked by a client, such as browser, mobile or other software based devices, typically who are the consumers of a WS in general. The main three platforms of WS are SOAP, WSDL and Universal Description, Discovery and Integration (UDDI). II. PROPOSED WORK
The objective of the proposed work is to design, develop, implement and test a hierarchical WS to study various attributes like load and performance of the service, scalability and its reliability. The WS has three different
A. Bora is with the Instrumentation and Informatics Research Laboratory, Department of Electronics & Communication Technology, Gauhati University, Guwahati-781014, Assam, INDIA (e-mail:
[email protected]). M. K. Bhuyan is with the Department of Electronics and Electrical Engineering, Indian Institute of Technology, Guwahati, Guwahati-781039, Assam, INDIA (e-mail:
[email protected]). T. Bezboruah is with the Department of Electronics and Communication Technology, Gauhati University, Guwahati-781014, Assam, INDIA (Tel: +91-361-2671262(O); Fax: +91-361-2700311(O); email:
[email protected]).
ISBN: 978-988-19252-8-2 ISSN: 2078-0958 (Print); ISSN: 2078-0966 (Online)
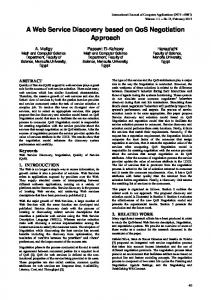
services: (i) the client service of WS, (ii) the parent WS and (iii) the child WS respectively. The communications inbetween the various services of the WS are hierarchical in nature. The Mercury LoadRunner is used to carry out the performance test on the WS. III. METHODOLOGY A prototype research WS has been developed and implemented by considering various medical advices of doctors for various diseases [4] by using Java application programming interfaces (APIs), apache tomcat and MySQL database server. The data size of the present WS is 5000. The data mapping in between disease, medicine, components, manufacturing company names and clinical remarks are prepared. The flowchart is prepared to depict the basic working principle of the WS. The testing is performed up to 600 virtual users by deploying the WS on Mercury LoadRunner. The responses of different testing are recorded. The statistical testing of the recorded data has been performed to study different aspects of the WS. IV. THE SOFTWARE ASPECTS The Java language is a natural choice for developing WS. Its strong security guarantees concurrency control and wide spread deployment in both browsers and servers makes it relatively easy to create WS. The most important features of APIs for extensible markup language (XML) are that they all support industry standards, ensuring interoperability [5]. The WS application can be developed and implemented using Java APIs with Spring framework which is ModelView-Controller Model 2 (MVC2) architecture [6] and tools provided by an integrated WS Stack called Metro. The Metro stack consisting of Java API for XML WS (JAXWS), Java Architecture for XML Binding (JAXB), and WS Interoperability Technologies (WSIT), enables any one to create and deploy secure, reliable, transactional, interoperable WS and clients [7]. Different software specifications for the proposed work are: (a) web server: Apache Tomcat version 7, (b) the database server: MySQL 5.0, (c) platform: NetBeans 7.0 IDE and (d) web browser: Mozilla Firefox. Along with these, jdk7 and jre7 is also used. The WS and its client applications have been run on a PC with hardware specifications: Intel® Pentium® Dual CPUE2200; Processor speed: @ 2.20 GHz; RAM: 1 GB and Memory space: 150 GB. The operating system is Windows XP Professional Service Pack 2. A. The architecture The architecture of the WS is shown in Fig. 1. This architecture represents three WS, which has the advantages of separation, independence and reusability. The Client WS (CWS) contains the user interface (UI) and presentation WCE 2013
Proceedings of the World Congress on Engineering 2013 Vol II, WCE 2013, July 3 - 5, 2013, London, U.K.
code. Since Java platform is used for developing the WS, it includes Java Server Pages (JSP), Hyper Text Markup Language (HTML) based form controls and server side Java class files. The HTML form controls such as form, text button, submit button and labels are provided in CWS for capturing the end user data. The role of CWS is to capture data and forward it to parent WS. The parent WS is responsible for capturing and forwarding the request from the CWS to child WS. The parent WS is also responsible for informing the CWS about the response of child WS. The child WS holds the required BL functions, validations and calculations related to the data. The parent WS acts as a mediator between the CWS and the child WS. The child WS manages the physical storage and retrieval of data. It receives the data from the parent WS and sends it to the database and vice versa. The child WS holds the database queries for performing necessary operation.
V. TESTING Mercury Load Runner version 8.1 is used for testing the CWS that invokes the parent WS. It is an automated-testing tool that helps to predict the systems' behavior and performance, before we deploy it. It stresses the system by creating virtual users, collecting the systems' performance information and then analyzing it [8]. During the experiments, a user think time of approximately 30s is incorporated in performing the transaction and an average steady-state period of 300s is set for all the experiments. We follow the various steps for the test and flowchart that are presented and discussed elsewhere [9]. The test case for select method invocation is given in Table 1 below. TABLE 1 TEST CASE FOR SELECT METHOD INVOCATION Step
Client Application
1
Step description
Expected outcome
Open URL http://localhost:8080/t 22P_Client/index.jsp
CWS index page will be displayed and contain the below fields a) “Enter keyword” text field b) “Submit” button
Parent WS 2 Child WS
Enter valid disease name and click “Submit” button
Pass the parameter to child WS through parent WS for necessary SQL Select operation and wait for the response.
a) Enter “Cold” in “Enter keyword” text field Medicine - Disease Database 3
Computer
Fig.1: The architecture for the hierarchical WS for the medical disease scenario
B. The flowchart The flowchart of the proposed work is shown in Fig.2. The flowchart clearly specifies a simple data entry page, which captured the data from a user and a submit button. On clicking the submit button, it will forward the data to the parent WS and then to child WS respectively. The response of the child WS is forwarded back to the client application through the parent WS. C. The data base planning The database used for the present WS is MySQL solution and contains relevant information about the medicine, components available, company and clinical details. The database contains 5 tables.
ISBN: 978-988-19252-8-2 ISSN: 2078-0958 (Print); ISSN: 2078-0966 (Online)
Child WS response is displayed
Response page http://localhost:8080/ t22P_Client/result.jsp is displayed with a result set containing following data a)Disease name b)Component name c)Medicine name d)Company name e)Remarks/Instruction
A. Testing parameters The parameter that we set for the testing are: (i) the think time, which defines the maximum time taken by the user in thinking before requesting a parameter, (ii) the stress level, which defines the number of virtual users accessing the application, (iii) the network speed, which specifies the bandwidth that the virtual user will use in the network. B. Test responses The measurements provided by the load and stress test which are monitored include: (a) the transaction time in seconds, (b) the throughput in bytes per second, (c) the hits per second and (d) the number of successful virtual users allowed for transaction.
WCE 2013
Proceedings of the World Congress on Engineering 2013 Vol II, WCE 2013, July 3 - 5, 2013, London, U.K. Start Client application
Homepage
Display page
Stop
Insert data in textbox
No
Is submit button clicked?
Create parent response
Yes
Read data
Parent WS
Child WS Create empty response Capture data in child WS
No Yes Is success?
Execute child method
Fig.2: Flowchart of hierarchical WS method invocation
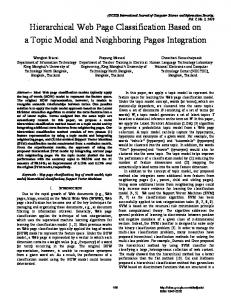
VI. EXPERIMENTAL RESULTS The testing has been carried out for 10, 20, 30, 50, 100, 150, 200, 250, 300, 350, 400, 450, 500, 600 virtual users with 128 kbps bandwidth. The entire performance tests are conducted with ramp up schedule with 1 virtual user operating every 15s. The steady-state measurement period is set at 5 min duration. Then they are phased out simultaneously after the completion of the steady-state. Some sample responses of the test are shown in Figs.3-5. Fig.3 shows the response for hits/s against number of virtual users for 150 users. It is observed that hits/s increases with the increase in virtual users. It becomes maximum at 148 virtual users and then the parameter decrease gradually. The recorded average hits/s for 150 virtual users is 0.95 with a maximum of 1.797. Fig.4 shows the response for throughput against number of users for 150 virtual users. It is observed that throughput increases with increase in virtual users. It becomes maximum at 120 virtual users and then the parameter decrease gradually. The recorded average throughput for 150 virtual users is 2189 with a maximum of 3777. Fig.5 shows the responses for transaction time against number of users for 150 virtual users. It is observed that transaction time increases with the increase in virtual users. It becomes
ISBN: 978-988-19252-8-2 ISSN: 2078-0958 (Print); ISSN: 2078-0966 (Online)
Create response with data
Stop
maximum at 144 virtual users and then the parameter decreases gradually. The recorded average transaction time for 150 virtual users is 11.234s with a maximum of 19.439s. We observed various metrics provided by the LoadRunner. The virtual user levels up to 600 are tested to force the client application in invoking the WS to work beyond its capacity. The results are given in Table 2.
VII. STATISTICAL ANALYSIS OF THE WS The statistical analysis for ten users run for 300s in steady state is presented here. The data recorded for 30 repeated tests is taken for analysis. A. Statistical analysis for the sample It is observed that the response time lies within the range 9.391s - 16.318s with mean value of 11.266s. The range for throughput lies between 230.473 bytes/s and 389.632 bytes/s with mean value of 294.718 bytes/s. The hits/s lies between a minimum values of 0.096 to maximum of 0.101 with mean value of 0.099. The recorded data for 30 samples are divided into six classes depending on their range. The class width and range for response time, hits/s and throughput are given in Table 3-5, respectively.
WCE 2013
Proceedings of the World Congress on Engineering 2013 Vol II, WCE 2013, July 3 - 5, 2013, London, U.K. TABLE 2 RESULT FOR SELECT OPERATION IN WS Scenario No. of Recorder Average users parameters
Select operation
Connection refusal in %
10
Response time,s Throughput, bytes/s Hits/s
10.698 284.681 0.101
20
Response time,s Throughput, bytes/s Hits/s
12.345 489.755 0.172
30
Response time,s Throughput, bytes/s Hits/s
12.093 635 0.241
50
Response time,s Throughput, bytes/s Hits/s
10.778 1064 0.42
100
Response time,s Throughput, bytes/s Hits/s
10.787 1404 0.71
150
Response time,s Throughput, bytes/s Hits/s
11.234 2189 0.95
21
200
Response time,s Throughput, bytes/s Hits/s
11.647 502 0.179
72
250
Response time,s Throughput, bytes/s Hits/s
300 350
400
450
500
600
14.669 2307 1.248
Fig.4: Throughput against number of users for 150 virtual users
27
Response time,s Throughput, bytes/s Hits/s
12.041 891 0.383
71
Response time,s Throughput, bytes/s Hits/s
16.224 203 0.078
82
Response time,s Throughput, bytes/s Hits/s
10.904 1355 0.681
63
Response time,s Throughput, bytes/s Hits/s
11.201 398 0.149
84
Response time,s Throughput, bytes/s Hits/s
19.48 2535 1.619
46
Response time,s Throughput, bytes/s Hits/s
13.742 67 0.023
89
Fig.5: Transaction response time against number of users for 150 virtual users TABLE 3 CLASS WIDTH AND FREQUENCY FOR RESPONSE TIME Response time (s)
Observed frequency
9.39
1
10.78
10
12.16
15
13.55
3
14.93
0
>14.93
1
TABLE 4 CLASS WIDTH AND FREQUENCY FOR HITS/S Hits/s
Observed frequency
0.096
1
0.097
3
0.098
0
0.099
9
0.1
14
0.101
3
TABLE 5 CLASS WIDTH AND FREQUENCY FOR THROUGHPUT Throughput (bytes/s)
Observed frequency
230.473
1
262.3048
9
294.1366
5
325.9684
8
357.8002
2
>357.8002
5
Fig.3: Hits/s against number of users for 150 virtual users
ISBN: 978-988-19252-8-2 ISSN: 2078-0958 (Print); ISSN: 2078-0966 (Online)
WCE 2013
Proceedings of the World Congress on Engineering 2013 Vol II, WCE 2013, July 3 - 5, 2013, London, U.K.
A. Distribution of response time, hits/s and throughput To determine the distribution of response time, hits/s and throughput, we plot histogram of the observed parameters as shown in Figs.6-8. According to the histogram, the applied distribution is normal distribution for response time. The distribution is left skewed for hits/s and is uniform for throughput.
depend on hits/s and throughput. The alternate hypothesis (H1) - response time is dependent on hits/s and throughput.
B. Confidence interval The 95% confidence interval for the mean values of response time, hits/s and throughput are calculated. We evaluate the sample size N, mean value x and confidence level based on different values of parameter obtained during load testing. The results are given Table 6. Fig.8: Histogram of throughput
N 30
Fig.6: Histogram of response time
From Table 6, we can conclude the following with 95% confidence: that mean response time lies between 11.2663 ± 0.467 that is 10.7991 and 11.7335, mean hits/s lies between 0.099 and 0.100 and mean throughput lies between 276.4197 and 313.0154.
Fig.7: Histogram of hits/s
C. Factors influencing response time A better way to see whether the relationship between response time, hits/s and throughput is linear is to perform regression analysis. The response time is assumed as response variable. Hits/s and throughput are assumed to be explanatory variable. The combined effect of throughput and hits/s on response time is examined by multiple linear regression tests. The regression test is carried out at 95% confidence level. We assumed the null hypothesis (H0) - response time does not
ISBN: 978-988-19252-8-2 ISSN: 2078-0958 (Print); ISSN: 2078-0966 (Online)
TABLE 6 MEAN, STANDARD DEVIATION AND MARGIN OF ERROR Parameters Standard Confidence deviation level
x
Response time, s Hits/s Throughput, bytes/s
11.2663 0.099366667 294.7176
1.251 0.00121 49.0025
0.467158 0.000455 18.29786
The regression analysis is carried out on Microsoft Excel. The analysis of variance shows F ratio to be 2.87 which is significant at .07. This provides evidence of existence of linear relationship between response time, hits/s and throughput. But we have weak evidence for the null hypothesis to be rejected. This implies that the equation has 95% chance of being true. The analysis also suggests that our model accounts for 11.42% variance on response time. Thus we can conclude that the hits/s and throughput have some influence on response time. D. Overall performance results and discussion The objective of our present investigation is to monitor the overall performance of hierarchical WS based on Java technique using apache tomcat web server and to predict the influence of hits/s and throughput on response time. The experimental result predicts that up to 100 virtual users the WS shows an ideal response without any refusal in connectivity with an average response time 10.787s. As we increase the number of virtual users the connection refusal error is observed. For 150 virtual users average response time is 11.234 s and 21% transactions are failed. Similarly for 500 virtual users, the average response time is 19.48s and 46% transactions are failed. A highest connection refusal is observed at 600 virtual users with 89% refusal and with average response time of 13.742s. The transaction failure at higher number of virtual users may be due to garbage collected heap because of improper release of memory in time. This may also cause the decrease of server response. The sudden rise and fall of response time, throughput and hits/s in different virtual users may be for database or may be due to not releasing or lately releasing server resources including memory for the consecutive request. It is observed that this has occurred
WCE 2013
Proceedings of the World Congress on Engineering 2013 Vol II, WCE 2013, July 3 - 5, 2013, London, U.K.
more often as we increase the number of virtual users. The histogram of response time shows linearity and normality which provides evidence for the scalability and reliability of the WS communication with large number of virtual users. However, in some plots histograms are uniform and left skewed. From the statistical analysis, it is observed that the hits/s and throughput have individual effect as well as combined effect on response time. Individually, hits/s and throughput influence approximately 4.7% and 17.02% to response time and together the effect is around 11.42%. VIII.
CONCLUSION
From the above study we can conclude that WS connection refusal increases with the increase of virtual user. The apache tomcat web server along with WS seems to be stable up to 100 virtual users, which is acceptable. The system almost gives low performance for 600 virtual users. This may be due to the collision that occurs in between request, which may increase with the increase in stress level. With the increase in virtual users, the response time increases. The throughput and hits/s also increases gradually. The statistical analysis shows that the distribution of response time is normal. The multiple regression test shows that hits/s and throughput have 11.42% combined effect on response time. From the above study, we can conclude that the WS is scalable, reliable and stable.
ISBN: 978-988-19252-8-2 ISSN: 2078-0958 (Print); ISSN: 2078-0966 (Online)
ACKNOWLEDGMENT
The authors are thankful to the All India Council of Technical Education (AICTE), Govt. of India for financial support towards the work (F. No. 8023/BOR/RID/RPS (NER)-84/2010-2011 31st March 2011). REFERENCES [1] [2]
http://www.w3.org/TR/ws-arch/ Chenthati, D., Mohanty, H., Damodaram, A.: “RDBMSforService Repository and Matchmaking”, ISMS, 2nd Int. Conf., pp. 300-305, 2011. [3] Chan, P.P.W., Lyu, M.R.: “Dynamic Web Service Composition: A New Approach in Building Reliable Web Service”, AINA, 22nd Int. Conf., pp. 20-25, 2008. [4] Drug Index, Passi Publications, India, January-March, 2012. [5] Christensen, A.S., Moller, A., Schwartzbach, M.I.: “Extending Java for high level web service construction”, ACM Trans. Program. Lang. Syst.,vol. 25, issue. 6, pp. 814-875, 2003 [6] Available at: http://www.javasamples.com/showtutorial.php?tutorialid=350 [7] Available at: http://www.oracle.com/technetwork/java/index-jsp137004.html [8] Application-testing tool: Mercury LoadRunner 8.0, Available at: http://pcquest.ciol. com/content/software/2004/104093002.asp [9] Kalita, M., Bezboruah, T.: “Investigation on performance testing and evaluation of PReWebD: a .NET technique for implementing web application”, IETSoftw., vol. 5, issue. 4, pp.357-365, 2011. [10] Levin, I., Richard, S., Rubin, D.: “Statistics for management”, Pearson education, Inc., South Asia, 2009.
WCE 2013