to a normal passenger train, making it possible to conduct ... direction and went through southern Russia from ... we had only minor stops at railway stations.
Boreal Environment Research 12: 375–396 ISSN 1239-6095 Helsinki 25 June 2007 © 2007
Ion and particle number concentrations and size distributions along the Trans-Siberian railroad Eija Vartiainen1), Markku Kulmala1), Mikael Ehn1), Anne Hirsikko1), Heikki Junninen1), Tuukka Petäjä1), Larisa Sogacheva1), Sanna Kuokka2), Risto Hillamo2), Andrey Skorokhod3), Igor Belikov3), Nikolai Elansky3) and Veli-Matti Kerminen2) Department of Physical Sciences, P.O. Box 64, FI-00014 University of Helsinki, Finland Finnish Meteorological Institute, Research and Development, P.O. Box 503, FI-00101 Helsinki, Finland 3) Obukhov Institute of Atmospheric Physics, Pyzhevsky 3, 119017 Moscow, Russia 1) 2)
Received 2 Nov. 2006, accepted 15 Mar. 2007 (Editor in charge of this article: Hanna Vehkamäki) Vartiainen, E., Kulmala, M., Ehn, M., Hirsikko, A., Junninen, H., Petäjä, T., Sogacheva, L., Kuokka, S., Hillamo, R., Skorokhod, A., Belikov, I., Elansky, N. & Kerminen, V.-M. 2007: Ion and particle number concentrations and size distributions along the Trans-Siberian railroad. Boreal Env. Res. 12: 375–396.
Aerosol concentrations and properties in Russia are not well known. There are only few studies published on aerosols in Russia. However, these aerosols can have a major effect on global climate. We measured aerosol particle and air ion number size distributions together with relevant information on meteorological conditions and atmospheric trace gas concentrations in Russia. Our purpose was to get new insight on number concentrations of aerosol particle and air ions in different parts of Russia, and to examine which sources and sinks affected the observed concentrations. During a two-week TROICA-9 expedition between 4 and 18 October 2005, we travelled on the Trans-Siberian railroad from Moscow to Vladivostok and back, conducting measurements constantly along the route. The lowest aerosol particle number concentrations, around 500 cm–3, were observed at remote sites and the highest concentrations of around 40 000 cm–3 were observed near large industrial towns. The particle number concentration correlated best with nitrogen oxide and carbon monoxide concentrations. Pollutant levels were at their highest in the vicinity of towns, even though important pollution sources such as wood burning and forest fires also existed in rural areas. Concentrations of positive and negative intermediate and large ions were of the same order of magnitude as has been observed in previous studies made in boreal forests. Concentrations of intermediate ions were often low of the order of a few ions cm–3, but their concentration increased during nucleation, rain and snowfall events. Concentrations of positive and negative cluster ions were sometimes very high, reaching values of about 5000 cm–3 in case of negative ions. We also detected exceptionally high ion production rates of up to 30 s–1 cm–3 due to 222-radon decay. Concentrations of cluster ions correlated quite well with the ion production rate but less so with the ion sink. Two particle formation events were observed, during which the particle growth rates varied between 2.4 and 11.4 nm h–1. Smaller particles grew slower than the bigger ones.
376
Introduction Aerosol particles affect the global radiation budget by scattering and absorbing solar and terrestrial radiation and by acting as cloud and ice condensation nuclei (Stott et al. 2000, Karl and Trenberth 2003, Penner et al. 2006, Yu et al. 2006). The net effect of aerosols seems to be the cooling of climate. Thus, properties of aerosol particles and processes they go through in the atmosphere are important for better understanding of global climate change and for predicting its future development. An important question at the time is how the small secondary aerosol particles are initially born in the atmosphere. Several mechanisms have been proposed to contribute to the secondary particle formation, for instance binary (Mirabel and Katz 1974) and ternary (Korhonen et al. 1999) homogeneous nucleation, kinetic nucleation (Weber et al. 1996, Lushnikov and Kulmala 2001), cluster activation (Kulmala et al. 2006, Sihto et al. 2006), and ion-induced nucleation (Yu and Turco 2000). Although the formation of new aerosol particles has been studied quite extensively, the exact contribution of each nucleation mechanism to it has remained unknown. In any way, nucleation events appear to take place practically all over the world, as summarized recently by Kulmala et al. (2004). Since Russia covers a large area of the earth (about 17 million square kilometres), aerosol particles over Russia, and especially their concentrations, sources and processes in the atmosphere, may have a major impact on global climate. So far, very few investigations on aerosol particle number concentrations and size distributions over Russia have been published. Measurements conducted during summertime in middle Siberia near Lake Baikal and the city of Novosibirsk in the beginning of 1990s showed that the total mean particle number concentration was around 10 000 cm–3 and that particle number size distributions were similar to those encountered in remote continental areas (Koutsenogii and Jaenicke 1994). The same study suggested also that gas-to-particle conversion, i.e. nucleation, was a major source of aerosol particles in Siberia. A more recent study by Zagaynov et al. (2004) found much lower particle number concentrations at Lake Baikal and the Mondy station near
Vartiainen et al. • Boreal Env. Res. Vol. 12
the border of Russia and Mongolia during the summer 2003. In their study total particle concentrations varied from tens to thousands cm–3 and were strongly affected by the wind direction. How the particle number concentrations have changed since then, and what are the spatial and seasonal distribution of particles over Siberia, is at the moment unclear. The purpose of this study was to examine the spatial variation of aerosol particle and air ion number concentration and size distribution over a broad area in Russia, and to investigate the sources and processes affecting these aerosol properties. The study was based on measurements that were part of a campaign to investigate air quality over Russia. The measurements were conducted between Moscow and Vladivostok during a two-week period in autumn 2005. We aim to determine how the particle and ion size distributions in Russia depend on the environment, local particle sources and prevailing air masses. The processes that affect particle and ion distributions and the effect of meteorological conditions are also of interest. In addition, we aim to detect and analyse the processes of air ion and new-particle formation.
Experimental TROICA-9 measurements The TROICA (TRans-Siberian Observations Into the Chemistry of the Atmosphere) expeditions started in Russia in 1995. The measurement routes during the different expeditions varied but the idea has been the same: the purpose is to make chemical, physical and meteorological measurements in Russia from a moving train. For this purpose, the Obukhov Institute of Atmospheric Physics in Russia has designed a separate laboratory carriage, in which all measurement instruments are being installed before each campaign. The carriage is then fastened to a normal passenger train, making it possible to conduct measurements in a moving train. Previous TROICA expeditions have focused on monitoring trace gas concentrations and meteorological conditions. Some details and results from these previous expeditions have been pre-
Boreal Env. Res. Vol. 12 • Air ions and aerosols over Russia
377
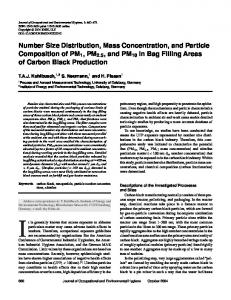
Fig. 1. Measurement route along the Trans-Siberian railroad. The total length of the route was 9242 km (one-way).
sented, for example, by Crutzen et al. (1998), Oberlander at al. (2002) and Tarasova et al. (2006). During the TROICA-9 campaign considered here, we included instruments measuring physical aerosol properties, such as the particle number size distribution and air ion mobility distribution. Fast analysis of the ionic chemical composition of the aerosol was also made, but in this paper we will focus on aerosol particle and air ion number concentrations and size distributions along the Trans-Siberian railroad. All the way, we kept electronic diaries on extraordinary events, such as forest fires and observed settlements, detected as the train passed by. The measurement route was 9242 km in one direction and went through southern Russia from Moscow to Vladivostok and back from there along the Trans-Siberian railroad (Fig. 1). The travel time was about one week in both directions, during which time the train went over seven time zones. Most of the instruments operated in the UTC time but some also in Moscow time. In both ways we had a short stop in Novosibirsk where we changed the train. Otherwise we had only minor stops at railway stations that interrupted the measurements for about 10 minutes. The measurements started at noon on 4 October when the train left Moscow. The train arrived in Vladivostok on 11 October and on the same evening it started its way back. The train arrived in Moscow on 18 October.
Differential mobility particle sizer (DMPS) We measured particle number size distributions in the size range of 3–950 nm (electrical mobility diameter of particles) using a twin-DMPS. The twin-DMPS consisted of two DMPS systems that we operated in parallel. A short HAUKEtype differential mobility analyser (DMA) (Knutson and Whitby 1975, Winklmayr et al. 2001) of 10.9 cm in length classified smaller particle sizes from 3 to 50 nm according to their electrical mobility. The particles were then detected by a TSI condensation particle counter (CPC) model 3025 (Stolzenburg and McMurry 1991). The small particle size range was divided into 20 channels plus the zero voltage channel. One particle size spectrum per each ten-minute period was obtained. A HAUKE-type differential mobility analyser of 28.5 nm in length classified the bigger 10–950 nm particles. These particles were detected with a TSI model 3010 CPC (Quant et al. 1992). The size range of bigger particles was divided into 30 + 1 channels and the measurements were simultaneous with the measurements using the shorter DMA-DMPS system. The time resolution was 10 minutes. The DMPS systems had the same 5-m-long inlet line. The head of the inlet line was at the rooftop of the carriage and four meters above the ground. Diffusion losses of particles inside the inlet line, as well as inside the instruments, were taken into
378
account in calculations. The size range of the two systems overlapped between 10 and 50 nm to ensure the similarity and quality of the measurements. The ratio between the aerosol sample and sheath flows was 0.2 in both DMPS systems, and we used a closed-loop arrangement in their sheath flows (Jokinen and Mäkelä 1997). Unfortunately, we could not add a neutralizer to the inlet of the twin-DMPS. Thus, if the measured aerosol was very young, i.e. less than two hours, it may not have been reached the equilibrium charge distribution assumed in our data inversion procedure. The smallest (< 10 nm) particles are affected most by this problem (Laakso et al. 2007). Otherwise, the particle charge equilibrium could be assumed to be valid. Air ion spectrometer (AIS) The AIS, manufactured by AIREL Ltd., Estonia, classifies air ions according to their electrical mobility (Mirme et al. 2007). The AIS consists of two cylindrically symmetrical mobility analysers, one for positive and the other for negative ions. For example, as the central electrode is biased to positive electrical potential, the positive ions, sucked into the analyser in the sample air flow (500 cm3 s–1 per analyser), move according to their size and charge (assumed single) towards the outer electrode. Simultaneously, the ions move in vertical direction along with a particle-free sheath flow (1000 cm3 s–1 per analyser). The outer electrode has 21 insulated sections and each of them have its own electrometer. Then, the electrometer current determines the concentration of certain-sized positive ions. The operation is identical in the other analyser for negative ions. The measurement of one ion mobility distribution takes five minutes. Of that time one third is consumed to measuring an offset-level, i.e. the uncertainty of the instrument. In the offset-level measurements a corona charger first charges all the incoming particles and then an electrical filter removes them. By that way the AIS measures the electrometer noise. We installed the inlet of the AIS through the carriage wall in the height of about two meters. During our campaign the AIS measured air ion mobility distributions over a mobility range of
Vartiainen et al. • Boreal Env. Res. Vol. 12
0.0013–3.16 cm2 V–1 s–1. This corresponds to a diameter range of 0.4–40 nm according to the Tammet algorithm (Tammet 1995, 1998) under normal temperature and pressure (20 °C and 1013 hPa). As a result we obtained the number mobility (and size) distribution of positive and negative ions divided into 28 mobility (and size) sections with a time resolution of five minutes. More details about the AIS and its operation can found in the papers by Laakso et al. (2004a, 2004b), Hirsikko et al. (2005) and Mirme et al. (2007). Other measurement devices in the carriage A separate laboratory carriage was equipped with instruments measuring gaseous atmospheric compounds, meteorological variables, solar radiation and navigational parameters, as well as with instrumentation for the data storage and backup. More detailed information about some of the instrumentation used is listed in Table 1. All instruments were connected via special interfaces with a single controlling computer. The special software performs data acquisition and creates a united database with 10-second intervals for all the measured parameters. The instrument working parameters (flows, pressures, voltages, etc.) were traced by software to allow for a continuous control on instrument performance and data quality. The measured variables included the concentrations of trace gases, such as O3, NO, NO2, CO, CO2, SO2, CH4 and NMHC, as well as data on the ambient pressure, temperature and humidity, solar radiation and radon concentration. A more detailed description of the radon measurements has presented by Oberlander et al. (2002). Additionally, we examined diaries from the expedition containing information on oncoming trains, forest fires, settlements, and rain or snow observations.
Results and discussions Weather patterns encountered during the measurement campaign were typical for autumn con-
Boreal Env. Res. Vol. 12 • Air ions and aerosols over Russia
379
Fig. 2. Temperature, relative humidity (RH) and solar radiation along the route from Moscow to Vladivostok (black curve) and back to Moscow (grey curve) as a function of the distance from Moscow. The dates are given in the lowest panel.
ditions across Siberia. Observed temperatures varied between –5 and 20 °C and relative humidity between 20% and 100% (Fig. 2). The maximum solar radiation, occurring around the local midday, was between 100 and 500 W m–2 (Fig. 2). Overall, weather conditions were cooler and cloudier on the return trip from Vladivostok to Moscow. Snowfall was encountered around 5700 km east of Moscow on the morning of 14 October. Aerosol particle number concentrations We calculated total aerosol particle number concentrations from the DMPS data. The “total” refers here to particles with electrical mobility
diameters in the measurement size range of the DMPS, which was between 3 and 950 nm. For a more detailed analysis of the origin of aerosol particles, we divided the particle size range into three modes: the nucleation mode (3–25 nm in particle diameter), Aitken mode (25–90 nm) and accumulation mode (90–950 nm). The division was based on earlier particle size distribution studies conducted in boreal environments (e.g. Mäkelä et al. 2000, Laakso et al. 2003). The upper limit of the DMPS system used determined the biggest diameter of the accumulation mode. The total half an hour-average aerosol particle number concentrations varied substantially along the route, ranging from about 500 to 40 000 cm–3 (Fig. 3). Increases in the population density and
Table 1. Laboratory carriage instrumentation used to measure trace gases, temperature, humidity, and radon concentrations. Equipment Manufacturer O3 1008-RS DASIBI Inc. USA NO, NO2 TE42C-TL Thermo Electron Corp. USA CO TE48S Thermo Electron Corp. USA CO2 LI6262 Li-COR Inc., USA SO2 APSA-360 Horiba Instruments Inc., Japan CH4§and NMHC APHA-360 Horiba Instruments Inc., Japan Air pressure PTA-427 sensor Vaisala, Finland Air temperature and humidity HMP-233 sensor Driesen & Kem GmbH, Germany Solar radiation CM6B pyranometer Kipp & Zonen Inc, Holland 222 Rn LLRDM Tracerlab GmbH, Germany
380
Vartiainen et al. • Boreal Env. Res. Vol. 12
Fig. 3. Half hour-average modal concentrations of aerosol particles as a function of distance from Moscow on the way to Vladivostok (black curve) and back to Moscow (grey curve). The first panel shows nucleation mode (3–25 nm in diameter) concentrations, the second panel Aitken mode (25–90 nm in diameter) concentrations, and the third panel accumulation mode (90–950 nm in diameter) concentrations. The fourth panel shows the population density (half degree resolution) and the fifth panel indicatted the largest stations (towns) along the route.
vicinity of towns as industrial pollution sources increased particle number concentrations, especially in the Aitken and accumulation modes. On the way to Vladivostok, the average total particle number concentration was 10 016 cm–3, and the average number concentrations of nucleation, Aitken and accumulation mode particle were 2381, 4477 and 3208 cm–3, respectively. On the way back to Moscow the average concentrations of Aitken and accumulation mode particles were lower (3315 and 2267 cm–3, respectively), whereas the average concentration of nucleation mode particles (2130 cm–3 on the way back to Moscow), was about the same in both directions. Within the first and last 3000 km of the journey, measured particle number concentrations on the way to Vladivostok were rather similar to those observed at the same locations during the way back to Moscow. However, for a notable part of the journey, between approximately 4000 and 7000 km from Moscow, concentrations were lower on the way back to Moscow. This pattern was most pronounced for the Aitken and accumulation mode (Fig. 3) but much less so for the nucleation mode. There may be several reasons for the observed similarities and differences, even though the origin and history of
air masses measured at any given location of the train have probably played a chief role. Air masses travelled for some time over land, and especially over populated areas, are expected to have more aerosol particles as compared with air masses encountered just after a precipitation event. The low particle number concentrations on the way back coincided, for instance, with cool and cloudy weather and precipitation, both rain and snow, on days 14–15 October (Fig. 2). For a detailed analysis of particle number concentrations, we divided the trail route into five distinct areas according to their population density and level of pollution (NO and CO) measured. The population densities were calculated with a resolution of 0.5° from the population density data of the year 2005 (Center for International Earth Science Information Network (CIESIN), Columbia University; and Centro Internacional de Agricultura Tropical (CIAT). 2005. Gridded Population of the World Version 3 (GPWv3): Population Density Grids. Palisades, NY: Socioeconomic Data and Applications Center (SEDAC), Columbia University. Available at: http://sedac.ciesin.columbia.edu/gpw). The areas were defined as clean rural background (population density < 3 km–2, [NO] < 0.5 ppb
Boreal Env. Res. Vol. 12 • Air ions and aerosols over Russia
and [CO] < 0.3 ppm), polluted rural background (population density < 3 km–2, [NO] > 0.5 ppb and [CO] > 0.3 ppm), sparsely-populated area (population density < 10 km–2), densely-populated area (population density < 100 km–2), and town or industrial area (population density > 100 km–2). By applying this division, the train spent 14% of the measurement time in clean rural background areas, 15% in polluted rural background areas, 36% in sparsely-populated areas, 27% in densely-populated areas and 8% in town areas. For each of these areas, we calculated the following modal parameters: the average particle concentration and its standard deviation, as well as the median and 5% and 95% percentiles of the particle number concentration. As one might expect, high particle number concentrations were measured when the train passed through the vicinity of a town or city, whereas the lowest number concentrations were observed in clean rural areas (Table 2). In rural areas, the contribution of the accumulation mode to the total particle number concentration was relatively high. Particle number concentrations in the nucleation mode and especially in the Aitken mode increased clearly with increasing population density (Table 2 and Fig. 4). In town areas, the average total particle number concentration was 14 040 cm–3 with a maximum (95% percentile) as high as 43 540 cm–3, and the aver-
381
age particle number concentration in the Aitken mode was roughly twice that in the nucleation and accumulation mode. Thus, particles near towns were mostly due to local traffic or industrial-related sources. The average particle number concentration in clean rural areas was 4344 cm–3 with a minimum (5% percentile) of only 382 cm–3. In polluted rural areas the average concentration was 8362 cm–3, and the highest modal average concentration was detected in the accumulation mode containing mainly longrange transported particles. We may conclude that long-range transport can clearly increase particle number concentrations in areas with few people and minor local anthropogenic sources. The average total particle number concentration was of the order of 8000 cm–3 or even higher well outside the towns and industrial settings in polluted rural and sparsely-populated areas. This is indicative of long-range particle transport and local sources like grass or wood burning for heating dwellings. Increased population densities increased always average particle number concentrations, such that in densely-populated areas the average particle concentration was as high as 11 416 cm–3. In the lower troposphere of Antarctica, probably one of the cleanest environments on Earth today, total particle number concentrations have been observed to vary between about 200 and
Table 2. Averages, standard deviations (SD), medians, and 5% and 95% percentiles of particle number concentrations (cm–3) calculated for particle size ranges 3–25 nm, 25–90 nm, and 90–950 nm at different background areas. Size range Rural clean Rural Sparsely polluted populated Average (SD) Median 5% percentile 95% percentile
3–950 nm 3–25 nm 25–90 nm 90–950 nm 3–950 nm 3–25 nm 25–90 nm 90–950 nm 3–950 nm 3–25 nm 25–90 nm 90–950 nm 3–950 nm 3–25 nm 25–90 nm 90–950 nm
04344 (5148) 01276 (2004) 01894 (3108) 01199 (2148) 02586 00617 00911 00733 00382 00043 00135 00107 13462 03921 06548 03788
08362 (8722) 02269 (6739) 03002 (3263) 03136 (3048) 05861 00654 01916 02265 00936 00033 00328 00163 24444 09767 09184 10207
07820 (7323) 02218 (3392) 03303 (3877) 02345 (2120) 05718 01031 02105 01934 00861 00124 00178 00099 22068 08395 09833 06139
Densely Town area populated 11416 (11103) 02378 (4663) 05448 (6565) 03650 (2795) 07603 01234 03104 03121 02121 00114 00645 00824 29137 07009 17661 08740
14040 (13072) 03698 (4803) 06705 (8388) 03643 (3174) 10766 02089 04526 02774 01459 00207 00491 00203 43540 11313 21101 09609
382
Vartiainen et al. • Boreal Env. Res. Vol. 12
Fig. 4. Median particle number size distributions measured in the five different areas (rural clean, rural polluted, sparsely populated, densely populated, and town areas) along the train route.
2000 cm–3 during summer depending on the air mass origin (Koponen et al. 2003). In the remote marine boundary layer, particle number concentrations are usually a few hundreds cm–3 (Heintzenberg et al. 2000). The observed particle number concentrations minima along the Siberian boreal forest and steppe transect (about 500 cm–3) are within these ranges and can be considered as representatives of clean air. The overall average particle number concentration of about 10 000 cm–3 measured here is comparable to concentrations observed in a boreal forest when it has been exposed to polluted air masses (Mäkelä et al. 2000), or to concentrations observed in towns and small cities. The study by Aalto et al. (2005) showed that the annual-mean total particle number concentrations in Helsinki, Stockholm and Augsburg were around 10 000 cm–3, whereas in southern and bigger European towns (Barcelona and Rome) the corresponding concentrations were around 40 000 cm–3. The seasonal variability of the total particle number concentrations was significant in all these five cities, with lowest concentrations observed during the summer (Aalto et al. 2005). Since most of the towns next to the trans-Siberian railroad are middle-sized with a population below one million (Fig. 2), the near-town particle number concentrations observed there were of the same order, or a bit higher, as those detected earlier in similar environments. The highest observed concentrations of about 40 000 cm–3 are comparable
to those measured in large cities such as Barcelona and Rome. However, the measured particle number concentrations were much lower than those observed in mega cites, like concentrations as high as 250 000 cm–3 detected in New Delhi, India (Mönkkönen et al. 2005). As discussed above, the origin and history of air masses affect particle number concentrations as well. In order to analyze the source and transport pathways of the arriving air masses, we calculated 96-hour air mass back trajectories arriving at the 100-m height along the railroad four times per day using the HYSPLIT-4 model, developed by NOAA/ARL (Draxler and Hess 1998). The HYSPLIT-4 is a single particle lagrangian trajectory dispersion model. We made model runs using Global FNL meteorological archive with the spatial resolution of 190 ¥ 190 km. On the way from Moscow to Vladivostok (Fig. 5), a southern and eastern air-mass transport from the industrial and densely-populated central Russian regions prevailed on 4 and 5 October. During the afternoon on 5 October, colder and dryer polar air-masses came more from northern parts of Russia. Between 6 and 8 October, air masses originating from over the western Siberia plain went first toward south and from there later on back toward the measurement areas in north. On 8 October air masses from over northern Mongolia uplands brought warm and dry air to our measurement location. Western and northern transport prevailed from the evening of 8
Boreal Env. Res. Vol. 12 • Air ions and aerosols over Russia
October until 9 October. On 9 and 10 October, measured air masses had passed through northern China. On the way back to Moscow warmer and moister air masses from China arrived at our measurement location during 11 and 12 October (Fig. 5). Later on, the western transport of air masses along the railroad was observed. These air masses came partly from the northern Kazakh stan region. On 17 and 18 October air masses came from the central Russia. Back trajectories indicate the main properties of the air mass such as its temperature and humidity. To some extent, trajectories reveal what has been transported form the point of air mass origin and from the areas along the trajectory path. The trajectories do not, however, indicate the weather as a whole. Although some synoptic patterns can be identified from trajectories, they do not give any information about cloudiness or radiation. Air masses influence mainly the concentrations of accumulation mode particles, whereas concentrations of smaller particles are more dependent on local weather and emissions. The air masses form central and southern part of eastern Europe came from areas with a high population density and industrial activity, containing thereby a relatively lot of pollution. Also the area around Ural is highly industrial. Northern Kazakhstan has some mining industry but otherwise the area is quite poor steppe zone
Fig. 6. Concentration of NO + NO2 (top panel), CO (middle panel), and SO2 (bottom panel) as a function of distance from Moscow on the way to Vladivostok (black curve) and back (grey curve).
383
Fig. 5. Air mass back trajectories on the way from Moscow to Vladivostok (top panel) and from Vladivostok to Moscow (bottom panel). Each trajectory is calculated such that its arrival time (UTC) to the measurement spot equals that of the train.
with some vegetation. The air masses arriving from northern Kazakhstan, however, went trough western Siberia with some highly-populated areas. The central and eastern Siberia are sparsely-populated areas with minor industrial activities. The back trajectories, together with measured concentrations of trace gases indicative of combustion processes (NO, NO2, CO and SO2, Fig. 6) allow us also to investigate the origin of aerosol particles. Concentrations of trace gases depended not only on local pollution sources
384
Vartiainen et al. • Boreal Env. Res. Vol. 12
Fig. 7. Half an hour-average concentrations of total particles, nucleation mode particles, Aitken mode particles and accumulation mode particles as a function of NOx (sum of NO and NO2) concentration.
but also on the origin and history of measured air masses. As compared with the variations in aerosol particle modal concentrations (Fig. 3), the variations in concentrations of the other pollutants seemed to have many similarities. The concentrations of Aitken and accumulation mode particles correlated best with the concentrations of NO and NO2 (Fig. 7), and also with the CO concentration that was lowest between 4000 and 7000 km on the way back to Moscow and highest in the vicinity of big towns (Fig. 6). As both CO and NOx originate from the process of biomass and fossil fuel burning, this correlation was expected. Analysis of CO concentrations together with diary markings showed the effect of grass burning on particle number concentrations. Between 6000 and 8000 km from Moscow to Vladivostok, there were a few occasions when the CO concentration increased. Simultaneous diary markings confirmed the existence of grass burning. CO concentrations have been shown to correlate well with boreal forest fires which increase especially accumulation mode particle number concentrations (e.g. Wotawa et al. 2001). The high accumulation mode particle number concentrations in rural polluted areas can therefore be partly explained by grass burning. On the way back to Moscow there were not as many forest fires around. As a result, particle number concentrations were affected to larger extent
by clean air masses than by local sources. Near Vladivostok when air masses came from China, particle number concentrations were high due to both long-range transportation and local sources, including towns with increased population. The main source of SO2 is combustion of sulphur containing fuels in power plants and factories. As a result, the SO2 concentration follows frequently the NOx concentration. The correlation of the SO2 concentration with aerosol particle number concentration was, however, not as clear as with the NOx and CO concentration. Air ion number concentrations and distributions We divided the positive and negative air ions into three size groups: cluster ions (0.4–1.8 nm), intermediate ions (1.8–7.5 nm) and large ions (7.5–40 nm). A similar division had been applied earlier by e.g. Hõrrak et al. (2000, 2003) and it was based on different quantities and behaviour of ions of certain size. We used 1.8 nm as the maximum cluster ion size to consider all cluster ions in our analysis, since the maximum size depends on the charge polarity, time of the year and measurement site. Hõrrak et al. (2000, 2003) used 1.6 nm as the maximum cluster ion size. The half-hour average number concentrations of positive cluster ions varied between
Boreal Env. Res. Vol. 12 • Air ions and aerosols over Russia
385
Fig. 8. Half an hour-average concentration of positive cluster ions (top panel), intermediate ions (middle panel) and large ions (bottom panel) as a function of distance from Moscow on the way to Vladivostok (black curve) and back to Moscow (grey curve).
100 and 2000 cm–3, intermediate ions between 2 and 500 cm–3, and large ions between 30 and 8000 cm–3 (Fig. 8). The average number concentration of positive cluster ions was 689 cm–3 on the way to Vladivostok and 453 cm–3 on the way back to Moscow. Concentrations of positive intermediate ions varied between 6 and 150 cm–3 and large ions between 242 and 3098 cm–3 on the way to Vladivostok, and on the way back to Moscow they varied between 5 and 156 cm–3 (intermediate ions) and 78 and 2994 cm–3 (large ions). Thus, the average concentrations of allsize positive ions were slightly lower on the way back, the difference being most pronounced for cluster ions. The spatial and temporal patterns of negative ions were in general similar to positive ions but their absolute concentrations were different. The half-hour average number concentrations of negative ions varied between 200 and 5000 cm–3 (cluster ions), 1 and 1000 cm–3 (intermediate ions), and 80 and 8000 cm–3 (large ions). We observed substantially higher number concentrations of negative cluster ions as compared with those of positive ones: the average negative cluster ion concentration on the way to Vladivostok was 1422 cm–3 and on the way back 1156 cm–3. The number concentrations of negative and positive cluster ions correlated well with each other (R2 = 0.72), but there were on average 2.2 times more negative cluster ions than positive ones (Fig. 9). The average concentrations of
negative intermediate ions were similar to positive ones, whereas the average concentrations of large negative ions were slightly smaller than those of large positive ions. The concentration of positive ions did not show as clear dependence on human population as did aerosol particles (Fig. 10). As one might expect, the concentration of large positive ions increased with increasing population density. Intermediate ion concentrations did not show any systematic dependence in this regard, whereas the number concentrations of negative cluster ions decreased with increasing population density being highest in rural areas (Fig. 11). An explanation for this could be the enhanced coagulation of cluster ions with larger particles at higher particle number concentrations. Since the coagu-
Fig. 9. Negative cluster ion concentrations as a function of positive cluster ion concentration.
386
Vartiainen et al. • Boreal Env. Res. Vol. 12
Fig. 10. Median positive ion mobility size distributions measured in the five different areas.
Fig. 11. Median negative ion mobility size distributions measured in the five different areas.
lation efficiency is more affected by the accumulation mode than by the Aitken mode, cluster ion concentrations should be highest in clean rural background areas where the accumulation mode is usually weakest. Thus, in addition to a smaller sink, another contributing factor might be a higher ion source rate. Although the concentration of positive cluster ions did not show a clear negative correlation with the population density, the maximum positive cluster ions concentrations (1535 cm–3, 95% percentile) was detected in a rural area (Table 3). The maximum negative cluster ion concentration (3975 cm–3) was detected also in a rural polluted area (Table 4).
The ion number concentrations measured here were similar to those observed in a boreal forest field site in Hyytiälä, Finland (Hirsikko et al. 2005). In Hyytiälä, the highest monthly-mean cluster ion concentrations occurred typically in autumn because of the highest ion production at time of the year (Hirsikko et al. 2007a). Since our measurements were conducted in October, the observed cluster ion concentrations could have been higher than the respective annual-mean ion concentrations, provided that the annual variation was similar to that observed in Hyytiälä. Concentrations of intermediate and large ions, both positive and negative, had a similar
Table 3. Averages, standard deviations (SD), medians, and 5% and 95% percentiles of positive ion number concentrations (cm–3) calculated for ion size ranges 0.4–1.8 nm (cluster ions), 1.8–7.5 nm (intermediate ions), and 7.5–40 nm (large ions) at different background areas. Size range Rural clean Rural Sparsely polluted populated
Densely Town area populated
Average (SD) Median 5% percentile 95% percentile
1814 (1506) 0524 (297) 0044 (78) 1217 (1399) 1462 490 27 843 434 132 6 145 4226 1025 127 3349
0.4–40 nm 0.4–1.8 nm 1.8–7.5 nm 7.5–40 nm 0.4–40 nm 0.4–1.8 nm 1.8–7.5 nm 7.5–40 nm 0.4–40 nm 0.4–1.8 nm 1.8–7.5 nm 7.5–40 nm 0.4–40 nm 0.4–1.8 nm 1.8–7.5 nm 7.5–40 nm
1143 (810) 0529 (308) 0038 (67) 0566 (711) 947 465 20 379 392 226 3 66 2514 949 116 1509
1997 (1475) 0666 (384) 0065 (136) 1236 (1315) 1732 581 31 885 691 219 8 273 3979 1535 207 3246
1689 (1209) 0601 (415) 0051 (72) 0967 (1049) 1333 486 29 635 402 149 6 103 3836 1456 175 2915
2060 (1669) 0544 (328) 0057 (131) 1426 (1560) 1783 477 34 1125 401 167 6 185 4331 1082 150 3574
Boreal Env. Res. Vol. 12 • Air ions and aerosols over Russia
spatial behaviour in both directions. Large ion concentrations followed mainly the pattern of nucleation mode particle number concentrations. In contrast, cluster ion concentrations measured at the same location differed notably between the way to Vladivostok and the way back to Moscow. It is well known that ion concentrations depend on their sources and sinks (e.g. Israël 1970, Tammet et al. 2006). This will be returned to later in the paper. Ratio between positive and negative ion concentrations Negative cluster ions were greater in number as compared with positive cluster ions (Fig. 9). The same feature has been observed by Hirsikko et al. (2005). The ratio between positive and negative cluster ions during our measurements varied between 0.2 and 1 (Fig. 12). This ratio seemed to be higher when the coagulation sink of 1 nm particles was higher, i.e. when the background aerosol number concentration was higher. Negative cluster ions are on average smaller than positive ones, so they coagulate more rapidly with larger background particles. As a result, the relative abundance of positive cluster ions is expected to be larger when background particle number con-
387
centrations are higher (larger coagulation sink). The ratio between positive and negative intermediate ions, like the ratio between positive and negative large ions, was mainly in the range 1–5, decreasing rarely below one and reaching a couple of times values of around 10 (Fig. 12). Again, the ratio between positive and negative ions, especially in case of large ions, appeared to correlate with the coagulation sink, and thus with the background aerosol particle number concentration. When the ratio was clearly above one, the charged particles were probably newly formed and came directly from a source that emitted more positively than negatively charged particles. For example nucleation produces more negative intermediate ions than positive ones (Hirsikko et al. 2007b), which will also be noticed later in this paper. Ion production rate In the lower troposphere, the charging of aerosol particles is mostly due to the ionisation of air molecules by cosmic and γ-radiation, which are the main components of external radiation, and by the decay process of radon (Israël 1970). γ-radiation and radon are emitted from the soil. Hirsikko et al. (2007a) observed that ion pro-
Table 4. Averages, standard deviations (SD), medians, and 5% and 95% percentiles of negative ion number concentrations (cm–3) calculated for ion size ranges 0.4–1.8 nm (cluster ions), 1.8–7.5 nm (intermediate ions), and 7.5–40 nm (large ions) at different background areas. Size range Rural clean Rural Sparsely polluted populated
Densely Town area populated
Average (SD) Median 5% percentile 95% percentile
2222 (1638) 1079 (809) 0044 (97) 1074 (1400) 1872 0905 0022 0706 0697 0281 0002 0122 4976 2431 0154 3205
0.4–40 nm 0.4–1.8 nm 1.8–7.5 nm 7.5–40 nm 0.4–40 nm 0.4–1.8 nm 1.8–7.5 nm 7.5–40 nm 0.4–40 nm 0.4–1.8 nm 1.8–7.5 nm 7.5–40 nm 0.4–40 nm 0.4–1.8 nm 1.8–7.5 nm 7.5–40 nm
1992 (1127) 1442 (879) 0060 (193) 0482 (587) 1709 1220 0016 0333 0864 0618 0001 0079 3997 2908 00239 1284
2551 (1697) 1579 (1114) 0057 (126) 0896 (1242) 2177 1231 0015 0537 0907 0459 0001 0102 5294 3975 0248 2556
2260 (1327) 1349 (938) 0063 (116) 0832 (897) 1872 1103 0024 0547 0799 0391 0003 0099 4965 3521 0256 2502
2403 (1573) 1044 (725) 0054 (149) 1277 (1390) 2070 0837 0026 0897 0629 0246 0004 0185 4764 2566 0150 3795
388
Vartiainen et al. • Boreal Env. Res. Vol. 12
Fig. 12. Concentration ratio between positive tand negative cluster ions (first panel), intermediate ions (second panel) and large ions (third panel) as a function of distance from Moscow on the way to Vladivostok (black curve) and back to Moscow (grey curve). Condensation and coagulation sinks for 1-nm particles are shown in the bottom panel.
duction by external radiation is constant over a diurnal scale and has a seasonal variation due to changes in γ-radiation from the ground. The soil uranium and water contents along with the snow cover determine the amount of groundbased γ-radiation. Although the soil properties, both material and water content, changed during the way from Moscow to Vladivostok, we may assume that this variation was small as compared with the observed variability in the radon concentration. We calculated the production of ion pairs based on the concentrations of 222Rn and its short-lived progeny. We assumed that the average energy needed to form an ion pair was 34 eV and that the total ionisation energy was due to three alpha particles and two beta particles. Also, we assumed the γ-radiation from radon decay to be minor. The calculated ion pair production rate from 222Rn concentration was between 0.1 and 30 cm–3 s–1. This can be compared with the maximum ion production rate due to radon in Hyytiälä which was approximately 6.5 cm–3 s–1 (Hirsikko et al. 2007a). Based on our results, the ion production from radon correlated with both positive and negative
cluster ion concentrations in Siberia (Figs. 13 and 14). A better correlation was detected with positive cluster ions (R2 = 0.51, Fig. 14) than with negative cluster ions (R2 = 0.30). The maximum concentrations (6000 cm–3 for negative cluster ions and 3000 cm–3 for positive ions) were measured when the ion production was at its maximum (30 ion pairs cm–3 s–1). The correlation was weak (e.g. measurement days 286–289) when the ion pair production rate due to radon decay was small. The snow cover and also the rainfall probably decreased the amount of radon between days 286 and 289. In addition, we compared the correlation between the cluster ion concentrations and condensation sink. The condensation sink, which depends on the background aerosol number size distribution, describes how rapidly the background aerosol particles consume condensable vapours (e.g. Kulmala et al. 2001). Concentrations of negative cluster ions did not clearly correlate with the condensation sink (R2 = 0.01 and 0.00 for positive and negative cluster ions respectively), even though all periods of high cluster ion concentrations were observed at relatively low values of condensation sink (Figs. 12 and 13).
Boreal Env. Res. Vol. 12 • Air ions and aerosols over Russia
389
Fig. 13. Half an hour-average concentration of positive and negative cluster ions and ion pair production rate by 222Rn as a function of solar time (day of the year) and distance from Moscow.
Ion mobility distributions during rain and snowfall During our measurement campaign, it was snowing between 00:00 and 06:00 UTC (05:00–11:00 local time) on 14 October, and during some periods snowing turned into rain (Fig. 15). We observed a clear increase in the number concentration of especially negative intermediate ions during precipitation (Figs. 15 and 16), which is similar to what was detected at a boreal forest site in Hyytiälä (Hõrrak et al. 2005a, 2005b, 2006, Hirsikko et al. 2007b). For periods of rain, this feature is mainly due to the formation of charged droplets (Hõrrak et al. 2005a, 2005b, 2006, Hirsikko et al. 2007b and references therein). These charged droplets can, by consecutive Rayleigh explosions and evaporation, shrink further into intermediate ions. Ions can also be evaporated directly from charged raindrops. By contrast, the formation mechanism of intermediate ions during a snowfall is not yet understood. Contrary to our observations, Hirsikko et al. (2007b) did not observe a clear difference in the existence or in the polarity of intermediate ions during snowfall. Since we had only the diary markings and not any precipitation measurements, we could not be sure about when the precipitation ended. Thus, we plotted examples on ion distributions during rain and snowfall just after the markings were maid. They indicate also increases in the
Fig. 14. Concentrations of positive cluster ions as a function of ion pair production by 222Rn.
intermediate ion sizes and this effect is detectable best for negative ions (Fig. 17). Nucleation and growth We fitted log-normal modes to both aerosol particle and negative air ion size distributions in order to calculate the formation and growth rates of new aerosol particles. We separated the growing aerosol mode from other stationary modes by fitting a multi-lognormal distribution function to aerosol size distributions. The fitting error was minimized using a sequential quadratic programming method provided by Matlabs’ (ver. 7.0) optimization toolbox (ver. 3.0). The fitting error that we used was weighted root mean square
390
Vartiainen et al. • Boreal Env. Res. Vol. 12
Fig. 15. Positive (top panel) and negative (bottom panel) air ion number size distributions on 14 October. Periods of rain and snowfall are indicated in the picture with arrows.
Fig. 16. The ratio between positive and negative ions (colour scale) as a function of time (x-axis) and ion diameter (y-axis) on 14 October. White areas are due to zero ion concentrations which lead to unrealistic ratios.
error (RMSE) given by
,
where n is the number of data points and ŷi and yi are the predicted and observed values at point i, respectively. The factor wi depends on the difference between the predicted and observed values:
.
We then obtained the growth rate by a linear fit of geometric mean diameter of the growing mode. Uncertainties of the fit were evaluated using the bootstrapping method by leaving out randomly one fifth of the data and making 100 repetitive fittings. We obtained lower growth rates for smaller particles as compared with bigger particles (Table 5). On 10 October when the particle formation occurred after 03:30 UTC time (around 09:30 local time), we fitted three straight lines
Boreal Env. Res. Vol. 12 • Air ions and aerosols over Russia
391
Fig. 17. Example ion size distributions during snowfall (top panel) and rain (bottom panel) on 14 October. Error bars show the standard deviations resulting from instrument noise.
to negative ion size distribution data and one straight line to DMPS data (Fig. 18). The growth rate of 1.5–3.3 nm diameter negative ions was 2.4 ± 0.1 nm h–1, whereas the growth of larger ions (4.1–9.8 nm) was notably higher, being 11.4 ± 0.7 nm h–1 (Table 5). The condensation sink at the time of the event was around 0.01 s–1 (Fig. 12). The negative intermediate ions during the event were greater in number as compared with positive intermediate ions (Fig. 19). About two hours after the beginning of the event, the particle growth rate started to decrease and was about 4.4 ± 2.4 nm h–1 for particles in the diameter range 10.5–13.0 nm. The decrease in the growth rate was probably due to a change in the air mass type, as the train had already moved almost 200 km from the place we originally observed the event. Also, the line fitted to the particle size distribution data in the diameter range 8.3–17.6 nm indicated a growth rate of only 3.1 ± 0.2 nm h–1.
Fig. 18. Negative air ion (upper panel) and aerosol particle (lower panel) number size distributions as a function of time on 10 October. The white line in the figure is the fitting of the linear particle growth rate.
Table 5. Growth rates (GR) of different-size nucleated particles calculated from the DMPS and AIS (negative ions) data on 8 and 10 October. Date Instrument Size range (nm) Time window (UTC) 08 Oct. DMPS 10 Oct. DMPS 08 Oct. AIS(–) 10 Oct. AIS(–) 10 Oct. AIS(–) 10 Oct. AIS(–)
04.7–14.3 08.3–17.6 10.2–25.6 1.5–3.3 4.1–9.8 10.5–13.0
04:42–07:33 03:31–06:04 05:00–07:10 02:35–03:20 03:24–03:55 03:59–04:20
GR (nm h–1) 02.3 ± 0.2 03.1 ± 0.2 04.2 ± 0.3 02.4 ± 0.1 11.4 ± 0.7 04.4 ± 2.4
392
Vartiainen et al. • Boreal Env. Res. Vol. 12
Fig. 19. The ratio between positive and negative ions (colour scale) as a function of time (x-axis) and ion diameter (y-axis) on 10 October. White areas are due to zero ion concentrations which lead to unrealistic ratios.
According to the DMPS data, the growth rate of 4.7–14.3 nm particles was 2.3 ± 0.2 nm h–1 when the event started after 05:00 UTC (local time at 10:00) on 8 October (Table 1). The growth rate calculated from the negative ion size distribution data gave a similar value, being 4.2 ± 0.3 nm h–1 in the size range of 10.2–25.6 nm. The condensation sink around the time of the event was of the order of 0.01 s–1 (Fig. 12). The obtained growth rates were comparable to those detected earlier at similar aerosol concentrations. The background aerosol concentration (described by the condensation sink) affects particle growth rates because the higher the condensation sink is, the faster the growth must be to make newly-formed particles detectable (e.g. Kulmala et al. 2005). There were cases when intermediate (1.8–7.5 nm in diameter) ions were present but they did not grow further towards larger sizes, or their growth was so unclear that we could not analyse the event in detail. However, our results demonstrate that nucleation increases aerosol particle number concentrations over boreal forested regions in Russia. Comparisons between instruments for quality insurance As mentioned, the size distributions measured by
the two DMPS systems overlapped between 10 and 50 nm to ensure the quality of the measurement. We could also compare the results from the two DMPS systems with those from the AIS. This is because we did not have a neutralizer before the DMPS, so both the instruments measured the same quantity: the size distribution of negative ions. The comparisons showed that the AIS detected more negative ions in the size range of 10–40 nm than the two DMPS systems, but that the concentrations varied in a similar way (Fig. 20). The DMPS systems detected, on average, half as many negative ions than did the AIS. The difference was slightly larger for smaller particle sizes and also when concentrations were lower. In contrast, the two DMPS systems gave very similar results for negative ions in terms of their number concentration level and its variability. There are several possible explanations for the observed concentration differences. First of all, we believe that it is unrealistic to assume that two separate instruments would be able to give exactly the same result. There are differences in the way instruments detect the particles. The flow rate of the AIS is much higher than that of the DMPS, which should decrease diffusion losses. On the other hand, the AIS is a relatively new instrument and its operation is yet not fully known. More comparisons between the AIS and
Boreal Env. Res. Vol. 12 • Air ions and aerosols over Russia
other ion detecting instruments should be made. For example, the fact that differences between the AIS and DMPS increased with decreasing size and concentration of ions indicates that the AIS detects some background, even though the error based on noises in currents of different channels was small (Fig. 17). In addition, the DMPS and AIS had separate inlets in our measurements. The inlet of the DMPS was at the roof of the carriage, whereas the inlet of the AIS was located just after the wall of the carriage at about 2 meters above the ground. The DMPS inlet was notably longer and thus it is also possible that we underestimated losses in the inlet line, even though these losses were theoretically calculated. In spite of this, the variability in concentration levels was very similar between the AIS and DMPS systems.
Summary and conclusions We measured aerosol particle and air ion number size distributions, together with meteorological conditions and trace gas concentrations, on the Trans-Siberian railroad, Russia, in October 2005. Both very clean and polluted conditions were observed, with total particle number concentrations varying between 500 and 40 000 cm–3. Particle number concentrations, especially in the Aitken mode, were the highest in densely-populated areas where the concentrations of other pollutants, such as nitrogen oxide and carbon monoxide, reached their maximum values as well. Particle number concentrations were occasionally increased over rural areas where particle sources included e.g. wood burning and forest fires. The lowest observed particle number concentrations were detected at clean rural areas in the central and eastern parts of Siberia when no local sources, such as forest fires, existed. The active season of vegetation was already over in Siberia and therefore biogenic emissions can be assumed to be small. Polar and tropical continental air masses from the western direction prevailed during our measurements. Long-range transportation affected mainly the accumulation mode, in addition to which particle number concentrations were affected to some extent by local weather conditions on the ground. High
393
Fig. 20. Number concentrations of negative ions on 7 October as measured with DMPS1, AIS and DMPS2.
wind speeds are normal to autumn in Siberia when cold polar and warmer tropical air masses confront. In autumn, precipitation is also more common than in other seasons, which may increase the deposition of particles. However, since both the position of the train and measured air masses changed continuously, we cannot draw a firm conclusion on how air masses influenced measured particle number concentrations. We believe that the local sources, settlements and industry along the railroad had the biggest effect on observed particle concentrations. The train itself can also act as a source of pollution. However, the influence of train pollution was probably minor because the whole railroad was electrified and the measurements were made in the first carriage that was located just after the locomotive. The concentrations of cluster ions varied between about 100 and 5000 cm–3, and the concentrations of negative cluster ions were typically 1–5 times higher than those of positive ions. The extremely high cluster ion concentrations observed occasionally were ascribed to the presence of strong ion sources. External radiation and radon decay are the sources of cluster ions, whereas background particles act as an ion sink. We calculated the ion pair production rate based on 222Rn and its short lived progenies and noticed that it correlated with the concentration of both positive and negative cluster ions. We observed also that the cluster ion source rate caused by 222 Rn was very high, reaching values of up to 30 s–1 cm–3. These are clearly higher rates than those observed previously e.g. in Hyytiälä, Finland.
394
During periods of nucleation, rain or snowfall, concentrations of intermediate ions increased and these ions were more positively than negatively charged. Ion concentrations were affected mostly by the local weather and ion sources. Altogether, ion concentrations and ratios in Russia had many similarities to concentrations reported previously for other sites. However, the concentrations of cluster ions were sometimes extraordinarily high. When the ion source was strong, the cluster ion concentration followed the changes in the ion source term while the ion sink seemed to have a smaller effect. This is because the relative changes in the magnitude of the sink term were small as compared with corresponding changes in the source term. In contrast, Hirsikko et al. (2007a) observed that in Hyytiälä, Finland, the ion sink caused by aerosols influenced ion concentration more than did ion sources. What the potential effect of the local electric field in the train was on measured ion concentrations remain uncertain. Finally, we analysed two particle formation events observed on 8 and 10 October. We found that the smallest (< 3 nm) particles grew slower than larger particles. On 10 October we had some inconsistency between the growth rates detected by DMPS and AIS. This may have been due to our calculation procedure, because we selected slightly different size ranges from the DMPS and AIS data for our analysis. Differences between the AIS and DMPS were, however, in the limits of calculated errors. In addition, the movement of train caused difficulties in determining the growth rates because measured air masses changed quickly along the route. It is also possible that freshly-nucleated particles had not reached the charge equilibrium as assumed in the DMPS data inversion procedure, which causes some errors. In any way, we were able to detect two new-particle formation events from a moving rain, which demonstrates that new-particle formation can simultaneously take place over large areas in Siberia. Although the moving measurement platform complicated the detection of nucleation events, it had also many advantages. We could make conclusions on the effects of different prevailing air masses and also examine the effects of
Vartiainen et al. • Boreal Env. Res. Vol. 12
local sources. We established a good overview of concentrations in different parts of Russia, even though the results can not be considered to be too representative on the basis that we had only two measurements in each spot. Concentrations of particles and ions have also seasonal variation and thus, these results only apply to autumn conditions. It would be in major importance in the future to get knowledge on seasonal variations of concentrations in Russia. These could be accomplished by long-term measurements at a few fixed locations. Acknowledgements: We thank colleagues for their scientific conversations and their help in the instrumental field. This study was funded by the Academy of Finland (Program “Russia in Flux”), grant no. 208208. The TROICA expedition was partly funded by the ISTC Project #2773.
References Aalto P., Hämeri K., Paatero P., Kulmala M., Bellander T., Berglind N., Bouso L., Castaño-Vinyals G., Sunyer J., Cattani G., Marconi A., Cyrys J., von Klot S., Peters A., Zetzsche K., Lanki T., Pekkanen J., Nyberg F., Sjövall B. & Forastiere F. 2005. Aerosol particle number concentration measurements in five European cities using TSI-3022 condensation particle counter over a threeyear period during health effects of air pollution on susceptible subpopulations. J. Air Waste Manage Assoc. 55: 1064–1076. Crutzen P.J., Elansky N.F., Hahn M., Golitsyn G.S., Brenninkmeijer C.A.M., Scharffe D.H., Belikov I.B., Maiss M., Bergamaschi P., Röckmann T., Grisenko A.M. & Sevostyanov V.M. 1998. Trace gas measurements between Moscow and Vladivostok using Trans-Siberian railroad. J. Atmos. Chem. 29: 179–194. Draxler R.R. & Hess G.D. 1998. An overview of the HYSPLIT 4 modeling system for trajectories, dispersion and deposition. Aust. Met. Mag. 47: 295–308. Heintzenberg J., Covert D.C. & van Dingenen R. 2000. Size distribution and chemical composition of marine aerosols: a compilation and review. Tellus 52B: 1104–1122. Hirsikko A., Laakso L., Hõrrak U., Aalto P.P., Kerminen V.M. & Kulmala M. 2005. Annual and size dependent variation of growth rates and ion concentrations in boreal forest. Boreal Env. Res. 10: 357–369. Hirsikko A., Paatero J., Hatakka J. & Kulmala M. 2007. The 222Rn activity concentration, external radiation dose and air ion production rates in a boreal forest in Finland between March 2000 and June 2006. Boreal Env. Res. 12: 265–278. Hirsikko A., Bergman T., Laakso L., Dal Maso M., Riipinen I., Hõrrak U. & Kulmala M. 2007b. Identification and classification of the formation of intermediate ions meas-
Boreal Env. Res. Vol. 12 • Air ions and aerosols over Russia ured in boreal forest. Atmos. Chem. Phys. 7: 201–210. Hõrrak U., Salm J. & Tammet H. 2000. Statistical characterisation of air ion mobility spectra at Tahkuse Observatory: classification of air ions. J. Geophys. Res. 105(D7): 9291–9302. Hõrrak U., Salm J. & Tammet H. 2003. Diurnal variation in the concentration of air ions of different mobility classes in a rural area, J. Geophys. Res. 108(D20): 4653, doi:10.1029/2002JD003240. Hõrrak U., Tammet H., Aalto P. P., Vana M., Hirsikko A., Laakso L. & Kulmala, M. 2005a. Formation of charged nanometer aerosol particles associated with rainfall. In: Maenhaut W. (ed.), Abstracts of the European Aerosol Conference 2005, Ghent, Belgium, 28 August–2 September 2005, p. 606. Hõrrak U., Tammet H., Aalto P. P., Vana M., Hirsikko A., Laakso L. & Kulmala M. 2005b. Formation of charged nanometer aerosol particles associated with rainfall: atmospheric measurements and lab experiment. Report Series in Aerosol Science 81A: 180–185. Israël H. 1970. Atmospheric electricity, vol. 1: Fundamentals, conductivity, ions. Israel Program for Scientific Translations, Jerusalem. Jokinen V. & Mäkelä J.M. 1997. Closed-loop arrangement with critical orifice for DMA sheat/excess flow system. J. Aerosol Sci. 28: 643–648. Karl T.R. & Trenberth K.E. 2003. Modern global climate change. Science 302: 1719–1723. Knutson E.O. & Whitby K.T. 1975. Aerosol classification by electric mobility: apparatus, theory and applications. J. Aerosol Sci. 6: 443–451. Koponen I.K., Virkkula A., Hillamo R., Kerminen V.-M. & Kulmala M. 2003. Number size distributions and concentrations of the continental summer aerosols in Queen Maud Land, Antarctica. J. Geophys. Res. 108(D18): 4587, doi:10.1029/2003JD003614. Korhonen P., Kulmala M., Laaksonen A., Viisanen Y., McGraw R. & Seinfeld J.H. 1999. Ternary nucleation of H2SO4, NH3, and H2O in the atmosphere. J. Geophys. Res. 104: 26349–26353. Koutsenogii P.K. & Jaenicke R. 1994. Number concentration and size distribution of atmospheric aerosol in Siberia. J. Aerosol Sci. 25: 377–383. Kulmala M., Dal Maso M., Mäkelä J.M., Pirjola L., Väkevä M., Aalto P., Miikkulainen P., Hämeri K. & O’Dowd C.D. 2001. On the formation, growth and composition of nucleation mode particles. Tellus 53B: 479–490. Kulmala M., Vehkamäki H., Petäjä T., Dal Maso M., Lauri A., Kerminen V.-M., Birmili W. & McMurry P.H. 2004. Formation and growth of ultrafine atmospheric particles: a review of observations. J. Aerosol Sci. 35: 143–176. Kulmala M., Petäjä T., Mönkkönen P., Koponen I.K., Dal Maso M., Aalto P.P., Lehtinen K.E.J. & Kerminen V.M. 2005. On the growth of nucleation mode particles: source rates of condensable vapor in polluted and clean environments. Atmos. Chem. Phys. 5: 409–416. Kulmala M., Lehtinen K.E.J. & Laaksonen A. 2006. Cluster activation theory as an explanation of the linear dependence between formation rate of 3 nm particles and sulphuric acid concentration. Atmos. Chem. Phys.
395
6: 787–793. Laakso L., Hussein T., Aarnio P., Komppula M., Hiltunen V., Viisanen Y. & Kulmala M. 2003. Diurnal and annual characteristics of particle mass and number concentrations in urban, rural and arctic environments in Finland. Atmos. Env. 37: 2629–2641. Laakso L., Petäjä T., Lehtinen K.E.J., Kulmala M., Paatero J., Hõrrak U., Tammet H. & Joutsensaari J. 2004a. Ion production rate in a boreal forest based on ion, particle and radiation measurements. Atmos. Chem. Phys. 4: 1933–1943. Laakso L., Anttila T., Lehtinen K.E.J., Aalto P.P., Kulmala M., Hõrrak U., Paatero J., Hanke M. & Arnold F. 2004b. Kinetic nucleation and ions in boreal forest particle formation events. Atmos. Chem. Phys. 4: 2353–2366. Laakso L., Gagné S., Petäjä T., Hirsikko A., Aalto P.P., Kulmala M. & Kerminen V.-M. 2007. Detecting charging state of ultra-fine particles: instrumental development and ambient measurements. Atmos. Chem. Phys. 7: 1333–1345. Lushnikov A.A. & Kulmala M. 2001. Kinetics of nucleation controlled formation and condensational growth of disperse particles. Phys. Rev. E 63, 061109. Mirabel P. & Katz J.L. 1974. Binary homogeneous nucleation as a mechanism for the formation of aerosols. J. Chem. Phys. 60: 1138–1144. Mirme A., Tamm E., Mordas G., Vana M., Uin J., Mirme S., Bernotas T., Laakso L., Hirsikko A. & Kulmala M. 2007. A wide-range multi-channel Air Ion Spectrometer. Boreal Env. Res. 12: 247–264. Mäkelä J.M., Koponen I.K., Aalto P. & Kulmala M. 2000. One-year data of submicron size modes of tropospheric background aerosols in southern Finland. J. Aerosol Sci. 31: 596–611. Mönkkönen P., Koponen I.K., Lehtinen K.E.J., Hämeri K., Uma R. & Kulmala M. 2005. Measurements in a highly polluted Asian mega city: observations of aerosol particle number size distribution, modal parameters and nucleation events. Atmos. Chem. Phys. 5: 57–66. Oberlander E.A., Brenninkmeijer C.A.M., Crutzen P.J., Elansky N.F., Golitsyn G.S., Granberg I.G., Scharffe D.H., Hofmann R., Belikov I.B., Parezke H.G. & van Velthoven P.E.J. 2002. Trace gas measurements along the Trans-Siberian railroad: The TROICA 5 expedition. J. Geophys. Res. 107 (D14): 4206, doi:10.1029/ 2001JD000953. Penner J.E., Quaas J., Storelvmo T., Takemura T., Boucher O., Guo H., Kirkevåg A., Kristjansson J.E. & Seland Ø. 2006. Model intercomparison of indirect aerosol effects. Atmos. Chem. Phys. 6: 3391–3405. Quant F.R., Caldow R., Sem G.J. & Addison T.J. 1992. Performance of condensation particle counters with three continuous-flow designs. J. Aerosol Sci. 23: S405–S408. Sihto S.-L., Kulmala M., Kerminen V.-M., Dal Maso M., Petäjä T., Riipinen I., Korhonen H., Arnold F., Janson R., Boy M., Laaksonen A. & Lehtinen K.E.J. 2006. Atmospheric sulphuric acid and aerosol formation: implications from atmospheric measurements for nucleation and early growth mechanisms. Atmos. Chem. Phys. 6: 4079–4091. Stolzenburg M.R. & McMurry P.H. 1991. An ultrafine aero-
396 sol condensation nucleus counter. Aerosol Sci. Tech. 14: 48–65. Stott P.A., Tett S.F.B., Jones G.S., Allen M.R., Mitchell J.F.B. & Jenkins G.J. 2000. External control of 20th century temperature by natural and anthropogenic forcings. Science 290: 2133–2137. Tammet H. 1995. Size and mobility of nanometer particles, clusters and ions. J. Aerosol Sci. 26: 459–475. Tammet H. 1998. Reduction of air ion mobility to standard conditions, J. Geophys. Res. 103: 13933–13937. Tammet H., Hõrrak U., Laakso L. & Kulmala M. 2006. Factors of air ion balance in a coniferous forest according to measurements in Hyytiälä, Finland. Atmos. Chem. Phys. 6: 3377–3390. Tarasova O.A., Brenninkmeijer C.A.M., Assonov S.S., Elansky N.F., Röckmann T. & Brass M. 2006. Atmospheric CH4 along the Trans-Siberian railroad (TROICA) and river Ob: Source identification using stable isotope analysis. Atmos. Environ. 40: 5617–5628. Weber R.J., Marti J., McMurry P.H., Eisele F., Tanner D.J. & Jefferson A. 1996. Measured atmospheric new particle formation rates: implications for nucleation mechanisms. Chem. Engin. Comm. 151: 53–64. Winklmayr W., Reischl G.P., Linder A.O. & Berner A. 1991. A new electromobility spectrometer for the measurement
Vartiainen et al. • Boreal Env. Res. Vol. 12 of aerosol size distributions in the size range from 1 to 1000 nm. J. Aerosol Sci. 22: 289–296. Wotawa G., Novelli P.C., Trainer M. & Granier C. 2001. Inter-annual variability of summertime CO concentrations in the northern hemisphere explained by boreal forest fires in North America and Russia. Geophys. Res. Lett. 28: 4575–4578. Yu F. & Turco R.P. 2000. Ultrafine aerosol formation via ionmediated nucleation. Geophys. Res. Lett. 27: 883–886. Yu H., Kaufman Y.J., Chin M., Feingold G., Remer L.A., Anderson T.L., Balkanski Y., Belloin N., Boucher O., Christopher S., DeCola P., Kahn R., Koch D., Loeb N., Reddy M.S., Schulz M., Takemura T. & Zhou M. 2006. A review of measurement-based assessments of the aerosol direct radiative effect and forcing. Atmos. Chem. Phys. 6: 613–666. Zagaynov V.A., Khodgher T.V., Aloyan A.E., Lushnikov A.A., Biryukov Yu.G., Obolkin V.A., Marinaite I.I., Golobokova L., Gorshkov A.G., Potyomkin V. & Lyubovtseva Yu.S. 2004. Aerosol measurements at background regions of central Siberia — Baikal lake and station mondy. In: Kasahara M. & Kulmala M. (eds.), Nucleation and Atmospheric Aerosols 2004: 16th International Conference, Kyoto University Press, Kyoto, Japan, pp. 610–613.