Atmos. Chem. Phys., 10, 9431–9439, 2010 www.atmos-chem-phys.net/10/9431/2010/ doi:10.5194/acp-10-9431-2010 © Author(s) 2010. CC Attribution 3.0 License.
Atmospheric Chemistry and Physics
Variation of particle number size distributions and chemical compositions at the urban and downwind regional sites in the Pearl River Delta during summertime pollution episodes D. L. Yue1,* , M. Hu1 , Z. J. Wu1,2 , S. Guo1 , M. T. Wen1 , A. Nowak2 , B. Wehner2 , A. Wiedensohler2 , N. Takegawa3 , Y. Kondo3 , X. S. Wang1 , Y. P. Li1 , L. M. Zeng1 , and Y. H. Zhang1 1 State
Key Joint Laboratory of Environmental Simulation and Pollution Control, College of Environmental Sciences and Engineering, Peking University, Beijing, 100871, China 2 Leibniz Institute for Tropospheric Research, Permoserstrasse 15, Leipzig 04318, Germany 3 Research Center for Advanced Science and Technology, University of Tokyo, Tokyo 153-8904, Japan * now at: Guangdong Provincial Environmental Monitoring Center, Guangdong, 510045, China Received: 8 March 2010 – Published in Atmos. Chem. Phys. Discuss.: 11 June 2010 Revised: 26 August 2010 – Accepted: 1 October 2010 – Published: 7 October 2010
Abstract. In order to characterize the features of particulate pollution in the Pearl River Delta (PRD) in the summer, continuous measurements of particle number size distributions and chemical compositions were simultaneously performed at Guangzhou urban site (GZ) and Backgarden downwind regional site (BG) in July 2006. Particle number concentration from 20 nm to 10 µm at BG was (1.7 ± 0.8)×104 cm−3 , about 40% lower than that at GZ, (2.9 ± 1.1)×104 cm−3 . The total particle volume concentration at BG was 94 ± 34 µm3 cm−3 , similar to that at GZ, 96 ± 43 µm3 cm−3 . More 20–100 nm particles, significantly affected by the traffic emissions, were observed at GZ, while 100–660 nm particle number concentrations were similar at both sites as they are more regional. PM2.5 values were similar at GZ (69 ± 43 µg m−3 ) and BG (69 ± 58 µg m−3 ) with R 2 of 0.71 for the daily average PM2.5 at these two sites, indicating the fine particulate pollution in the PRD region to be regional. Two kinds of pollution episodes, the accumulation pollution episode and the regional transport pollution episode, were observed. Fine particles over 100 nm dominated both number and volume concentrations of total particles during the late periods of these pollution episodes. Accumulation and secondary transformation are the main reasons for the nighttime accumulation pollution episode. − + SO2− 4 , NO3 , and NH4 accounted for about 60% in 100– Correspondence to: M. Hu (
[email protected])
660 nm particle mass and PM2.5 increase. When south or southeast wind prevailed in the PRD region, regional transport of pollutants took place. Regional transport contributed about 30% to fine particulate pollution at BG during a regional transport case. Secondary transformation played an important role during regional transport, causing higher increase rates of secondary ions in PM1.0 than other species and shifting the peaks of sulfate and ammonium mass size − + distributions to larger sizes. SO2− 4 , NO3 , and NH4 accounted for about 70% and 40% of PM1.0 and PM2.5 , respectively.
1
Introduction
Atmospheric aerosols have attached more and more attention in recent years because they influence the global climate change and human health (Dockery et al., 1994) and degrade visibility (Sokolik and Toon, 1996; Jung and Kim, 2006). In order to understand these effects, accurate knowledge on physical and chemical properties of aerosol is required. A large number of studies showed that the size resolved properties of the atmospheric aerosols are more powerful to explain their atmospheric behavior than their bulk properties (Dusek et al., 2006; See et al., 2006). On one hand, the absorbing and scattering effect of aerosols on the incoming radiation is dependent on the particle size and composition (Nishita et al., 2007) and the
Published by Copernicus Publications on behalf of the European Geosciences Union.
9432
D. L. Yue et al.: Variation of particle number size distributions and chemical compositions
accumulation mode particle number concentrations could explain the visibility degradation on hazy days (See et al., 2006). On the other hand, only particles within a certain size range have cloud-nucleating ability and affect the microphysical and optical properties of cloud condensation nuclei (CCN, Iorga and Stefan, 2005). In addition, whether the adverse health effects of aerosols are number- or massconcentration-dependent is still a debating issue. Recently, studies have proved that ultrafine particles with very small sizes can be uptaken directly by cells as well as be translocated to other sensitive target organs such as the heart and central nervous system (Oberd¨orster et al., 2005). Compared with larger particles of similar composition ultrafine particles are more toxic and induce more intense oxidative stress in cells (Nel, 2005; Nel et al., 2006). The chemical compositions are also key elements deciding the health effect as well as the influence on climate change. Therefore, characterizing number size distributions and chemical compositions of atmospheric aerosols is very important to understand their effects on climate change, human health, and air quality. The Pearl River Delta (PRD) is one of the most economically invigorating and densely populated regions and one of the biggest city clusters in the world. Rapid urbanization and economic development have deteriorated the air quality and changed the properties of the air pollution: the primary pollutants, such as SO2 and inhalable particulate matter (PM10 ) have been reduced by abatement measures. However, the secondary products such as ozone and fine particles of high concentrations become two of the most formidable air quality and public health issues facing the PRD region. Moreover, the scale of the pollution problems in the PRD region has also expanded (Zhang et al., 2008). The occurrence of haze remains very high on about 150 days per year on average in Guangzhou from 1980 to 2006 (Deng et al., 2008). Haze characterized of very low visibility and high mass concentrations of fine particles has been reported in summer as well as in winter (Tan et al., 2009). The particle pollution in the PRD region have been reported regarding to the chemical compositions in size resolved particles or in PM2.5 and PM10 concentration at one or more sites and particle number size distributions at a coastal rural site Xinken (Cao et al., 2004; Hagler et al., 2006; Liu et al., 2008a, b; Zhang et al., 2008). However, simultaneous measurements of particle number size distributions and chemical compositions at over one site in the PRD region have not been reported. Resulted from the intense photochemical activity in summer, particulate pollution in the PRD region will be characterized with regional and secondary properties, which should be different from that in the winter or in other cities with less intense solar radiation. The average ratios of PM2.5 to PM10 in Guangzhou were larger than three other big cities in China, i.e. Wuhan, Chongqing, and Lanzhou (Wei et al., 1999). High concentrations of secondary products in fine particles, mainly oxidized organics and sulfates were observed during PRIDEPRD2004 and 2006 (Andreae et al., 2008; Jung et al., 2009). Atmos. Chem. Phys., 10, 9431–9439, 2010
The worse correlation between organic carbon (OC) to elemental carbon (EC) in the summer (R = 0.6) than in the winter (R = 0.8) and the higher OC but lower EC concentrations in Guangzhou than in Beijing during summertime (Cao et al., 2004) indicated the significance of the secondary transformation in the PRD region in summer. Therefore, it is of scientific significance to investigate the properties of particles especially of fine particles in the PRD region during summertime. Within the “Program of Regional Integrated Experiments of Air Quality over the Pearl River Delta” intensive campaign in July 2006 (PRIDE-PRD2006) focusing on gas phase photochemistry and the aerosol formation and properties during summertime, the particle number size distributions were measured simultaneously at both Guangzhou urban site (GZ) and Back-garden downwind regional site (BG), as well as the concentrations of mass and chemical composition of fine particles. Previous papers in the same special issue already show that the conditions are mainly characterized by strong particulate pollution at ground level (Li et al., 2010) and size matters more than chemistry for the CCN activity of aerosol particles at the BG site in the summer of 2006 (Rose et al., 2010). Hence, the purpose of this study is to characterize the particulate pollution in the PRD region on the basis of comparison of particle number size distributions and chemical compositions between GZ and BG sites and to explore secondary formation and regional transport with the discussion of pollution episodes.
2
Experimental methods
The intensive field campaign was performed simultaneously at both GZ and BG sites in July 2006 (Zhang et al., 2010). At the GZ site the instruments were set up on the top floor of Guangdong Provincial Environmental Monitoring Center (about 50 m above the ground level), which is located in the western urban area of Guangzhou city. At the BG site the instruments were installed on the roof of a hotel building (about 15 m above the ground level), which is located in the north of Huadu district, about 50 km north from the GZ site. At the GZ site dry particle number size distributions between 15 nm and 10 µm were measured with a system consisting of a Scanning Mobility Particle Sizer (SMPS, TSI model 3080, TSI Inc., St. Paul, MN, USA) and an Aerodynamic Particle Sizer (APS, TSI model 3321). The SMPS (a long differential mobility analyzer (TSI model 3081) with a Condensational Particle Sizer (TSI model 3025A)) was used to measure particle number size distributions from 15 to 660 nm with a time resolution of 5 min. The system was kept dry by silica gel tube within the inlet line. At the BG site the particle number size distributions from 3 nm to 10 µm were measured with a system consisting of a Twin Differential Mobility Particle Sizer (TDMPS) and an APS (TSI model 3321, USA). The TDMPS is composed www.atmos-chem-phys.net/10/9431/2010/
D. L. Yue et al.: Variation of particle number size distributions and chemical compositions
9433
Table 1. Measurement of particle number size distributions and other parameters at GZ and BG. Institute/ Reference
Site
Instrument
Data
Time resolution
Manufacturer
Valid data in July
GZ
SMPS APS
15–660 nm PNSD 660–10 000 nm PNSD
5 min 5 min
TSI, USA TSI, USA
6–10, 15–30 6–10, 23–30
This paper
BG
TDMPS APS TEOM
3–900 nm PNSD 900–10 000 nm PNSD PM2.5
10 min 10 min 1 min
IfT, Germany TSI, USA Thermo, USA
4–14, 16–23
This paper
Used when necessary and available
PKU
WAD/IC MOUDI Met. Station Corresponding Gas Analyzers EC/OC Analyzer
Ions in PM2.5 Size resolved ions in PM18 T , RH, WS, WD CO, SO2 , O3 EC and OC in PM2.5 or PM1.0
30 min about 12 h 10 min 1 min 1h
PKU, China MSP, USA Met One, USA ECOTECH, Austria Sunset, USA
AMS
OM and ions in PM1.0
10 min
Aerodyne, USA
GZ&BG
of two Hauke-type differential mobility analyzers and two CPCs (TSI model 3010 and 3025, respectively, USA), deployed to measure the particle number size distributions from 3 to 900 nm every 10 min. The relative humidity within the whole system was kept below 30% by silica gel tubes within the inlet line and both sheath air cycles. The size range of particle number size distributions observed by APSs was 500 nm −10 µm. The time resolution of APS was set as 5 or 10 min according to SMPS’s or TDMPS’s to keep consistent. APS data of particle number size distributions between 660 or 900 nm and 10 µm were transformed from aerodynamic diameter to Stokes diameter with a supposed particle density of 1.7 g cm−3 (Yue et al., 2009). Size-dependent losses due to diffusion and sedimentation within the inlet lines were corrected with empirical particle loss corrections for both two systems (Willeke and Baron, 1993). The information on these instruments and the time periods of valid data is listed in Table 1. Other data including PM2.5 and mass concentrations of − + water soluble ions (SO2− 4 , NO3 , and NH4 ) and organic matter (OM) in PM1.0 or PM2.5 , meteorological factors (temperature, relatively humidity, wind speed, and wind direction (T , RH, WS, and WD, respectively)), and gaseous pollutants (CO, SO2 , O3 ) at both sites are also involved in this paper. PM2.5 was measured by a Tapered Element Oscillating Microbalances (TEOM), ions in PM2.5 by two coupled Wet Annular Denuder sampling/Ion Chromatograph analysis systems (WAD/IC), size-resolved chemical composition mass concentrations by Micro Orifice Uniform Deposit Impactor (MOUDI), and CO, SO2 , and O3 by CO Analyzer, SO2 Analyzer, and O3 Analyzer (model 9830A, 9850A, and 9810A, ECOTECH, Australia), respectively. Meteorological stations (Met. Station) were also set up at both sites. In addition, ions and OM in PM1.0 were detected by an Aerodyne Mass Spectrometer (AMS) at the BG site. Relevant information is also listed in Table 1. www.atmos-chem-phys.net/10/9431/2010/
3 3.1
Takegawa et al., 2009; Xiao et al., 2009
Results and discussion Overview of particle number size distributions and mass concentrations
Weather system during summertime in the PRD region is controlled by tropical cyclones and subtropical high pressure alternately. The former brings frequent precipitation and scavenge the pollutants, while the latter leads to high atmospheric stability with high temperature and high RH, causing regional pollution. The temperatures during PRIDEPRD2006 at both sites were similar, 31 ± 3 ◦ C at GZ and 30 ± 3 ◦ C at BG. RH were nearly the same at GZ and BG, 76 ± 14%. Low wind speeds (below 2 m s−1 ) were observed during about 60% of the measurement time in the PRD region. Over 50% of the time during PRIDE-PRD2006 at GZ and BG the wind came from south or southeast. The mean particle number size and volume distributions at both sites during the whole campaign are shown in Fig. 1. The ultrafine particle number concentration at the GZ site was significantly higher than that at the BG site. During the measurement period, the particle number concentration (20 nm −10 µm) at GZ site ((2.9 ± 1.1)×104 cm−3 ) is 70% higher than that at BG site, (1.7 ± 0.8)×104 cm−3 (Table 2). The explanation is there are more intensive traffic emission sources in the Guangzhou urban area than those in the Back-garden suburban area. The number concentrations at GZ were also significantly higher than the total particle number concentrations (3 nm −10 µm) at Xinken rural coastal site in the PRD region during PRIDE-PRD2004, (1.6 ± 0.8)×104 cm−3 (Liu et al., 2008), which are comparable to the total particle number concentrations at BG, (1.8 ± 0.8)×104 cm−3 . At both sites fine particles with diameter below 1000 nm were the main contributor to the total particle volume concentrations, as shown in the lower panel of Fig. 1. In the fine particle size range, the particle volume size distributions Atmos. Chem. Phys., 10, 9431–9439, 2010
9434
D. L. Yue et al.: Variation of particle number size distributions and chemical compositions
Table 2. Comparison of important particle properties (mean ± σ ) Site
N20−10 000 (×104 cm−3 )
NTotal (×104 cm−3 )
STotal (×102 µm2 cm−3 )
VTotal (µm3 cm−3 )
PM2.5 (µg m−3 )
GZ BG Xinken Guangzhoub
2.9 ± 1.1 1.7 ± 0.8 – –
– 1.8 ± 0.8 1.6 ± 0.8 –
13.8 ± 5.4 9.6 ± 4.6 9.7 ± 4.0 –
96 ± 43 94 ± 34 63 ± 25 –
69 ± 43 69 ± 58 51 ± 19a 78 ± 30
a PM 1.8 during PRIDE-PRD2004 (Liu et al., 2008); b in the summer of 2002 (Cao et al., 2004).
cle volume concentrations at the GZ and BG sites than those at Xinken, 60 km southeast of the GZ site with a rural/coastal background character, is probably caused by the influence of the sea breeze at Xinken (Zhang et al., 2008). 3.2
Fig. 1. Average particle number and volume size distributions at GZ and BG during the whole campaign.
were similar and no significant difference within the ultrafine sizes (below 100 nm) was observed at GZ and BG sites. In coarse mode, the peak of average particle volume size distribution at the BG site shows at about 2 µm, smaller than that at the GZ site at about 3 µm. This indicates that the major sources for the coarse particles are different at the BG and GZ sites. Construction and road dust are probably major sources for coarse particles in the Guangzhou city, while coarse particles at the BG site are more affected by the biological sources and biomass burning. The total particle volume concentration at the GZ site of 96 ± 43 µm3 cm−3 is similar to that at the BG site (94 ± 34 µm3 cm−3 ). In addition, the measured mean particle PM2.5 mass concentrations are also similar at both sites (69 ± 43 µgm−3 at GZ and 69 ± 58 µgm−3 at BG) with R 2 of 0.71 for the daily average PM2.5 at these two sites. These findings suggest that the fine particulate pollution in the PRD region is a regional problem. The average PM2.5 in the summer of 2006 is lower than that in Guangzhou city in the summer of 2002, i.e. 78 ± 30 µgm−3 (Cao et al., 2004). The higher fine particle mass concentrations and total partiAtmos. Chem. Phys., 10, 9431–9439, 2010
Characteristics of pollution episodes
In the summer of PRD region, the mass concentrations of particles can increase quickly from very low level to very high level such as with PM2.5 exceeding 100 µg m−3 resulted from accumulation, secondary transformation, and/or regional transport. During such days, the daily average PM10 does not violate the national standard of the second grade, although heavy particulate pollution occurs with high hourly average particle mass concentrations and low visibility. The daily average particle mass concentrations conceal the pollution conditions and do not reflect them in detail. Therefore, an hourly criterion will capture the properties of the particulate pollution better. According to the frequency distribution of hourly average PM2.5 , conditions with PM2.5 exceeding 100 µg m−3 for more than two hours (excluding those caused by short time local emissions) were classified as pollution episodes in this paper. 100 µg m−3 is set with the 90% percentile of the hourly average PM2.5 concentrations during this measurement and it is almost the same as the PM2.5 value of 103 µg m−3 calculated from the ambient air quality standard of PM10 of 150 µg m−3 with the average ratio of PM2.5 to PM10 over the PRD region in summer of 68.7% (Cao et al., 2004). Totally, pollution episodes were observed on five days (12, 14, 19, 21, and 23 July) simultaneously at both sites from 6 to 23 July. Mainly two different kinds of pollution episodes were identified, accumulation pollution episode (cases on 12, 14, and 23 July) and regional transport pollution episode (cases on 19 and 21 July). 3.2.1
Accumulation pollution episode
Pollution episodes with gradual increase of PM2.5 mass concentrations were observed at both sites simultaneously. Such pollution episodes took place under stagnant meteorological conditions with wind speed below 1 m s−1 , RH over 80%, and low boundary layer at night. www.atmos-chem-phys.net/10/9431/2010/
D. L. Yue et al.: Variation of particle number size distributions and chemical compositions
Fig. 2. Variations of particle number size distributions, number concentrations, and volume concentrations at BG from 00:00 LT, 11 July to 12:00 LT, 12 July.
One accumulation pollution episode occurred from about 18:00 LT on 11 July to about 06:00 LT on 12 July is illustrated in Fig. 2 and Fig. 3 (Accumulation pollution episodes on 14 and 23 July will not be discussed in detail in this paper as they were not observed completely.). During this episode, a clear particle growth process was observed: The number peak diameter at about 80 nm in the beginning grew gradually to at about 120 nm in 12 h (Fig. 4). The evident increase in particle number concentration from 100 to 660 nm was observed. Conversely, the number concentrations for particles from 3 to 20 nm and from 20 to 100 nm decreased during the episode. In the early morning of 12 July, the lowest number concentration of the 3–20 nm particles occurred (around 10 cm−3 ). This can be ascribed to the strong coagulation scavenging produced by the high concentration of the accumulation mode particles (M¨onkk¨onen et al., 2004). The obvious increases of PM2.5 and secondary ions in − PM2.5 including SO2− 4 and NO3 were also observed at both sites, as shown in Fig. 3. Two main reasons for this increase can be postulated: (1) the dispersion of primary emissions was weak under stable weather conditions. (2) Secondary transformation processes played a key role in the particle growth. Evident growth in the mass concentrations of secondary water soluble ions was observed. In addition, contribution of unknown sources with significant emission of EC to this pollution episode might be important. During this episode, the increase rates of N100−660 and V100−660 were about 400 cm−3 h−1 and 4.0 µm3 cm−3 h−1 , www.atmos-chem-phys.net/10/9431/2010/
9435
Fig. 3. Variations of trace gases at BG, PM2.5 , and mass concentrations of chemical compositions in PM2.5 at both sites from 00:00 LT, 11 July to 12:00 LT, 12 July.
Fig. 4. Particle number size distributions during the accumulation pollution episode from 18:00 LT, 11 July to 07:00 LT, 12 July.
respectively (Table 3). If the average density of 100–660 nm particles is assumed to be 1.43 g cm−3 as estimated in the summer of Beijing (Yue et al., 2009), the latter was equal − to 5.7 µg m−3 h−1 . The increase rates of SO2− 4 and NO3 in 2− −3 −1 PM2.5 were 2.4 and 0.6 µg m h , respectively. SO4 increased significantly faster than NO− 3 , partly because of the lower volatility of SO2− . The sum concentration of SO2− 4 4 , − + NO3 , and NH4 accounted for about 60% in PM2.5 increase, − + if the measured SO2− 4 and NO3 are neutralized by NH4 . This result is similar to that reported by Liu et al. (2008) that − + SO2− 4 , NO3 , and NH4 accounted for about 50% in fine particle mass at Xinken during PRIDE-PRD2004.
Atmos. Chem. Phys., 10, 9431–9439, 2010
9436
D. L. Yue et al.: Variation of particle number size distributions and chemical compositions
Table 3. Increase rates of major species during the nighttime accumulation pollution episode. Site
N100−660 (cm−3 h−1 )
V100−660 (µm3 cm−3 h−1 )
M100−660 (µg m−3 h−1 )
PM2.5 (µg m−3 h−1 )
SO2− 4 (µg m−3 h−1 )
NO− 3 (µg m−3 h−1 )
NH+ 4 (µg m−3 h−1 )
SNA (µg m−3 h−1 )
SNA* (µg m−3 h−1 )
BG GZ
400 –
4.0 –
5.7 –
6.5 6.8
2.4 2.7
0.6 0.6
1.1 1.2
4.1 4.5
3.3 3.6
+ − 2− + − SNA=SO2− 4 +NO3 +NH4 ; SNA*=0.8×(SO4 +NO3 +NH4 ).
the corresponding increase ratios of some species at the GZ site were also given in Table 3. The corresponding increase rates at the GZ site are usually higher than those at BG site. The possible reasons might be that the percentage of SO2− 4 , + NO− , and NH was larger in PM at the urban site GZ 2.5 3 4 (about 40%) than at the regional site BG (about 25%), so particles grow more under the condition with high RH during nighttime at GZ. It is consistent with the fact that increase rates at Peking University, an urban site in Beijing are higher than those at Yufa, a regional site in Beijing, during accumulation pollution episodes (Yue et al., 2009). 3.2.2
Fig. 5. Particle number concentrations from 100 to 660 nm (N100−660 ), mass concentrations of SO2− 4 , mixing ratio of NO2 , and wind direction (WD) and wind speed (WS) from 19 to 22 July at GZ and BG.
− + Almost all SO2− 4 , NO3 , and NH4 are in the form of fine 2− − particles, and most SO4 , NO3 , and NH+ 4 are in 100–660 nm 2− particles. If we assume that 80% of SO4 and NO− 3 in PM2.5 are in 100–660 nm particles according to the measured average chemical composition size distributions by MOUDI and − + 2− the measured SO2− 4 and NO3 are neutralized by NH4 , SO4 , − + NO3 , and NH4 (actually 80% of the sum concentration of − + SO2− 4 , NO3 , and NH4 in PM2.5 ) can explain about 60% of the 100–660 nm particle mass increase, which is similar to − + the portion of SO2− 4 , NO3 , and NH4 in the accumulation mode particle mass increase (over 60%) in the summer of 2006 in Beijing (Yue et al., 2009). During the same period,
Atmos. Chem. Phys., 10, 9431–9439, 2010
Regional transport pollution episode
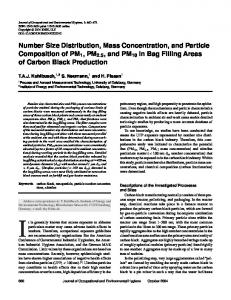
On 19 and 21 July the number concentrations of particles within 100–660 nm, mass concentrations of SO2− 4 , and mixing ratios of NO2 at BG showed peaks 6 to 8 h behind corresponding peaks appeared at GZ in the afternoon (Fig. 5. With the average wind speed of 2 m s−1 , it takes about 7 h to transport from GZ to BG). It was observed with south or southeast wind prevailing at both sites (Fig. 5 and Fig. 6b), indicating air masses move from south or southeast. These findings suggest that when south or southeast wind prevails in the PRD region, regional transport of pollutants including particles takes place. In the afternoon of 19 and 21 July, particles around 100 nm at GZ decreased gradually, but particles around 100 nm at BG increased quickly at the same time, shifting the geometric mean diameter of these particles at BG to larger sizes (conditions on 21 July in Fig. 7a). The aver+ age mass size distribution of SO2− 4 and NH4 on 21 July also peaked at larger sizes at BG (mass size distributions of SO2− 4 in Fig. 7b) with the average equivalent ratio of sulfate to to2− tal sulfur (SO2− 4 /(SO4 +SO2 )) at BG being 0.4 ± 0.1, about 30% higher than that at GZ, 0.3 ± 0.1. In addition, the mass size distribution of oxalate peaked at a larger size with higher peak value at BG compared with GZ. These results suggest that during such a transport process, particles became to be aged. The contribution of secondary formed fraction to fine particles increased significantly. Compared with on 19 and 21 July, there were similar wind speeds (below 3 m s−1 ) but different wind directions from the west or northwest to the BG site (Fig. 7a) on 12 and 13 July, where lay the mountains. So when the wind comes from this direction, it brings clean air, and 12 and 13 July were taken as the contrast days without obvious www.atmos-chem-phys.net/10/9431/2010/
D. L. Yue et al.: Variation of particle number size distributions and chemical compositions
9437
Table 4. Influence of regional transport on fine particles at BG.
(A) (B) (B-A)/B
N100−660 cm−3
V100−660 µm3 cm−3
PM2.5 µg m−3
PM∗1.0 µg m−3
SNA µg m−3
SO2− 4 µg m−3
NO− 3 µg m−3
NH+ 4 µg m−3
OM µg m−3
6.2 ± 2.6 ×10³ 9.5 ± 4.7 ×10³ 35%
38 ± 16 53 ± 20 28%
50 ± 29 70 ± 28 29%
27 ± 13 41 ± 24 33%
17 ± 10 27 ± 16 38%
11.8 ± 7.1 18.7 ± 9.9 37%
0.9 ± 0.8 1.5 ± 2.0 39%
3.8 ± 2.2 5.9 ± 3.2 35%
10.9 ± 5.0 14.1 ± 10.1 23%
A: without obvious regional transport on July 12 and 13; B: with regional transport on July 19 and 21. ∗ PM =SO2− +NO− +NH+ +OM. 1.0 4 3 4
regional pollutant transport. In order to quantify the contribution of regional transport to the fine particulate pollution at BG, average particle number and volume concentrations from 100 to 660 nm, PM2.5 , and mass concentrations of the chemical compositions in PM1.0 , including secondary − + ions (SO2− 4 , NO3 , and NH4 ) and OM during the time period from 12:00 LT to 24:00 LT on 12 and 13 July without obvious regional transport and on 19 and 21 July with regional transport are compared in Table 4. They all increased significantly with regional transport. The contribution of regional transport to N100−660 was around 35%. The contribution of regional transport of V100−660 was similar to that of PM2.5 , close to 30%. The higher increase rates of secondary ions in PM1.0 (38% on average) than that of OM (23%) indicated that during the transport secondary transformation occurred and deteriorated the particulate pollution. − + SO2− 4 , NO3 , and NH4 accounted for about 70% of PM1.0 2− − (PM1.0 =SO4 +NO3 +NH+ 4 +OM) and about 40% of PM2.5 , 2− + suggesting that SO4 , NO− 3 , and NH4 are the major composition of fine particles and play a very important role in the regional transport pollution episode. Secondary transformation plays an important role in the pollution episodes in the PRD region during summertime, causing the main contributor of total particle number concentration as well as volume concentration to be fine particles − over 100 nm with major composition of SO2− 4 , NO3 , and NH+ 4 . During accumulation pollution episodes taking place under stagnant meteorological conditions with wind speed − + below 1ms−1 , SO2− 4 , NO3 , and NH4 account for similar proportion in 100–660 nm particle mass and PM2.5 increase, for example about 60% in the case from about 18:00LT on 11 July to about 06:00 LT on 12 July. Such pollution cases occur in similar periods at both sites. In contrast, during regional transport pollution episodes with south or southeast − + wind prevailing in the PRD region, SO2− 4 , NO3 , and NH4 accounted for significant more in PM1.0 than in PM2.5 ; the fine particle mass and their chemical composition mass concentrations increase quickly at the downwind site when corresponding values tend to decrease at the GZ site, resulting in a lag of several hours between corresponding peaks at the downwind site after the GZ site.
www.atmos-chem-phys.net/10/9431/2010/
Fig. 6. Wind fields in the PRD region in the late afternoon of 12 and 19 July. The arrows show the directions.
4
Summary and conclusions
Particle number concentration from 20 nm to 10 µm in the summer of 2006 at the GZ site was 70% higher than that at the BG site. Resulted from intensive traffic emissions, more 20–100 nm particles were observed at GZ, while 100–660 nm particle number concentrations were similar at both sites as Atmos. Chem. Phys., 10, 9431–9439, 2010
9438
D. L. Yue et al.: Variation of particle number size distributions and chemical compositions Pollution episodes in the PRD region during summertime are usually contributed by secondary transformation, causing the main contributor of total particle number concentration as well as volume concentration to be fine particles over 100 nm − + with major composition of SO2− 4 , NO3 , and NH4 . Hence, these particles will dominate CCN and impose significant effect on visibility degradation during the pollution episodes − in the PRD region. Control of the precursors of SO2− 4 , NO3 , + and NH4 will effectively help to reduce the fine particulate pollution and decrease the influence of the aerosols in the PRD region during the summertime. Acknowledgements. This research was supported by the National High-tech R&D Program (863 Program, 2006AA06A308) and the National Basic Research Program (2002CB211605, 2002CB410801) from Ministry of Science & Technology, China P. R. China. The author would also like to thank Fan Yang, Rui Xiao, Weiwei Hu, Jianwei Gu, and Hang Su for supplying important data for this paper. Edited by: A. Hofzumahaus
References Fig. 7. Average particle number size distributions on 21 July (a) and average mass size distributions of sulfate and oxalate from 06:30 LT, 21 July to 06:00 LT, 22 July (b) at GZ and BG.
they are more regional. The total particle volume concentrations were similar at the GZ site (96 ± 43 µm3 cm−3 ) and BG site (94 ± 34 µm3 cm−3 ). PM2.5 were also similar with R 2 of 0.71 for the daily average PM2.5 at these two sites, indicating that particulate pollution in the PRD region is a regional problem. Two kinds of pollution episodes, the accumulation pollution episode and the regional transport pollution episode, were observed. Fine particles over 100 nm dominated both number and volume concentrations of total particles during the late periods of these pollution episodes. Accumulation and secondary transformation are two main reasons for the nighttime accumulation pollution episode, with higher in− 2− − + crease rate of SO2− 4 than NO3 . SO4 , NO3 , and NH4 account for about 60% in 100–660 nm particle mass and PM2.5 increase. When south or southeast wind prevailed in the PRD region, regional transport of pollutants took place. The contribution of regional transport was about 30% to fine particulate pollution at the BG site during a regional transport case. Secondary transformation occurred and played an important role during regional transport, causing higher in− creasing rates of secondary ions (including SO2− 4 , NO3 , and + NH4 ) in PM1.0 than other species and shifting the peaks of sulfate, ammonium, and oxalate mass size distributions to − + larger sizes. SO2− 4 , NO3 , and NH4 accounted for about 70% in PM1.0 and about 40% in PM2.5 . Atmos. Chem. Phys., 10, 9431–9439, 2010
Andreae, M. O., Schmid, O., Yang, H., Chand, D., Yu, J. Z., Zeng, L.-M., and Zhang, Y.-H.: Optical properties and chemical composition of the atmospheric aerosol in urban Guangzhou, China, Atmos. Environ., 42(25), 6335–6350, 2008. Barsanti, K. C., McMurry, P. H., and Smith, J. N.: The potential contribution of organic salts to new particle growth, Atmos. Chem. Phys., 9, 2949–2957, doi:10.5194/acp-9-2949-2009, 2009. Bond, T. C., Wehner, B., Plewka, A., Wiedensohler, A., Heintzenberg, J., and Charlson, R. J.: Climate-relevant properties of primary particulate emissions from oil and natural gas combustion, Atmos. Environ., 40(19), 3574–3587, 2006. Cao, J. J., Lee, S. C., Ho, K. F., Zou, S. C., Fung, K., Li, Y., Watson, J. G., and Chow, J. C.: Spatial and seasonal variations of atmospheric organic carbon and elemental carbon in Pearl River Delta Region, China, Atmos. Environ., 38, 4447–4456 , 2004. Deng, X., Tie, X., Wu, D., et al.: Long-term trend of visibility and its characterizations in the Pearl River Delta (PRD) region, China, Atmos. Environ., 42, 1424–1435, 2008. Dockery, D. W. and Pope, C. A.: Acute respiratory effects of particulate air pollution, Annu. Rev. Public Health, 15, 107–132, 1994. Dusek, U., Frank, G. P., Hildebrandt, L., et al.: Size matters more than chemistry for cloud-nucleating ability of aerosol particles, Science, 312, 1375–1378, 2006. Hagler, G. S. W., Bergin, M. H., Salmon, L. G., et al.: Source areas and chemical composition of fine particulate matter in the Pearl River Delta region of China, Atmos. Environ., 40, 3802–3815, 2006. Hu, M., Wu, Z. Slaninia, J., Lin, P., Liu, S., and Zeng, L.: Acidic gases, ammonia and water-soluble ions in PM2.5 at a coastal site in the Pearl River Delta, China, Atmos. Environ., 42, 6310–6320, 2008.
www.atmos-chem-phys.net/10/9431/2010/
D. L. Yue et al.: Variation of particle number size distributions and chemical compositions Iorga, G. and Stefan, S.: Effects of the atmospheric aerosol on the optical properties of cloud, Romanian Reports in Physics, 57(3), 426–435, 2005. Jung, C. H. and Kim, Y. P.: Numerical estimation of the effects of condensation and coagulation on visibility using the moment method, J. Aerosol Sci., 37(2), 143–161, 2006. Jung, J., Lee, H., Kim, Y. J., et al.: Aerosol chemistry and the effect of aerosol water content on visibility impairment and radiative forcing in Guangzhou during the 2006 Pearl River Delta campaign, J. Environ. Manage., 90, 3231–3244, 2009. Li, X., Brauers, T., Shao, M., Garland, R. M., Wagner, T., Deutschmann, T., and Wahner, A.: MAX-DOAS measurements in southern China: retrieval of aerosol extinctions and validation using ground-based in-situ data, Atmos. Chem. Phys., 10, 2079– 2089, doi:10.5194/acp-10-2079-2010, 2010. Liu, S., Hu, M., Slanina, S., He, L. Y., Niu, Y. W., Bruegemann, E., Gnauk, T., and Herrmann, H.: Size distribution and source analysis of ionic compositions of aerosols in polluted periods at Xinken in Pearl River Delta (PRD) of China, Atmos. Environ., 42, 6284–6295, 2008a. Liu, S., Hu, M., Wu, Z. J., Wehner, B., Wiedensohler, A., and Cheng, Y. F.: Aerosol number size distribution and new particle formation at a rural/coastal site in Pearl River Delta (PRD) of China, Atmos. Environ., 42, 6275–6283, 2008b. Mozurkewich, M.: The dissociation constant of ammonium nitrate and its dependence on temperature, relative humidity and particle size, Atmos. Environ., 27A(2), 261–270, 1993. M¨onkk¨onen, P., Koponen, I. K., Lehtinen, K. E. J., et al.: Death of nucleation and Aitken mode particles: observations at extreme atmospheric conditions and their theoretical explanation, J. Aerosol Sci., 35(6), 781–787, 2004. Nel, A.: Air pollution-related illness: effect of particles, Science, 308, 804–806, 2005. Nel, A.: Xia, T., Madler, L., and Li, N.: Toxic potential of materials at the nanolevel, Science, 311, 622–627, 2006. Nishita, C., Osada, K., Matsunaga, K., and Iwasaka, Y.: Number-size distributions of free tropospheric aerosol particles at Mt. Norikura, Japan: effects of precipitation and airmass transportation pathways, J. Geophys. Res., 112, D10213, doi:10.1029/2006JD007969, 2007. Oberd¨orster, G., Oberd¨orster, E., and Oberd¨orster, J.: An emerging discipline evolving from studies of ultrafine particles, Environ. Health Persp., 113(7), 823–839, 2005. Rose, D., Nowak, A., Achtert, P., Wiedensohler, A., Hu, M., Shao, M., Zhang, Y., Andreae, M. O., and P¨oschl, U.: Cloud condensation nuclei in polluted air and biomass burning smoke near the mega-city Guangzhou, China Part 1: Size-resolved measurements and implications for the modeling of aerosol particle hygroscopicity and CCN activity, Atmos. Chem. Phys., 10, 3365– 3383, doi:10.5194/acp-10-3365-2010, 2010.
www.atmos-chem-phys.net/10/9431/2010/
9439
See, S. W., Balasubramanian, R., and Wang, W.: A study of the physical, chemical, and optical properties of ambient aerosol particles in Southeast Asia during hazy and nonhazy days, J. Geophys. Res., 111, D10S08, doi:10.1029/2005JD0061, 2006. Sokolik, I. N. and Toon, O. B.: Direct radiative forcing by anthropogenic airborne mineral aerosols, Nature, 381(6584), 681–683, 1996. Takegawa, N., Miyakawa, T., Watanabe, M., Kondo, Y., Miyazaki, Y., Han, S., Zhao, Y., Pinxteren, D., van, Bruggemann, E., Gnauk, T., Herrmann, H., Xiao, R., Deng, Z., Hu, M., Zhu, T., and Zhang, Y.: Performance of an aerodyne aerosol mass spectrometer (AMS) during intensive campaigns in China in the summer of 2006, Aerosol Sci. Technol., 43, 189–204, 2009. Tan, J. H., Duan, J. C., Chen, D. H., et al.: Chemical characteristics of haze during summer and winter in Guangzhou, Atmos. Res., 94, 238–245, 2009. Wei, F., Teng, E., Wu, G., Hu, W., Wilson, W. E., Chanpman, R. S., Pau, J. C., and Zhang, J.: Ambient concentrations and elemental compositions of PMB10B and PMB2.5B in four Chinese cities, Environ. Sci. Technol., 33, 4188–4193, 1999. Xiao, R., Takegawa, N., Kondo, Y., Miyazaki, Y., Miyakawa, T., Hu, M., Shao, M., Zeng, L. M., Hofzumahaus, A., Holland, F., Lu, K., Sugimoto, N., Zhao, Y., and Zhang, Y. H.: Formation of submicron sulfate and organic aerosols in the outflow from the urban region of the Pearl River Delta in China, Atmos. Environ., 43, 3754–3763, 2009. Yue, D. L., Hu, M., Wu, Z. J., Wang, Z. B., Guo, S., Wehner, B., Nowak, A., Achtert, P., Wiedensohler, A., Jung, J., Kim, Y. J., and Liu, S. C.: Characteristics of aerosol size distributions and new particle formation in the summer of Beijing, J. Geophys. Res., 114, D00G12, doi:10.1029/2008JD010894, 2009. Zhang, Y. H., Hu, M., Zhong, L. J., Wiedensohler, A., Liu, S. C., Andreae, M. O., Wang, W., and Fan, S. J.: Regional Integrated Experiments on Air Quality over Pearl River Delta 2004 (PRIDE-PRD2004): Overview, Atmos. Environ., 42, 6157– 6173, 2008. Zhang, Y. H., Hu, M., Shao, M., Brauers, T., Chang, C. C., Hofzumahaus, A., Holland, F., Li, X., Lu, K., Kita, K., Kondo, Y., Nowak, A., P¨oschl, U.eand Rohrer, F., Zeng, L., Wiedensohler, A., and Wahner, A.: Continuous efforts to investigate regional air pollution in the Pearl River Delta, China: PRIDEPRD2006 campaign, Atmos. Chem. Phys. Discuss., in preparation, 2010.
Atmos. Chem. Phys., 10, 9431–9439, 2010