Journal of Experimental Psychology: Learning, Memory, and Cognition 2006, Vol. 32, No. 2, 197–214
Copyright 2006 by the American Psychological Association 0278-7393/06/$12.00 DOI: 10.1037/0278-7393.32.2.197
Is the Focus of Attention in Working Memory Expanded Through Practice? Klaus Oberauer University of Potsdam, Germany This article reinvestigates the claim by P. Verhaeghen, J. Cerella, and C. Basak (2004) that the focus of attention in working memory can be expanded from 1 to 4 items through practice. Using a modified version of Verhaeghen et al.’s n-back paradigm, Experiments 1 and 3 show that a signature of a one-item focus, the time cost for switching between items in working memory, persists over practice. Verhaeghen et al. reported a shift over practice from a step function to a linear slope of reaction times over set size and argued that it reflects the expansion of the focus. With an improved counterbalancing scheme, a continuously increasing slope was found even without practice in Experiment 2. The results question the hypothesis that the focus is expanded through practice. They are in line with predictions from a model that distinguishes a one-item focus from a direct-access region holding about 4 items. Keywords: working memory, focus of attention, practice, n-back
dynamic than access to previous items. McElree and Dosher explained this by assuming that the last item of the memory list is still held in the focus of attention and thereby has privileged accessibility. McElree (2001) extended this work to the n-back task. A mixture model in which the focus of attention held the item n steps back in some trials and the last item presented in others gave a good fit to these data. The second set of findings comes from a variant of the memory-updating paradigm introduced by Garavan (1998). He asked participants to memorize two separate counters for two classes of geometrical figures and to increment them according to figures shown individually on the screen. When switching from one counter to the other, RTs were about 300 ms larger than when the same counter was incremented twice in a row. This object-switch effect was later extended to mental arithmetic tasks (Oberauer, 2003a) and to spatial updating tasks (Ku¨bler, Murphy, Kaufman, Stein, & Garavan, 2003). It can be explained by assuming that at each step the focus of attention holds only the element that must be updated in that step and that it needs time to switch to another object for the next step. Recently, Cowan has suggested that the wide, multiple-element focus and the narrow, single-element focus are two perspectives on the same mechanism. He argued that the focus can be used in a flexible way, narrowing down to a single element or expanding to a maximum of four elements (Cowan et al., 2005). A related idea was independently advanced by Verhaeghen et al. (2004). They provided evidence, discussed in more detail below, for the claim that with practice the focus of attention gradually expands from one to four elements. This claim challenges a framework of working memory I developed in previous work (Oberauer, 2002), which assumes that the wide focus and the narrow focus refer to different components of working memory. The purpose of the present work was to reinvestigate the question of whether the focus of attention can be expanded from one to four elements over practice and, thereby, to submit my framework to a test in an area in which current evidence seems to go against it. In what follows, I first
Although our brains supply a vast amount of memories and process a wealth of sensory input, we have access to only a small amount of information at any time. This selectivity is a central topic for most theories of attention and of working memory, and it is often captured by the concept of a limited capacity. Theories of attention typically assume that certain processes can only apply to one or a few perceptual features, objects, or events at the same time (Pashler, 1998). Theories of working memory usually assume that only a small number of representational elements, so-called chunks, can be maintained in a highly accessible state at the same time (Baddeley, 1986; Cowan, 1995; Miyake & Shah, 1999). Cowan (1988, 1995) has developed a framework that integrates attention and memory. A core concept in this framework is the focus of attention that has a limited capacity of about four elements, (Cowan, 2001). These elements are a subset of representations in long-term memory (LTM) that are currently activated, either by perception or by memory processes. Other researchers have proposed a focus of attention in working memory that is limited to a single element (Garavan, 1998; McElree, 2001). Evidence for this notion comes from two sets of findings. Using an immediate recognition paradigm, McElree and Dosher (1989) showed that comparison of a probe with the last list item is faster than comparisons with earlier list items. Access to the last item in the sequence follows a qualitatively different access
Klaus Oberauer, Department of Psychology, University of Potsdam, Potsdam, Germany. This work was supported by Grant OB 121 from Deutsche Forschungsgemeinschaft (DFG). Many thanks go to Sarah Risse and Lena Knappert for their help with collecting the data, and to Erik Altmann, Nelson Cowan, Elke Lange, and Paul Verhaeghen for comments on a previous version of this article. Correspondence concerning this article should be addressed to Klaus Oberauer, Department of Experimental Psychology, University of Bristol, 8 Woodland Road, Bristol BS8 1TN, United Kingdom. E-mail:
[email protected] 197
OBERAUER
198
present an overview of my framework and then discuss the study by Verhaeghen et al. (2004).
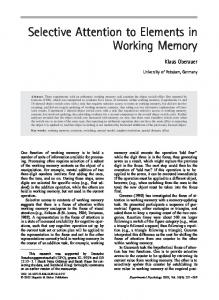
The Embedded Three-Component Framework of Working Memory I assume that the working memory system consists of three embedded components: the activated part of long-term memory, the region of direct access, and the focus of attention (see Figure 1). The three components are not thought of as separate modules, but as functionally distinct states of representations as they become selected for processing through three levels. The first level of selection is activating a representation above baseline, either through perceptual input or through spread of activation from other representations. This generates the most comprehensive component of working memory, the activated part of LTM. On the second level, a small number of the activated representations are bound to positions in a mental coordinate system—this can be a mental space in which elements are placed or a schema with slots for individual elements. This set defines the second component, the region of direct access, so called because the elements in the set are individually accessible through their position in the coordinate system. Actually accessing an element means bringing it into the focus of attention, which constitutes the third level of selection and the third component of the working memory system. The focus of attention holds the representation that is the object of the next cognitive operation. Evidence for the distinction between the activated part of LTM and the direct-access region comes from studies investigating set-size or list-length effects. Reaction times (RTs) increase with the length of a list currently maintained in working memory if the cognitive operation to be performed requires access to an element in the list. If the memory contents are indicated to be irrelevant to the required cognitive operation, set size effects disappear quickly after a cue indicating their irrelevance (Oberauer, 2001, 2002, 2005). I assume that memory representations must be held in the direct-access region if they must be accessed for an operation but can be removed into activated LTM if no access is required. Set-size effects arise from the competition among the elements in the direct-access region for entry into the focus of attention, and
Figure 1. Sketch of the embedded three-component framework of working memory. The nodes and links represent a section from the associative network of representations in long-term memory. A subset of the nodes, highlighted in black, is activated (first component). From the activated part of long-term memory, a subset is temporarily bound to positions in a mental coordinate system; these bindings are represented by thick dotted lines. This subset constitutes the region of direct access (second component). Within it, the focus of attention, illustrated by the oval encircling the node, selects one representation element as the object of processing (third component).
activated elements outside the direct-access region are not eligible for access, so they don’t contribute to set-size effects. Evidence for the distinction between the direct-access region and the focus of attention comes from the object-switch effect described above: When two successive operations require access to the same element or object in working memory, the second operation can be performed faster than when a switch to another object is required (Garavan, 1998; Oberauer, 2003a). The two distinctions between the three working memory components were demonstrated simultaneously in experiments in which participants were instructed to memorize two short lists of digits, one of which had to be accessed for a concurrent arithmetic task (the “active” list), whereas the other only had to be maintained (the “passive” list). Set-size effects on RTs for arithmetic operations were constantly observed for the active list but vanished quickly for the passive list. In addition, object-switch costs were observed when two successive arithmetic operations accessed different digits within the active list (Oberauer, 2002). A flexible focus, as suggested by Cowan et al. (2005), can be used to explain the individual phenomena supporting the threecomponent framework: A wide focus can hold lists of up to four elements, thereby playing the role of the direct-access region. A narrow focus can select a single element, thereby playing the role of the focus of attention in my framework. Cowan’s theory, however, has a problem accounting for the two phenomena occurring at the same time: The dissociation of set-size effects for active and passive lists can be explained by assuming a wide focus that holds the complete active list, whereas the passive list is held in activated LTM. The object-switch effect within the active list, however, requires assuming a narrow focus that picks out one digit from the active list. The focus cannot be wide and narrow at the same time, so the architecture proposed by Cowan is not sufficient to explain the results in Oberauer (2002).
A Working Memory Workout With the N-Back Task Verhaeghen et al. (2004) presented intriguing evidence for the claim that the focus of attention expands from one to four elements through practice. They used a modified n -back task. Participants were asked to continuously remember the last n digits in a sequence of more than 20 digits, with n varying from one to five. For each new digit they had to make a speeded decision as to whether it matched the one that had been presented n steps back; the next digit appeared immediately after each reaction. The task differed from standard n-back tasks in that the digits were displayed row by row in n columns, and each column was associated with a different print color. Thereby, each new digit had to be compared to the previous digit displayed in the same column and in the same color. At the beginning of practice, Verhaeghen et al. (2004) observed that RTs increased substantially from blocks with n ⫽ 1 to blocks with n ⫽ 2 but did not increase further with larger values of n. They interpreted the step from n ⫽ 1 to higher ns as object-switch costs, because with n ⫽ 1 only one element had to be maintained and updated in working memory at any time, whereas with larger values of n, each new digit involved a switch to another element in working memory for comparison. This interpretation implies that the focus of attention holds only one digit at a time and needs time to switch to the next one in the row. The constant RTs for larger n values are interpreted as reflecting a content-addressable LTM
EXPANDING THE FOCUS OF ATTENTION?
from which digits are retrieved independently of how many other digits are currently maintained in activated LTM. After 10 sessions of practice, the pattern of RTs as a function of n changed into a linear increase from n ⫽ 1 to n ⫽ 4, with a slightly larger increase from 4 to 5. Verhaeghen and colleagues interpreted this as showing an expansion of the focus of attention, which now can hold up to four digits. The linear increase of RTs is explained by the capacity limit of the focus, such that processing is slowed when more elements must be held by it. With n ⬎ 4, however, still not all elements fit into the focus, so RT increases more than expected from a linear extrapolation of the 1 to 4 range. These results are impressive because they fit exactly the predictions to be made from the assumptions of Cowan et al. (2005): The focus of attention is flexible to zoom in and out within the range of one to four elements, but five elements overload its capacity. There is one problem, however, with this interpretation. The experiment of Verhaeghen et al. (2004) confounds object switching with effective set size, that is, the number of digits to be memorized at any time, which equals n. With n ⫽ 1 no object switch is required, whereas with n ⬎ 1 every reaction involves a switch to a new object in working memory. This is so because successive digits appear in a regular left-to-right sequence across the n columns, so that each new digit is compared with a previous digit exactly n steps back. The increase in RT from n ⫽ 1 to n ⫽ 2 therefore could reflect the difference between object-switch and no-switch RTs, a set-size effect, or both. This is a serious problem because the interpretation of Verhaeghen et al. (2004) rests on the assumption that this increase reflects object-switch costs at the beginning of practice but reflects the lower part of a linear set-size function at the end of practice. The claim that the focus of attention holds up to four elements at the end of practice rests crucially on the assumption that object-switch costs have vanished by then. Object-switch costs, however, cannot be measured directly for each level of n in the paradigm used by Verhaeghen et al., because a no-switch baseline is lacking for n ⬎ 1. The main purpose of the work presented here is to remove the confound between list-length and object switch. To this end, I modified the n-back task further, moving it closer to memoryupdating paradigms used in previous research investigating the focus of attention (Garavan, 1998; Oberauer, 2003a). In the conditions with n ⬎ 1, each new digit appears in the same column as the preceding one half of the time, and in a randomly selected different column otherwise. In this way, 50% of the reactions involve switches to a new object in working memory and 50% are no-switch reactions; object-switch costs can be calculated as the difference between them within each level of n. Participants practiced this task for 10 sessions. If the focus of attention expands to hold more than one digit at a time, object-switch costs should vanish over practice. The maximum n for which no object-switch costs are observed can be taken as a measure of the maximum capacity of the focus at each point in practice.
Experiment 1 Method Participants Eight students from the University of Potsdam participated for course credit. A cinema voucher was awarded to the person who reached the highest performance level at the end of practice.
199
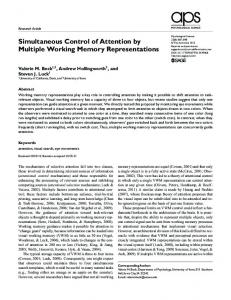
Materials and Procedure Each trial of the n-back task began with presenting the n columns in which digits would appear, with n varying from 1 to 5. Columns were demarcated by pairs of horizontal lines, one at the top and the other at the bottom of the screen. Each pair of lines was drawn in a different color. The width of the columns was 1/8 of the screen width, and columns were separated by 1/32 of the screen width. The set of columns was centered vertically on the screen so that the whole display was symmetrical along a vertical axis. At the beginning of each trial, one digit was presented in each column in a color matching the demarcation lines of that column. These initial digits were displayed one by one in a left-to-right order, vertically centered between the column-delimiting lines, each one for 900 ms followed by a 100-ms blank (see Figure 2). The last blank was followed by the first of a series of 20 digits presented as probes. Each probe appeared in one of the columns, its color again matching the borders of that column. The probes were determined at random, with the constraint that the 20 probes of each trial consisted of five probes in each cell of a 2 ⫻ 2 design, crossing probe type (positive vs. negative) and switching condition (no switch vs. switch). Positive probes matched the digit displayed last in the same column, whereas negative probes were nonmatching digits selected at random without further constraints. No-switch probes were displayed in the same column as the preceding probe, whereas the column of switch probes was selected at random from the remaining columns (except for n ⫽ 1, where all probes were no-switch probes). The vertical position of each switch probe was the same as that of the preceding probe; the vertical position of each no-switch probe was chosen at random from five equally spaced positions with the constraint that the preceding position was never selected. This variation of vertical position on no-switch probes was introduced to roughly match the horizontal shift between successive stimuli on switch probes. In this way, the spatial movement of visual attention required between successive stimuli was approximately equal for both switch conditions so that object switching was not confounded with shifts of visual attention in space. Participants were required to continuously remember the last digit that appeared in each column and to compare each new probe with the digit they remembered for the respective column. They were instructed to make a yes–no decision as fast and accurately as possible by pressing the left or the right arrow key on the computer keyboard; assignment of the response categories to the two keys was chosen by participants at the beginning of the experiment. Each key press was followed by the display of the next probe after a 100-ms blank. At the end of each trial, that is, after 20 recognition decisions, the column delimiting lines disappeared and were replaced by a feedback text informing the participant about the mean RT and the number of correct decisions out of 20. By pressing the space bar, participants moved on to the next trial. Each session consisted of 10 blocks. The first five blocks consisted of six test trials preceded by one practice trial; the remaining five blocks consisted of five test trials without preceding practice trial. The number of n columns varied between blocks according to a constant schema, 1–2–3– 4 –5–5– 4 –3–2–1. Participants completed 10 sessions over a period of 2 to 3 weeks; times were arranged largely according to their wishes, with the constraint that no more than two sessions were completed on the same day. All these design features were modeled closely after Verhaeghen et al. (2004) so that participants received the same amount of practice with conditions arranged in the same order as in that study.
Results The first test trial of the first five blocks in each session was discarded as a warm-up trial. Data from the first probe of each trial were also discarded because they cannot be classified as switch or no-switch probes. In all analyses of variance (ANOVAs), variables with more than two levels (i.e., session and set size) were coded as
OBERAUER
200
Figure 2. Illustration of the beginning of a trial with n ⫽ 3. The starting values are presented in the first three screens; the next three screens show the first three probe and updating stimuli from a series of 20. The second probe is a switch probe, whereas the third is a no-switch probe. Each column has a different color (not represented here). RT ⫽ reaction time.
linear contrasts unless explicitly mentioned, because linear trends are theoretically more interesting than haphazard differences between individual levels.1 The alpha level for all tests was set to .05.
Mean Reaction Times Only RTs of correct responses were analyzed. Outliers were defined as RTs smaller than 200 ms or exceeding a participant’s mean within a session, level of n, and object switch condition by more than 3 SD. This criterion led to the elimination of 1.8% of all RTs. Mean RTs are displayed as a function of session (1 to 10), level of n (i.e., effective set size, 1 to 5), and object switch condition in the top panel of Figure 3. The subset of data corresponding to the conditions realized by Verhaeghen et al. (2004) largely replicated their results: At the beginning of practice there was a large increase in RT from n ⫽ 1 to the switch condition of n ⫽ 2, followed by no further increase in the 2–5 range. At the end of practice, RTs increased in an approximately linear fashion from n ⫽ 1 across the switch conditions of the higher values of n. The statistical analyses confirming this pattern are summarized in the first two lines of Table 1. Taking the no-switch conditions of n ⬎ 1 into account reveals a more complete picture (lines 3–5 in Table 1). No-switch RTs increased from n ⫽ 1 to n ⫽ 2 but did not increase further with larger set sizes; this pattern held at the beginning and at the end of practice. Actually there was a trend for no-switch RTs to decrease with n in the 2–5 range but this trend was not significant in either Session 1 or Session 10. Most important for present purposes is the finding that object-switch costs, defined as the RT difference between switch and no-switch probes within each level of n, were observed at the beginning as well as at the end of practice. As
observed in previous studies with different paradigms (Oberauer, 2002, 2003a), object-switch costs increased with effective set size (i.e., level of n ranging from 2 to 5). This is shown by ANOVAs with object-switch condition (switch vs. no switch) and n (2 to 5) as variables, summarized in the last three rows of Table 1. The results of two more comprehensive ANOVAs are summarized in Table 2. The first ANOVA covers the whole range of n values (1–5) and therefore can only include no-switch probes; the factors were session (10), set size n (5), and probe type (2, positive vs. negative). Apart from the unsurprising effect of session reflecting the overall speed-up through practice, there was a main effect of probe type. As observed before by Verhaeghen et al. (2004), RTs to negative probes were on average 179 ms slower than those to positive probes. The interpretation of this effect is ambiguous because negative probe RTs are generally slower than positive probes in short-term recognition paradigms (Sternberg, 1969), and in addition to this, negative probes involve an updating step in the present paradigm whereas positive probes do not. The positive– negative difference observed here is much larger than typically found in the Sternberg (1969) paradigm and similar tasks, so it probably reflects a combination of the general positive–negative effect and the updating costs specific to the present paradigm. As shown by the interaction of probe type with session, the positive– negative difference became smaller with practice (from 394 ms in the first session to 95 ms in the last), probably because practice 1 Higher order polynomial contrasts became significant in several analyses (most notably the quadratic contrast for the effect of session, reflecting the decelerating nature of the practice effect expected from the power law of practice). These effects are not relevant in the present context and therefore are omitted for brevity.
EXPANDING THE FOCUS OF ATTENTION?
201
Figure 3. Performance in the n-back task by set size (n ⫽ 1 to 5) and object-switch condition for Sessions 1 through 10. Top: Reaction times (RTs). Bottom: Proportion of correct recognition decisions. Error bars represent 95% confidence intervals for within-subject comparisons computed by the method of Bakeman and McArthur (1996) separately for each session. Error bars are meaningful for within-session comparisons but not for between-session comparisons.
effects on both positive and negative probes approximately followed decreasing power functions, which tend to converge with practice. Another remarkable finding is that the linear contrast of set size was only marginally significant and did not interact with session. This means that no-switch RTs showed no reliable linear set-size effect regardless of practice. There were, however, significant quadratic and cubic trends of set size, F(1, 7) ⫽ 41.50, partial 2 ⫽ .86, and F(1, 7) ⫽ 44.71, partial 2 ⫽ .87, respectively, both
ps ⬍ .001, and they both interacted with session, F(1, 7) ⫽ 7.12, p ⫽ .03, partial 2 ⫽ .51, and F(1, 7) ⫽ 9.35, p ⫽ .02, partial 2 ⫽ .57, respectively. These effects reflect the increase of no-switch RTs from n ⫽ 1 to n ⫽ 2 and the gradual decline thereafter, which became shallower as practice progressed. The second ANOVA also includes switch probes and therefore had to exclude n ⫽ 1; the variables were session (10), set size n (4), probe type (2), and object switch (2). In contrast to the analysis
OBERAUER
202
Table 1 Results of ANOVAs Testing Effects of Set Size (n) and Object Switch in Sessions 1 and 10, Experiment 1 Session 1
Session 10
Source of variance
F
p
Partial 2
F
p
Partial 2
Set size ⫽ 1 - 2sw Set size ⫽ 2sw - 5sw (linear) Set size ⫽ 1 - 2no Set size ⫽ 1 - 5no (linear) Set size ⫽ 2no - 5no (linear) OS condition Set size ⫽ 2ns - 5ns (linear) Set size ⫽ 2ns - 5ns (linear) ⫻ OS condition
62.89 2.02 18.21 0.52 1.13 43.36 0.00
⬍.001 .20 .004 .49 .32 ⬍.001 .99
.90 .22 .72 .07 .14 .86 .00
53.79 52.29 173.69 30.05 0.02 47.91 42.31
⬍.001 ⬍.001 ⬍.001 .001 .88 ⬍.001 ⬍.001
.89 .88 .96 .81 .00 .87 .86
16.41
.005
.70
53.83
⬍.001
.89
Note: All analyses had dfs ⫽ 1, 7. Ranges are added to the set size variable, specifying the levels of n included and the level of the object-switch (OS) condition (no ⫽ no switch; sw ⫽ switch; ns ⫽ both no switch and switch); linear ⫽ linear contrast.
of no-switch RTs, there was a significant linear increase of RTs with set size in this analysis, which strongly interacted with object switch condition: Only switch RTs increased over n. Remarkably, this pattern was not significantly modulated by session, as shown by the nonsignificant Session ⫻ Set Size ⫻ Object switch interaction. Figure 3 (top panel) shows that the linear increase of switch RTs with n was absent only in the first session. To test this impression statistically, I ran the ANOVA again with a Helmert contrast instead of a linear contrast on session. The Helmert contrast compares each level of a variable with the mean of the following levels. The first Helmert contrast therefore tests Session 1 against the mean of Sessions 2 through 10, the second Helmert contrast tests Session 2 against the mean of Sessions 3 to 10, and so forth. In this analysis, the first Helmert contrast of session (first vs. later) interacted significantly with the linear contrast of set size, F(1, 7) ⫽ 13.18, p ⫽ .008, partial 2 ⫽ .65 (no higher order
Helmert contrast interacted significantly with set size). However, the three-way interaction of session (first vs. later), set size (linear), and object switch still did not become significant, F(1, 7) ⫽ 2.55, p ⫽ .15, partial 2 ⫽ .27. The two analyses together indicate that the slope of RT over n significantly increased from the first to later sessions, but this increase was not modulated by object switch condition. Rather, the slopes of both switch and no-switch RTs over n (2–5) were depressed in the first session compared with later sessions. The difference between these slopes did not change, implying that object-switch costs increased with n independent of practice. The only other significant effect from the second ANOVA in Table 2 was the interaction of session, probe type, and object switch. Early in practice, object-switch costs tended to be larger with positive than with negative probes, whereas the opposite was true toward the end of practice. There is no obvious
Table 2 Results of ANOVAs with Session, Object-Switch Condition, Set Size, and Probe Type as Variables, Experiment 1 No switch (n ⫽ 1–5)
Both switch conditions (n ⫽ 2–5)
Source of variance
F
p
Partial 2
F
p
Partial 2
Session (linear) Set size ⫽ n (linear) Probe type OS Session ⫻ Set Size Session ⫻ Probe Type Session ⫻ OS Set size ⫻ Probe Type Set size ⫻ OS Probe Type ⫻ OS Session ⫻ Set Size ⫻ Probe Type Session ⫻ Set Size ⫻ OS Session ⫻ Probe Type ⫻ OS Set size ⫻ Probe Type ⫻ OS 4-way
12.80 4.94 14.69
.009 .06 .006
.65 .41 .68
0.01 6.08
.91 .04
.00 .47
2.77
.14
.28
0.64
.45
.08
15.56 8.71 14.16 178.37 2.21 4.24 7.05 0.00 49.70 0.00 1.41 0.13 10.86 0.35 0.27
.006 .02 .007 ⬍.001 .18 .08 .03 1.00 ⬍.001 .96 .27 .73 .01 .57 .61
.69 .55 .67 .96 .24 .38 .50 .00 .88 .00 .17 .02 .61 .05 .04
Note.
OS ⫽ object switch condition; all effects of session and set size are linear contrasts; all dfs ⫽ 1, 7.
EXPANDING THE FOCUS OF ATTENTION?
interpretation for this unexpected effect; therefore, I will not discuss it further. One conspicuous feature in Figure 3 (top panel) is that object switch costs on trials with n ⫽ 2 became extremely small toward the end of practice, whereas they remained substantial for higher levels of n. This could mean that the focus of attention was actually expanded to hold up to two digits. A series of t tests comparing switch and no-switch RTs for n ⫽ 2 in each session revealed significant object-switch costs in all sessions (minimum t ⫽ 2.83, p ⫽ .03) except Session 8, t(7) ⫽ 1.90, p ⫽ .1. Although diminished, object-switch costs did not disappear through practice even for n ⫽ 2. The paradigm used here allows not only deconfounding set size and object switch condition but also set size and lag of access. By lag of access, I mean the number of intervening stimuli until a previous stimulus must be accessed from memory again. In the traditional n-back task, as well as the version used by Verhaeghen et al. (2004), lag of access always equals n ⫺ 1. In the present experiment, lag and n varied independently among the switch probes because the new column for the probe was selected at random. I classified object-switch RTs within each session and level of n into four categories of lag, 1, 2, 3, and 4 or higher. Mean RTs in these categories were submitted to an ANOVA with session (10), set size (4), and lag (4) as variables. This analysis revealed a significant linear effect of set size, F(1, 7) ⫽ 8.37, p ⫽ .03, partial 2 ⫽ .58; a significant linear effect of lag, F(1, 7) ⫽ 46.02, p ⫽ .001, partial 2 ⫽ .86; and an interaction of the two variables, F(1, 7) ⫽ 9.16, p ⫽ .02, partial 2 ⫽ .60. These effects are displayed in Figure 4 (top panel), together with no-switch RTs (i.e., lag ⫽ 0) for comparison. In addition, the already known main effect of session became significant. Session interacted with set size, F(1, 7) ⫽ 10.40, p ⫽ .02, partial 2 ⫽ .63, but not with lag(F ⬍ 1). The three-way interaction just missed the significance criterion, F(1, 7) ⫽ 5.09, p ⫽ .07, partial 2 ⫽ .46. This analysis shows that a substantial part of the effect of n on RTs in traditional n-back tasks, though not all of it, is due to lag of access. The increase of RTs with lag and its interaction with set size matches the pattern found in previous experiments with an arithmetic memory-updating task (Oberauer, 2003a). One potentially important difference is that in the arithmetic updating task there were no lag effects with a memory set size of two. Here, the linear effect of lag was significant even for the trials with set size two when tested separately, F(1, 7) ⫽ 9.13, p ⫽ .02, partial 2 ⫽ .57. Again, the lag effect did not interact with session (F ⬍ 1).
Accuracy The bottom panel of Figure 3 displays accuracy of recognition as a function of session, set size, and object-switch condition. In the absence of an object switch, accuracy was at ceiling, and therefore no-switch probes were not analyzed statistically. For probes involving an object switch, accuracy was considerably lower than for no-switch probes, and it declined with set size (2 to 5). Practice improved overall accuracy, but it did not diminish the set-size effect. This was confirmed by an ANOVA of accuracy on the switch probes with session (10), set size (2–5), and probe type (2) as variables, summarized in Table 3. This ANOVA also revealed a strong effect of probe type that interacted with set size. As shown in Figure 5, errors were more frequent, and increased more
203
Figure 4. Effects of lag of access for set sizes 2 through 5, averaged over sessions. Top: Reaction times. Bottom: Proportion of correct recognition decisions. Lag corresponds to the number of intervening stimuli between the current and the last stimulus in a given column; a lag of 0 represents a no-switch probe, lags ⬎ 0 represent switch probes; lag 4⫹ is the average of all lags ⬎ 3. Error bars represent 95% confidence intervals for withinsubject comparisons computed by the method of Bakeman and McArthur (1996).
over set size, with positive probes than with negative probes. One explanation for this is that participants attempt to bring the last digit in the relevant column into the focus of attention and then compare the new digit to it. Failures in accessing a new digit in working memory often result in retrieving a wrong digit into the focus— either an older digit in the relevant column or a digit from one of the irrelevant columns. This digit has a chance probability of matching the probe of only 1/9, so in most cases participants will respond “no” after retrieving the wrong digit. This is the correct response to negative probes but constitutes a miss with positive probes. Therefore, errors on positive probes are more
OBERAUER
204
Table 3 Analysis of Variance of Accuracy of Switch Probes by Session, Set Size, and Probe Type, Experiment 1 Source of variance
F
p
Partial 2
Session (linear) Set size ⫽ n (linear) Probe type Session ⫻ Set Size Session ⫻ Probe Type Set Size ⫻ Probe Type Session ⫻ Set Size ⫻ Probe Type
9.15 219.27 33.65 1.41 19.77 132.88 1.74
0.02 ⬍.001 .001 .28 .003 ⬍.001 .23
.57 .97 .83 .17 .74 .95 .20
Note. dfs ⫽ 1, 7.
frequent, increasingly so with higher set size because the probability of access failures increases with memory load. Effects of lag of access could also be investigated for accuracy as the dependent variable. An ANOVA with session (10), list length (4), and lag (4) revealed a main effect for the linear contrast of set size, F(1, 7) ⫽ 49.13, p ⬍ .001, partial 2 ⫽ .89; a main linear effect of lag, F(1, 7) ⫽ 19.95, p ⫽ .004, partial 2 ⫽ .77; and an interaction of the two linear contrasts, F(1, 7) ⫽ 7.71, p ⫽ .03, partial 2 ⫽ .56. The lag effect interacted with session, F(1, 7) ⫽ 14.15, p ⫽ .009, partial 2 ⫽ .70, but the set-size effect did not (F ⫽ 1.5). The pattern of lag effects, shown in the bottom panel of Figure 4, matches that observed on RTs: Performance decreased with longer lags of access, and this decrease was steeper for larger set sizes. Over sessions the slope of accuracy over lag flattened; this can be interpreted as a side effect of the general increase of accuracy through practice. Different from the analysis of RT data, the effect size of set size was larger than that of lag on accuracy. Generalizing to the standard n-back task, this implies that the smaller part of the effect of n on accuracy can be attributed to lag of access, whereas the larger part of the effect is due to genuine memory load.
and its qualitative change over practice from a step function to a linear function, was reflected exclusively in effects on tau when distribution parameters were analyzed. The finding that set-size affects largely or exclusively tau is in line with previous research conducted with the Sternberg paradigm (Hockley, 1984). Hockley took this as evidence for parallel access to list elements in the Sternberg task. A serial scanning model would imply a set-size effect mainly on mu because with every new element in the set, an additional comparison is inserted that should shift the whole distribution upward. In line with Hockley’s analysis, Verhaeghen et al. (2004) interpreted their findings as evidence for parallel, capacity-limited access to digits held in the focus of attention. This is plausible for the continuous increase of tau over n in the 2–5 range early in practice and in the 1–5 range late in practice. It is problematic for the large step in RT from n ⫽ 1 to n ⫽ 2 early in practice. Verhaeghen et al. interpreted this step as reflecting the additional time it takes for a still narrow focus to switch between items when n exceeds 1. Focus switching is an additional process inserted in trials with n ⬎ 1, and this should be reflected in an increase of mu. To investigate this issue further, I fitted ex-Gaussian functions to RT distributions of individual participants separately for each session, level of n, and object switch condition. Different from Verhaeghen et al. (2004), I included only positive probes because negative probe RTs reflect the combined times of two processes, the recognition decision and memory updating, whereas positive probes reflect only the recognition decision. Lumping the two probe types together could distort the RT distribution. Only RTs of correct responses were included in the distributions. The number of data points for each distribution ranged from 84 to 101 (M ⫽ 92) for n ⫽ 1 and from 21 to 52 (M ⫽ 43) for n ⬎ 1. For comparison, I also analyzed RT distributions of positive and negative probes together, but this did not change the results in any
Ex-Gaussian Decomposition of Reaction Time Distributions Verhaeghen et al. (2004) analyzed not only mean RTs but also individual participants’ RT distributions by fitting an ex-Gaussian function to them. The ex-Gaussian is a convolution of an exponential and a Gaussian normal distribution and has been shown to provide good descriptive fits to empirical RT distributions. The ex-Gaussian is determined by three parameters: Mu and sigma are the mean and the standard deviation of the normal distribution, respectively, and tau is the mean of the exponential distribution, which also governs its variance. Descriptively, mu and sigma control the leading edge of the ex-Gaussian distribution, whereas tau mainly affects the extension of the tail. Theoretically, increases in mu can be expected when an additional process is inserted into a chain of processes (Hockley, 1984) or when participants move to a more conservative speed–accuracy strategy (Spieler, Balota, & Faust, 2000). Increases in tau can be expected when a mixture of easy and difficult trials is extended by more difficult trials (Hockley, 1984) or when the rate of information processing is reduced in an otherwise unchanged chain of processes (Spieler et al., 2000). Verhaeghen et al. (2004) found that the effect of n on mean RT,
Figure 5. Accuracy on positive and negative probes by set size (n) and object switch condition, averaged over sessions. Error bars represent 95% confidence intervals for within-subject comparisons computed by the method of Bakeman and McArthur (1996).
EXPANDING THE FOCUS OF ATTENTION?
substantive way.2 Fits were computed with the QMPE software of Heathcote and Brown (Cosineau, Brown, & Heathcote, 2004; Heathcote, Brown, & Mewhort, 2002) with the maximum number of quantiles option. The mean estimated parameters are displayed by session, n, and object-switch condition in Figure 6. It is obvious that all three parameters reflect the same effects as the mean RTs: They declined with practice, increased with n, and showed large objectswitch costs. Moreover, object-switch costs increased with n, but did not change with practice. The results from ANOVAs confirming this overall pattern are summarized in Table 4. Further analyses were conducted to zoom in on contrasts of particular interest. In the first session, there was a significant increase in all three parameters from n ⫽ 1 to the switch probes of n ⫽ 2, t(7) ⫽ 6.1, 2.7, and 3.9 for mu, sigma, and tau, respectively. The linear trend over n from 2 to 5 for switch probes was not significant for mu, F(1, 7) ⫽ 3.69, p ⫽ .10, partial 2 ⫽ .35; similarly, for sigma and for tau, both F ⬍ 1. In the last session, the linear increase over n (2 to 5) for switch probes became significant for mu, F(1, 7) ⫽ 11.86, p ⫽ .01, partial 2 ⫽ .63, but not for sigma, F(1, 7) ⫽ 3.57, p ⫽ .10, partial 2 ⫽ .34, nor for tau, F(1, 7) ⫽ 2.46, p ⫽ .16, partial 2 ⫽ .26. In sum, different from what Verhaeghen et al. (2004) found, the effects on mean RT were reflected to about equal degrees in all three parameters of the ex-Gaussian distribution.
Discussion The purpose of this experiment was to replicate as closely as possible the experiment of Verhaeghen et al. (2004) with a paradigm that affords measuring object-switch costs unconfounded with memory set-size. The replication was successful with regard to the critical features of the data: Aligning the no-switch RT for n ⫽ 1 with the switch RTs for the 2–5 range, as done in the study of Verhaeghen et al., we observed a step function of RTs over n at the beginning of practice, with a large increase from n ⫽ 1 to n ⫽ 2 and no decrease thereafter. With practice, this gradually turned into an approximately linear function. This is the qualitative pattern of data that Verhaeghen et al. interpreted as evidence for an expanding focus of attention (see Figure 7 for a direct comparison). Nonetheless, there were reliable object-switch costs even after 10 sessions of practice for all set sizes larger than 1. Object-switch costs are one important piece of evidence for the existence of a focus of attention in working memory. Therefore, we must conclude that the focus of attention selects a single digit from the memory list for comparison and needs time to switch to another digit in the list. This does not change qualitatively over practice, implying that the focus of attention is not expanded through practice, at least not the amount of practice investigated here and in the previous experiment by Verhaeghen et al. (2004). The ex-Gaussian decomposition of RT distributions revealed a different picture from that obtained by Verhaeghen et al. (2004). Whereas they found effects of n only on tau, I found parallel effects of both set size (n) and object switch (as well as session) on all three parameters. Regarding the effect of n, the difference could be explained by different speed–accuracy trade-off strategies of participants in the two experiments: In the context of the diffusion model (Ratcliff, 1978), speed–accuracy tradeoff is determined by the separation of the decision boundaries for acceptance versus
205
rejection of a probe. Spieler et al. (2000) have demonstrated through simulation that a change in the separation of decision boundaries in the diffusion model mainly affects the mu parameter of an ex-Gaussian function fit to the simulated data. If we accept the diffusion model as a reasonable model of recognition decisions in the present paradigm, the effect of n on mu observed here could be explained by assuming that participants adapted their decision boundaries (and thereby their speed–accuracy tradeoff settings) to the perceived difficulty of the task. With larger levels of n, the task is arguably perceived as being more difficult and therefore might motivate a more careful strategy. One problem of this explanation, however, is that a more conservative speed–accuracy criterion should also affect the no-switch RTs in the blocks with n ⬎ 1, so that mu should increase with n for the no-switch probes, too. This was not the case. The speed–accuracy tradeoff account also leaves unexplained why I found massive effects of object switching and of the contrast between n ⫽ 1 and n ⫽ 2 (switch probes), on mu and sigma, whereas Verhaeghen et al. did not find this for the latter contrast. As argued above, object switching is best explained as reflecting an additional process of switching the focus of attention, and this should generate effects on mu and sigma. Therefore, the present results are in line with theoretical expectations on the basis of a narrow focus of attention. It is the results of Verhaeghen and colleagues that create a difficulty: It looks as if their participants did not switch the focus of attention between digits even in the first session—if they had done this, the step from n ⫽ 1 to n ⫽ 2 should have been reflected in an effect on mu. What participants might have done instead remains mysterious. The results of the present experiment are well explained within the three-layer framework of working memory (Oberauer, 2002). From the first to the last session, participants attempt to hold n digits in the region of direct access, binding each digit to its vertical spatial position, to its color, or both. Through this binding, the position or color of each new stimulus can be used as a cue to selectively access the corresponding digit from the current memory set for comparison. This means that the focus of attention is moved to the digit bound to the current position or color. This digit is then compared with the current stimulus and (in case of a negative probe) replaced by it. Replacement means that the old digit value is unbound from its position or color (and thereby removed from the direct-access region) and the new digit is bound to it. The region of direct access has limited capacity, so that with higher levels of n, the bindings become increasingly unstable. This leads to slower access to individual digits, resulting in increased object-switch costs, and it leads to access failures, resulting in errors (mostly misses) on switch probes. No-switch probes are much less affected by n because no new retrieval from the directaccess region is required, given that the relevant item for comparison is already in the focus of attention. The effect of n on no-switch RTs in the present experiment showed a marked discontinuity; there was an increase in RTs only from n ⫽ 1 to n ⫽ 2 and no increase (possibly even a decrease) thereafter. A similar pattern was observed once before in an experiment with an arithmetic task that required selective access to 2
The only difference in the outcome of statistical tests was that the main effect of set size did not become significant for tau.
206
OBERAUER
Figure 6. Parameters of the ex-Gaussian function fit to reaction time distributions for mu (top), sigma (middle), and tau (bottom). Notice the different scale for sigma. Error bars represent 95% confidence intervals for within-subject comparisons computed by the method of Bakeman and McArthur (1996), separately for each session.
EXPANDING THE FOCUS OF ATTENTION?
207
Table 4 Analyses of Variance of Ex-Gaussian Parameters by Session, Set Size, and Object-Switch Condition, Experiment 1 mu
sigma
Source of variance
F
p
Partial r
Session (linear) Set size ⫽ n (linear) Object switch Session ⫻ Set Size Session ⫻ Object Switch Set size ⫻ Object Switch Session ⫻ Set Size ⫻ Object Switch
56.59 22.70 102.39 1.90 12.53 48.30 0.02
⬍.001 .002 ⬍.001 .21 .009 ⬍.001 .89
.89 .76 .94 .21 .64 .87 .00
2
tau
F
p
Partial r
9.96 6.94 87.79 8.57 1.13 10.42 4.22
.016 .03 ⬍.001 .02 .32 .014 .08
.59 .50 .93 .55 .14 .60 .38
2
F
p
Partial r2
10.83 10.60 72.47 0.30 5.26 9.85 0.00
.013 .014 ⬍.001 .60 .056 .016 .98
.61 .60 .91 .04 .43 .59 .00
Note. dfs ⫽ 1, 7.
one out of n digits but no updating of working memory (Oberauer, 2003a, Experiment 1). In two other experiments that involved updating of working memory in the context of otherwise similar tasks, RTs of no-switch trials increased continuously over set sizes up to four (Oberauer, 2003a, Experiment 2; Oberauer, Wendland, & Kliegl, 2003). Comparison of these experiments might suggest that updating is important for continuous set-size effects on noswitch trials. In the present experiment, updating was required on negative but not positive probes. There was, however, no trace of an interaction between probe type and set size or of an interaction of probe type, set size, and object switch (see Table 2), implying that set-size effects on no-switch trials were the same regardless of whether updating was required for a particular probe. The updating requirement therefore is unlikely to explain the differences between experiments regarding the set-size effects on no-switch trials. I believe that set-size effects on no-switch RTs arise because with larger set sizes more elements in the direct-access region, but outside the focus of attention, compete with the currently focused
element for being selected as the object of processing (Oberauer & Go¨the, in press). Similar to selective attention in perception (Eriksen & St. James, 1986), selective attention to an element in working memory is not perfect, meaning that some distractor information leaks into the processing of the target element and generates competing outputs, thereby slowing down overall processing. In the present paradigm, however, the element currently in the focus of attention receives the extra benefit of having been presented as the last stimulus, whereas the competing elements were not recently supported by perceptual input. This could make it easier in the present task, compared with tasks used in other experiments, to shield the focus of attention against distractors, thereby minimizing set-size effects on no-switch RTs in the range of n ⫽ 2 to 5. The increase in no-switch RTs from n ⫽ 1 to n ⫽ 2 could be explained by the qualitative change in task demands. With n ⫽ 1, participants would not need to engage the direct-access region at all, they could just keep the current value in the focus of attention
Figure 7. Comparison of reaction time (RT) data from the present Experiment 1 (E1; n ⫽ 1 and switch probes from n ⬎ 1) and from Verhaeghen et al. (2004).
OBERAUER
208
and compare it with every new stimulus. With n ⬎ 1, digits need to be bound to their contexts (spatial position or color) and accessed selectively through that context. If we assume that participants establish these bindings for every new stimulus, the extra time this costs can explain why no-switch RTs increase from n ⫽ 1 to n ⫽ 2. There are two aspects of the present data and those of Verhaeghen et al. (2004) that pose difficulties for my interpretation. One is the flat function of switch RTs over n in the 2 to 5 range in the first session. In previous research, I have used set-size effects on RTs as a diagnostic for identifying memory sets held in the direct-access region, as opposed to the activated part of LTM. The absence of set-size effects therefore seems to suggest that in the first session the digits outside the focus of attention are not held in the region of direct access but in activated LTM. The flat slope of switch RTs over set size contrasts with findings from other paradigms in which sets of items that need to be accessed consistently generated positive slopes (Oberauer, 2001, 2002, 2005; Oberauer & Go¨the, in press). A lack of statistical power alone cannot provide a satisfactory explanation for why the slope of switch RTs was flat in the first session, because a similar flat function has been observed repeatedly with the modified n-back task (Verhaeghen & Basak, 2005). It is worth noting that even in the first session the interaction of set size and object switch was significant, that is, object-switch costs increased with set size. This happened because RTs on no-switch probes slightly declined over n (2–5). It looks as if, compared with later sessions, some factor in the first session depressed the slope of RTs over n for both switch and no-switch probes. I follow up on this impression in Experiment 2. A second aspect of the present data that remains puzzling is the diminution through practice of object-switch costs for n ⫽ 2. Although still significant, they became extremely small compared with those for higher levels of n. This leaves open the possibility that at least some participants managed to expand their focus of attention to include two digits. If this is so, it could be a hint that maybe the focus of attention could be expanded even further with more practice. In Experiment 3, therefore, a subset of the present participants received an additional 10 sessions of practice to investigate this possibility.
Figure 8. Schematic illustration of how the power law of practice leads to lower average reaction times (RTs) for two blocks in the middle of a session (n ⫽ 5) than for one block at the beginning and one block at the end of a session (n ⫽ 1). Data points are generated by the function RT ⫽ 1,000 b⫺0.2, with b ⫽ block number.
were of equal difficulty, the power law of practice would make the average RT of the two blocks with n ⫽ 5 lower than that of the two blocks with n ⫽ 2. The depression of RTs in blocks with higher n due to the power law could have compensated their increase due to memory load, resulting in the flat slope that was obtained with switch probes. With no-switch probes, the effect of within-session practice might be responsible for the trend toward a negative slope over n from 2 to 5. Experiment 2 therefore tested a new sample of participants with one session of the present n-back task in which the blocks are counterbalanced according to a Latin square. This ensures that every set size occurs equally often at every serial position and thereby, on average, reflects equal amounts of previous practice.
Experiment 2 Method One reason why the slopes of RT over n were depressed in Session 1 of Experiment 1, as well as in other experiments of Verhaeghen et al. (2004), could be the order of blocks with different levels of n within sessions and its interaction with practice effects. These experiments all used a mirror schema by which n first increased over blocks and then decreased. Such a schema counterbalances order effects as long as they are linear. With nonlinear effects of order, however, a confound of order effects with n might occur. Effects of practice are captured well by a power function, which is decidedly nonlinear, and the deviation from nonlinearity is especially marked at the beginning of the curve. Figure 8 illustrates how the decline of RTs according to a power function within the first session could lead to an artificial reduction of the slope of RT over n. The highest level of n is measured in the middle of the session; due to the decelerating decline of the power function, the middle of the x-axis corresponds to a function value below the average of all values. If all blocks
Participants Twenty psychology students from the University of Potsdam participated in a single session in exchange for course credit. None of them had participated in Experiment 1.
Materials and Procedure Task and procedure were identical to those of Experiment 1 with the exception that the 10 test blocks were ordered according to a Latin square, and practice trials were pooled at the beginning of the session. Four participants started with each of the five levels of n in their first test block. Two of them proceeded from there in ascending order of n (with order wrapped around from n ⫽ 5 to n ⫽ 1) for the first five blocks, followed by the mirror-reverse descending order for the remaining five blocks (e.g., 3, 4, 5, 1, 2, 2, 1, 5, 4, 3). The other two participants assigned to each starting value of n proceeded through a descending order for the first five blocks, followed by the mirror-reversed ascending order (e.g., 4, 3, 2, 1, 5, 5, 1, 2,
EXPANDING THE FOCUS OF ATTENTION? 3, 4). The whole set of test blocks was preceded by five practice trials, one for each level of n, in ascending order for each participant.
Results and Discussion Data were treated as in Experiment 1. Mean RTs are displayed in the top panel of Figure 9, and mean accuracy in the bottom panel of Figure 9. The improved counterbalancing of order and n had the expected effect: Switch RTs increased with n in the range from 2 to 5, as confirmed by a significant linear contrast, F(1, 19) ⫽ 15.04, p ⫽ .001, partial 2 ⫽ .45. The no-switch RTs show no sign of a decline over n from 2 to 5 as they had in Experiment 1, instead they tended to increase as well, but this linear trend was not significant (F ⫽ 1.2). The jump from n ⫽ 1 to the no-switch condition of n ⫽ 2 was significant, F(1, 19) ⫽ 58.00, p ⬍ .001,
209
partial 2 ⫽ .75. Switch costs were significant, F(1, 19) ⫽ 92.01, p ⬍ .001, partial 2 ⫽ .83, and they increased with n, as shown by a significant interaction of the linear contrast over n with the switching factor, F(1, 19) ⫽ 21.86, p ⬍ .001, partial 2 ⫽ .54. The RT data in this experiment look strikingly similar to previous results with an arithmetic memory-updating task (Oberauer, 2003a, Experiment 1): They increased from memory demand 1 to 2, with little or no further increase over higher memory demands in the no-switch RTs but with a substantial, approximately linear increase in switch RTs. This pattern is predicted by the three-layer framework, assuming that a single digit from working memory is held in the focus of attention at any time and that the remaining ones are held in the region of direct access. The switch costs are evidence that the digit processed last has a privileged status, making it easier to access it again than to access another one. The increase in RTs over n on switch probes are to be expected if all digits are held in the capacity-limited component of working memory but not if all digits outside the focus are removed into activated LTM, as Verhaeghen et al. (2004) have assumed. The data from Experiment 2 display a pattern similar to those from the later practice sessions in Experiment 1, suggesting that there is no qualitative change in working memory structure or processing over practice. The impression of a qualitative change was in part due to the flat slope of switch RTs over n from 2 to 5 in the first training session, which then turned into a positive slope in later sessions. Experiment 2 has shown that this flat slope disappears when the order of levels of n is carefully counterbalanced to remove a subtle confound with a nonlinear practice effect. If practice follows a power law, the nonlinear shape of this function is most pronounced at the beginning of practice, and this can explain why the observed RT slope was flattened in the first session of Experiment 1 but not in later sessions. The same explanation could apply to the experiment of Verhaeghen et al. (2004).
Experiment 3 The final experiment follows up on the observation that object-switch effects diminished substantially with practice on n ⫽ 2. To investigate whether object-switch costs disappear completely for this level of n, and whether they might disappear even for larger levels of n with more practice, we invited the participants from Experiment 1 again to complete another 10 sessions of practice. We were able to recruit 4 participants again for this extension.
Method Four of the participants of Experiment 1 took part again 2 to 5 months after completion of the first 10 sessions of practice in exchange for either course credit or 6 Euros (approximately $7.50) per session. They repeated exactly the same procedure as in Experiment 1 for another 10 sessions.
Results and Discussion Figure 9. Results of Experiment 2. Top: Reaction times (RTs). Bottom: Proportion of correct responses. Error bars represent 95% confidence intervals for within-subject comparisons computed by the method of Bakeman and McArthur (1996).
Reaction times were treated as in Experiment 1. Mean RTs and accuracies are plotted in Figure 10. It is apparent that practice has reached asymptote by the second half of this experiment. As toward the end of Experiment 1, object switch costs were very
210
OBERAUER
Figure 10. Performance in the n-back task by set size (n) and object-switch condition for Sessions 11 through 20 (Experiment 3). Top: Reaction times (RTs). Bottom: Accuracy. Error bars are 95% confidence intervals for within-subject comparisons within sessions.
small for n ⫽ 2, but they remained substantial for larger levels of n. An ANOVA focusing on n ⫽ 2 only, crossing session (10) with object switch condition (2), revealed a significant linear trend of session, F(1, 3) ⫽ 13.82, p ⫽ .03, partial 2 ⫽ .82. The main effect of object switch failed significance, F(1, 3) ⫽ 5.42, p ⫽ .10, but with partial 2 ⫽ .64, it had a substantial effect size. The interaction was not significant (F ⫽ 1.2). The difference between switch and no-switch conditions was 70 ms, averaged across Sessions 11 to 20, and remained at that level very consistently across sessions,
with a range of 56 to 108 ms. The lack of statistical significance, therefore, is probably due to the very small sample size (N ⫽ 4). More powerful tests can be conducted for individual participants. In these analyses, individual RTs of each participant are treated as cases, and their intraindividual variance is used for the error term. I conducted an ANOVA with session (10) and object switch condition (2) for each participant, again using only RTs from n ⫽ 2. In all four cases, the main effect of object switch was significant, with F ratios ranging from 31.20 (dfs ⫽ 1, 1805) to 562.90 (dfs ⫽
EXPANDING THE FOCUS OF ATTENTION?
1, 1814), mean effects ranging from 30 ms to 160 ms, and partial 2 values ranging from .017 to .237.3 To summarize, even after 20 sessions of practice, at a point where no further improvement of performance was noticeable, object-switch costs for n ⬎ 2 were substantial. Object switch costs for n ⫽ 2 were noticeably smaller but persistently refused to disappear altogether. We could take the remaining object-switch costs at n ⫽ 2 as an estimate for the minimum time it takes to switch the focus of attention from one item to another. There is no reason why practice should not speed up the movement of the focus to a degree that switching takes less than 50 ms. The fact that a dramatic reduction on object-switch costs was only found for n ⫽ 2, however, makes this interpretation less than perfectly convincing. An alternative explanation is that at n ⫽ 2, participants focused the relevant item only in a subset of cases, so that in the remaining cases of switch probes, the focus was not actually switched to the new object, and no switch costs accrued. The focus could instead have remained on the previous item or could actually have expanded to hold both items. This notion raises the question of how participants could compare the new stimulus selectively with the appropriate item in working memory when this item was not selected by the focus of attention. One possible answer is that participants can perform the 2-back task with reasonable accuracy without doing a selective comparison. If they compared each new stimulus unselectively to both items currently held in working memory, they would still correctly reject all probes that match neither of these two items and correctly accept probes that match the item in the corresponding, currently relevant column. Only when the probe matches the item in the other, currently irrelevant column, would this strategy wreak havoc. With n ⫽ 2, however, the probability that this happens is small, though it increases with n.4 Participants can therefore rely on global matching with relatively high confidence when n is low, but they increasingly risk false alarms with higher levels of n. It would therefore be a reasonable strategy to do without a focus switch occasionally in the n ⫽ 2 condition but less so in the conditions with higher n. If this is the case, we should see reduced accuracy and increased RTs in the few cases where the probe matches an irrelevant, but not the relevant, item. I therefore reanalyzed the data from Experiments 1 and 3 for a comparison of two kinds of to-be-rejected probes: those that did not match any item currently held in working memory and those matching an irrelevant item in working memory. I call the first category new probes and the second category intrusion probes. The RTs on new and intrusion probes from Experiment 1 were analyzed through an ANOVA with session, n(2–5), object switch, and probe type (new vs. intrusion) as variables. Rejecting intrusion probes took significantly longer than rejecting new probes, F(1, 7) ⫽ 11.80, p ⫽ .01, partial 2 ⫽ .64. This effect decreased with n, as confirmed by an interaction of probe type with the linear contrast of n, F(1, 7) ⫽ 13.40, p ⫽ .01, partial 2 ⫽ .69. The RT differences between new and intrusion probes were 79, 78, 36, and 12 ms for successive levels of n. This interaction of probe type with n did not change over session (F ⬍ 1 for the three-way interaction). The probe-type effect was larger for switch than for no-switch probes, F(1, 7) ⫽ 8.60, p ⫽ .03, partial 2 ⫽ .59. An analogous ANOVA of accuracies also revealed worse performance on intrusion probes than on new probes, F(1, 7) ⫽ 22.80, p ⫽ .003,
211
partial 2 ⫽ .79, and there was a slight trend for this effect to decrease with n, F(1, 7) ⫽ 5.00, p ⫽ .035 (one-tailed), partial 2 ⫽ .46. Differences in accuracy between the two probe types were .051, .048, .048, and .036, for successive levels of n. Again, the probe type effect was larger for switch than for no-switch probes, F(1, 7) ⫽ 11.20, p ⫽ .02, partial 2 ⫽ .65. The same pattern was observed in Experiment 3. Intrusion probes were rejected more slowly than new probes, F(1, 3) ⫽ 27.40, p ⫽ .01, partial 2 ⫽ .90. Again, this effect decreased with larger levels of n (57, 47, 37, and 0 ms, respectively), as confirmed by a significant interaction of probe type with the linear trend of n, F(1, 3) ⫽ 27.1, p ⫽ .01, partial 2 ⫽ .90. In the corresponding analysis of accuracy data, the main effect of probe type was significant only with a one-tailed test, F(1, 3) ⫽ 6.5, p ⫽ .04, partial 2 ⫽ .18 (mean difference ⫽ .046), and its interaction with n was not significant (F ⬍ 1). Taken together, there is some evidence supporting the speculation that participants engaged in a nonselective comparison strategy on a subset of probes in the n ⫽ 2 condition, whereas they did not use this strategy (or at least used it to a lesser degree) with higher ns. This can explain why object-switch costs became extremely small for n ⫽ 2. For a direct test of this idea, one would have to repeat the experiment with a higher proportion of intrusion probes. This should discourage the global matching strategy and force participants to focus on the relevant item in each case. Object switch costs should then remain higher than in the present experiment after practice with n ⫽ 2.
General Discussion The results of the three experiments together make a strong case against the hypothesis that the focus of attention is expanded from one to about four elements through 10 hr of practice or less. First, the most direct indicator for the existence of a single-object focus, the costs of switching from one object in working memory to another, did not disappear through practice. Second, the flat slope of (object-switch) RTs over n ⫽ 2 to n ⫽ 5 at the beginning of practice is likely to be an artifact from confounding n with the nonlinear component of the practice effect within the first session. Hence, the qualitative change in this slope over practice, which Verhaeghen et al. (2004) took as evidence for an expanding focus, is probably not real. With an improved counterbalancing scheme, there was an increasing slope even in the first session of testing. I can think of two possible ways in which the present data could be reconciled with the assumption that the focus of attention expands through practice. The first makes use of the lag effects 3 The object-switch variable accounted for a smaller portion of variance in the analyses of individual participants than in the conventional withinsubjects ANOVA because the total variance is much larger, including the variance of individual RTs of each participant, which is averaged out in the conventional analysis. 4 The algorithm generating the trials draws all digits randomly and independently of each other. Therefore, the probability that a probe matches an irrelevant item in working memory, given that it does not match the relevant item, is 1/9 for each irrelevant item. It follows that the probability that a to-be-rejected probe does not match any of the irrelevant items equals (1-1/9)n⫺1, or .89, .79, .70, and .62 for n ⫽ 1, 2, 3, and 4, respectively.
212
OBERAUER
demonstrated in Experiment 1 (virtually the same effects were found in Experiments 2 and 3 but not reported for the sake of brevity). RTs continuously increased and accuracy continuously decreased with increasing lag. These trends point to an effect of lag of access that goes beyond the effect of object switching. The source of this effect could be time-based decay of traces in working memory or retroactive interference. Object switching is necessarily confounded with lag because a no-switch reaction always has a lag of zero, whereas switch reactions have lags of one or more. This makes it likely that part or even all of the difference between no-switch and switch RTs (and accuracies) is due to whatever causes the lag effect (i.e., decay or interference). The extreme version of this argument is that object switch costs are nothing but the early part of a continuous lag effect, caused by gradual degradation of memory traces and have nothing to do with switching a focus of attention. Such a view could be put forward by Cowan (Cowan, 2005, p. 161), who argued that items within his focus of attention can vary in their degree of accessibility. This extreme version could probably explain the present data, as well as those of Verhaeghen et al. (2004), but has difficulty accounting for the results of McElree and Dosher (1989), who showed a qualitative difference in processing rates for access to the last item of a list and access to earlier items by plotting complete speed accuracy tradeoff curves (for an extension of this work to the n-back task, see McElree, 2001). A more moderate version of the argument, however, is easier to defend. We might assume that part of the RT difference between n ⫽ 1 and higher levels of n is due to differences in lag, whereas the other part is due to a genuine switch of the focus of attention. The same could be said for object-switch costs within a level of n. Further, we could assume that over practice, the focus expands and does not have to switch from item to item any more. As a consequence of this, the focus-switch component is reduced to zero, but the lag component remains. As a result, object-switch costs are still measured after practice, but they reflect only lag effects and no costs of genuine focus switching. There is nothing in the present data to rule out this story, but there is also nothing to support it. One way to decisively test it is to measure speed– accuracy tradeoff curves by the speed–accuracy trade-off technique (McElree & Dosher, 1989) after extensive practice. It is worth noting, however, that the participants of McElree and Dosher (1989) and McElree (2001) already received several hours of practice because measuring speed–accuracy tradeoff curves requires several hours of testing. This amount of practice did not interfere with finding evidence for a focus of attention limited to a single item in these studies. If the focus of attention had been expanded through practice in McElree and Dosher’s studies, it would have been difficult for them to obtain evidence for a single-element focus. Additional evidence against the notion that object-switch costs are just the beginning of a monotonous increase of RTs with lag of access comes from a series of experiments by Schwager (2005). Using paradigms similar to Garavan’s (1998), Schwager found RTs increasing from lag ⫽ 0 to lag ⫽ 1 and slightly decreasing thereafter. These findings constitute a dissociation of object-switch costs (i.e., the RT increase from lag ⫽ 0 to lag ⬎ 0) and lag effects within switch RTs (i.e., RTs with lags ⬎ 0). A second way to salvage the notion of an expanding focus is to argue that the focus of attention can be expanded when working on
the task of Verhaeghen et al. (2004) but not when working on the more complex version used here. There is no logically compelling rebuttal of this argument, but it does not strike me as convincing. There is no theoretical reason why the focus of attention should be expandable in one version of the n-back task but not in a similar, though more difficult, version, even with twice the amount of practice. One could point to three differences between the present data and those of Verhaeghen et al. (2004) to support the point that the experiments reflect different processes. None of them, I will argue, strengthens the hypothesis that in Verhaeghen et al.’s task the focus of attention was expanded from one to four elements over practice. First, the error rates and RTs for switch probes in the range of n ⫽ 2 to n ⫽ 5 were much larger in my experiment than in that of Verhaeghen et al. (2004; see Figure 7 for the RT comparison). Switching to a new element in working memory was easier in the regular n-back task than in the random task used here; the difference appeared in the first session and hence was not due to practice. One explanation could be that in the regular n-back task the target of each comparison was predictable, whereas it was unpredictable in the random task version. Predictability of object switches and their targets, however, had no effect on switch cost in a previous study with a memory-updating paradigm (Oberauer et al., 2003), so it is unlikely to be responsible for the dramatic differences in switch RTs between the regular and the random n-back task. I think it is more likely that the regular n-back task was made easier by the fact that access to each new digit was supported by both spatial and temporal order cues, which were perfectly correlated. In addition to spatial position and color, participants could use mechanisms for maintaining temporal order to retrieve each upcoming digit, for instance temporal context representations (Burgess & Hitch, 1999) or a primacy gradient that codes temporal order by a descending activation gradient from the first to the last item (Page & Norris, 1998). Each sweep of n stimuli from left to right could be treated as a new list of digits to be recalled in temporal order. In the random task version, spatial order and temporal order of access are uncorrelated, so temporal order is useless as a retrieval cue. Previous research has shown that recall of items by spatial position is better when items are presented and recalled from left to right than when the temporal order of presentation and access is randomized (Oberauer, 2003b). A second aspect of the data of Verhaeghen et al. (2004) that was not reproduced in the present experiments is that after practice they found that RTs increased from n ⫽ 4 to n ⫽ 5 more steeply than the slope of RT over n up to 4. No such accelerated increase was observed here (see Figure 7). Verhaeghen et al. (2004) interpreted this as evidence for a focus of attention that can hold four items; with n ⫽ 5, not all items fit into the focus, so additional time would be needed for focus switching. This interpretation might be correct, and it would be compatible with my view if the direct-access region was limited to exactly four digits for most people. With a memory load of up to four, people could hold all digits in the direct-access region, but with larger loads they needed to access information in LTM. It must be noted, however, that the level of n in the Verhaeghen et al. study (and in all other n-back tasks) reflects a perfect confound of memory load and lag of access. Both factors affect RTs in the same direction, so that the accelerated increase of RT over n could be a joint product of them working together. In the present study, in contrast, n represents memory
EXPANDING THE FOCUS OF ATTENTION?
load relatively independent of lag. It is not surprising, therefore, that the patterns of switch RTs over n are not exactly the same in the two studies. Only with the design used here can the effect of memory load be isolated, and in these data there was no particularly steep increase of RTs with load from four to five (see Figure 4). A third difference is that the ex-Gaussian decomposition of RT distributions revealed effects of experimental factors on all three parameters in the present study, whereas they were confined to tau in Verhaeghen et al.’s (2004) study. This finding might be construed as evidence for the claim that the focus of attention expanded in the Verhaeghen et al. experiment, as follows: Finding effects of n only on the tau parameter suggests that they arise from a parallel search process that is slowed with increasing load on a limited capacity. Inserting an extra step, such as a focus switch, would be expected to affect mu as well (Hockley, 1984). If we accept this argument, we must apply it also to the RT jump from n ⫽ 1 to n ⫽ 2 in the first session, because this jump, too, was carried exclusively by tau in Verhaeghen et al.’s study. Doing so would lead to the conclusion that in their version of the n-back task, there was no focus switching from the beginning, and the large increase of RTs from n ⫽ 1 to n ⫽ 2 that they found has nothing to do with the focus of attention. Following through to this conclusion leaves us without a consistent story about what happened in the n-back task of Verhaeghen et al. Fortunately, there is a highly consistent explanation for the results of the present experiments, and it is based on the three-layer framework of working memory (Oberauer, 2002). At the beginning of practice, participants attempt to hold all n digits in the region of direct access. This involves binding each digit to a context representation (i.e., its spatial position or color). Whenever a new digit is displayed, the focus of attention selects the representation of the previous digit bound to the corresponding context representation and compares that digit to the new stimulus. The new digit then replaces the old digit (if they differ). When the next stimulus appears in another column, the focus of attention switches to another context representation and uses it as a cue to retrieve another digit. This switch adds an extra processing step and therefore increases mean RTs by shifting as well as expanding the RT distribution, thereby increasing both mu and tau in ex-Gaussian functions fit to the distributions. The time costs of switching the focus of attention should not be construed as the time for moving around a device, such as moving a fork-lift truck in a memory store or shifting a loupe over a sheet of paper. Instead, these time costs reflect the time to retrieve a new element into the focus of attention on the basis of its bindings to a context representation. It is only natural that this time increases with the number of candidates for selection that are held in the direct-access region (i.e., the level of n) and with the relative degradation of the digit representation to be retrieved, which increases with lag of access. Retrieval of a new digit is also the process in which most errors occur, and therefore errors are virtually absent on no-switch probes, whereas they occur on switch probes, their rate increasing with set size and lag of access. The n ⫽ 1 condition seems to enjoy a special status in that its RTs are even faster than the no-switch RTs at higher levels of n. This can be explained by noting that a 1-back task can be done without forming any bindings between digits and context representations in working memory. In other words, the task can be
213
performed by the focus of attention on its own, and the directaccess region is not needed. When n ⬎ 1, extra time is needed on no-switch probes to establish bindings between the new digit and its context representation. An alternative explanation for the increase of no-switch RTs from n ⫽ 1 to n ⫽ 2 is that it reflects the conflict that arises when the focus must selectively channel one of two digits into the comparison process. In no-switch trials, the digit to be selected is already held in the focus, but other representations in the direct-access region might nonetheless act as competitors that slow down processing. I submit that, after several hours of practice, working memory does essentially the same as at the beginning, only faster. There is little evidence in my data that people’s strategies or the configuration of their working memory undergoes any qualitative changes through practice. The most pronounced change with practice is in the object-switch costs for n ⫽ 2, which are reduced from about 350 ms to about 50 ms. It is not entirely clear why this dramatic decrease occurred for n ⫽ 2 but not for the higher levels of n. One possible explanation, supported by the analyses of intrusion probes in the context of Experiment 3, is that participants acquired a strategy for the n ⫽ 2 condition by which they often (though not always) relied on a global instead of a selective comparison for their recognition decisions. In this way, they could circumvent the need to focus exclusively on one digit for every decision. Whether this means that their focus of attention is expanded or is not used at all cannot be determined so far. A prediction from this explanation is that with a task that enforces focusing on the relevant element in every single case, object-switch costs with n ⫽ 2 should not be reduced with practice as much as was observed here.
References Baddeley, A. D. (1986). Working memory. Oxford: Clarendon Press. Bakeman, R., & McArthur, D. (1996). Picturing repeated measures: Comments on Loftus, Morrison, and others. Behavioral Research Methods, Instruments, & Computers, 28, 584 –589. Burgess, N., & Hitch, G. J. (1999). Memory for serial order: A network model of the phonological loop and its timing. Psychological Review, 106, 551–581. Couineau, D., Brown, S., & Heathcote, A. (2004). Fitting distributions using maximum likelihood: Methods and packages. Behavior Research Methods, Instruments, & Computers, 36, 742–756. Cowan, N. (1988). Evolving conceptions of memory storage, selective attention, and their mutual constraints within the human informationprocessing system. Psychological Bulletin, 104, 163–191. Cowan, N. (1995). Attention and memory: An integrated framework. New York: Oxford University Press. Cowan, N. (2001). The magical number 4 in short-term memory: A reconsideration of mental storage capacity. Behavioral and Brain Sciences, 24, 87–185. Cowan, N. (2005). Working memory capacity. New York: Psychology Press. Cowan, N., Elliott, E. M., Saults, J. S., Morey, C. C., Mattox, S., Hismjatullina, A., et al. (2005). On the capacity of attention: Its estimation and its role in working memory and cognitive aptitudes. Cognitive Psychology, 51, 42–100. Eriksen, C. W., & St. James, J. D. (1986). Visual attention within and around the field of focal attention: A zoom lens model. Perception & Psychophysics, 40, 225–240. Garavan, H. (1998). Serial attention within working memory. Memory & Cognition, 26, 263–276. Heathcote, A., Brown, S., & Mewhort, D. J. K. (2002). Quantile maximum
214
OBERAUER
likelihood estimation of response time distributions. Psychonomic Bulletin & Review, 9, 394 – 401. Hockley, W. E. (1984). Analysis of response time distributions in the study of cognitive processes. Journal of Experimental Psychology: Learning, Memory, and Cognition, 10, 598 – 615. Ku¨bler, A., Murphy, K., Kaufman, J., Stein, E. A., & Garavan, H. (2003). Co-ordination within and between verbal and visuospatial working memory: Network modulation and anterior frontal recruitment. NeuroImage, 20, 1298 –1308. McElree, B. (2001). Working memory and the focus of attention. Journal of Experimental Psychology: Learning, Memory, and Cognition, 27, 817– 835. McElree, B., & Dosher, B. A. (1989). Serial position and set size in short-term memory: The time course of recognition. Journal of Experimental Psychology: General, 118, 346 –373. Miyake, A., & Shah, P. (1999). Models of working memory: Mechanisms of active maintenance and executive control. Cambridge, England: Cambridge University Press. Oberauer, K. (2001). Removing irrelevant information from working memory: A cognitive aging study with the modified Sternberg task. Journal of Experimental Psychology: Learning, Memory, and Cognition, 27, 948 –957. Oberauer, K. (2002). Access to information in working memory: Exploring the focus of attention. Journal of Experimental Psychology: Learning, Memory, and Cognition, 28, 411– 421. Oberauer, K. (2003a). Selective attention to elements in working memory. Experimental Psychology, 50, 257–269. Oberauer, K. (2003b). Understanding serial position curves in short-term recognition and recall. Journal of Memory and Language, 49, 469 – 483. Oberauer, K. (2005). Control of the contents of working memory—A comparison of two paradigms and two age groups. Journal of Experimental Psychology: Learning, Memory, and Cognition, 31, 714 –728. Oberauer, K., & Go¨the, K. (in press). Dual-task effects in working mem-
ory: Interference between two processing tasks, between two memory demands, and between storage and processing. European Journal of Cognitive Psychology. Oberauer, K., Wendland, M., & Kliegl, R. (2003). Age differences in working memory: The roles of storage and selective access. Memory & Cognition, 31, 563–569. Page, M. P. A., & Norris, D. (1998). The primacy model: A new model of immediate serial recall. Psychological Review, 105, 761–781. Pashler, H. E. (1998). The psychology of attention. Cambridge, MA: MIT Press. Ratcliff, R. (1978). A theory of memory retrieval. Psychological Review, 85, 50 –109. Schwager, S. (2005). Selektion beim Zugriff auf mentale Objekte im Arbeitsgeda¨chtnis—Die Aufgabe entscheidet u¨ber die Details [Selection in accessing mental objects in working memory—The task decides about the details]. Doctoral dissertation, Humboldt University of Berlin. Spieler, D. H., Balota, D. A., & Faust, M. E. (2000). Levels of selective attention revealed through analyses of response time distributions. Journal of Experimental Psychology: Human Perception and Performance, 26, 506 –526. Sternberg, S. (1969). Memory scanning: Mental processes revealed by reaction-time experiments. American Scientist, 57, 421– 457. Verhaeghen, P., & Basak, C. (2005). Aging and switching of the focus of attention in working memory: Results from a modified n-back task. Quarterly Journal of Experimental Psychology. Verhaeghen, P., Cerella, J., & Basak, C. (2004). A working memory workout: How to expand the focus of serial attention from one to four items in 10 hours or less. Journal of Experimental Psychology: Learning, Memory, and Cognition, 30, 1322–1337.
Received July 19, 2005 Revision received October 4, 2005 Accepted October 9, 2005 䡲