Acceptability of ISA: Results of a large-scale web-based survey VLASSENROOT, Sven; BROOKHUIS, Karel; DE MOL, Johan; MARCHAU, Vincent; WITLOX, Frank
ACCEPTABILITY OF INTELLIGENT SPEED ASSISTANCE (ISA): RESULTS OF A LARGE-SCALE WEB-BASED SURVEY Sven VLASSENROOT, Institute for Sustainable Mobility, Ghent University, Belgium and Transport Policy and Logistics Organisation, Delft University of Technology, The Netherlands, e-mail:
[email protected] Karel BROOKHUIS, Transport Policy and Logistics Organisation, Delft University of Technology, The Netherlands and Department of Psychology, University of Groningen, The Netherlands, e-mail:
[email protected] Johan DE MOL, Institute for Sustainable Mobility, Ghent University, Belgium, e-mail:
[email protected] Vincent MARCHAU, Transport Policy and Logistics Organisation, Delft University of Technology, The Netherlands, e-mail:
[email protected] Frank WITLOX, Department of Geography, Ghent University, Belgium, e-mail:
[email protected]
ABSTRACT Several trials with different types of ISA have shown that ISA can be an efficient and effective way to reduce speed and speeding. In our research we ask the question if there will be acceptability of ISA by the public? Different methods and theories were used to distil the most relevant determinants that could influence acceptability. Based on these determinants a web-survey was held: 6370 individuals responded in Belgium (Flanders region) and 1158 persons in The Netherlands. In our questionnaire the respondents indicated that their own driving behaviour is of great influence on accidents and traffic safety, instead of environmental issues like infrastructure or even other drivers. Even more, the respondents indicated that ITS could be beneficial to support their driving behaviour. It was noted that there is a high market potential for Advanced Driving Assistance Systems (ADAS). 95% of the respondents are in favour of ISA. Seven out of then drivers want to have an informative or warning system. Three out of ten drivers wanted to go even further and choose to have a supportive or even a restricting type of ISA. Drivers would only choose for more restricting systems if the penetration level is high enough. Keywords: Acceptance, Public Support, Intelligent Speed Adaptation
th
12 WCTR, July 11-15, 2010 – Lisbon, Portugal
1
Acceptability of ISA: Results of a large-scale web-based survey VLASSENROOT, Sven; BROOKHUIS, Karel; DE MOL, Johan; MARCHAU, Vincent; WITLOX, Frank
INTRODUCTION In December 2008, the European Commission (EC) took a major step towards the deployment and use of Intelligent Transport Systems (ITS). In the Action Plan on ITS, the EC suggested a number of targeted measures and a proposal for a Directive laying down the framework for their implementation (European Commission, 2008). The main policy objective is to come to a cleaner, more (energy) efficient and safer and more secure transport and mobility. The Action Plan stated that better use should be made of the newest active safety systems and advanced driver assistance systems with proven benefits in terms of in-vehicle safety for the vehicle occupants and other road users (including vulnerable road users). One of the most promising ADAS, aimed at reducing inappropriate speed, is Intelligent Speed Assistance (ISA). ISA is an intelligent in-vehicle device that warns the driver about speeding, discourages the driver to speed, and/or prevents the driver from exceeding the speed limit [1-3]. Most ISA systems use GPS and a digital speed limit database: the position of the vehicle is determined using a GPS-receiver. The position is used to retrieve the speed limit or other information from a database. The information is then reported to the driver. ISA can enforce three types of limits: static speed limits (posted speed signs), variable speed limits (information about speed limits depending on the location, e.g. reduced speed in a sharp bend) and dynamic speed limits (information based on actual road and traffic conditions, e.g. reduced speed due to weather conditions). ISA-devices can be categorized into different types depending on how intervening (or how the information is communicated to the driver) they are in the vehicle-driving task. An informative or advisory system displays the speed to remind the driver of the changes in speed levels. A warning or open system cautions the driver if the posted speed limit at a given location is exceeded; the driver then decides whether to use or ignore this information. An intervening, supportive or half-open system gives a force feedback through the gas pedal if the driver tries to exceed the speed limit (like the active accelerator pedal). It is however still possible for the driver to overrule the counter-pressure initiated by the accelerator pedal. A mandatory, automatic control, restrictive or closed system will fully prevent the driver to exceed the speed limit; hence, the driver cannot overrule the system. Several studies and field trials have indicated that ISA reduces speed and speeding [4-6]; that ISA is effective on traffic safety [7]; that ISA is expected to be beneficial for the environment because of the estimated reduction in speed and speed variance [8]; and that ISA can lead to a more homogeneous traffic flow [9]. Although there has been no large-scale implementation of ISA yet, there have been promising initiatives in the last decades at European and national levels with respect to the development of technical feasibility frameworks (like geographical information storage, GPSaccuracy, vehicle communication, etc.) and speed limit databases [10]: it could be generally concluded that, at the European level the major technical guidelines and protocols for the feasibility and deployment of in-vehicle ITS have been developed. Within the national initiatives the focus was shifted towards the operational level, including legislations, national protocols, basic tools and field practices. th
12 WCTR, July 11-15, 2010 – Lisbon, Portugal
2
Acceptability of ISA: Results of a large-scale web-based survey VLASSENROOT, Sven; BROOKHUIS, Karel; DE MOL, Johan; MARCHAU, Vincent; WITLOX, Frank
A major question remains to what extent drivers are willing to accept ISA. As driver acceptance can be defined and made operational in many ways [11] it is important to distinguish ISA acceptability, ISA acceptance and ISA adaptation. Acceptability implies the prospective judgment of measures to be introduced in the future, i.e. the target group will not have experienced any of these measures, making ‘acceptability’ an attitude construct [12, 13]. Acceptance is considered to be the reaction (beliefs and attitudes) of individuals, based on their behavioural reactions after the introduction of a measure or device [11, 14, 15]. ISA adaptation refers to changes in driving behaviour caused by using ISA [1, 16].
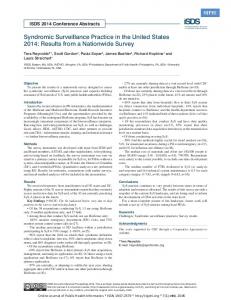
A CONCEPTUAL ACCEPTABILITY FRAMEWORK Although, it is recognized that acceptance, acceptability, and adaptation of ITS are important, a clear definition of what acceptance and acceptability is and precisely how it should be measured is still unclear [17, 18] The lack of a unified theory and definition regarding acceptability has resulted in a large number of different approaches to measure ITS acceptance and acceptability [19], often with quite different results. Some existing theories were used to measure these within the acceptance and acceptability research of ITS. Based on a literature review of different methods and theories the most relevant determinants that influences acceptability have been identified, as well as the most relevant indicators that can or will influence acceptability [20]. A distinction can be made (see Fig. 1) between general indicators (related to the context awareness of the system) and system specific indicators (directly related to the characteristics of the device).
Figure 1- Indicators that could influence the acceptability of ISA
General indicators Gender, age, level of education and (income) employment are the individual indicators and are considered to have an important influence on how people think about speed and speeding and therefore on the use of ISA. [21]. On the Attitudes to driving behaviour and th
12 WCTR, July 11-15, 2010 – Lisbon, Portugal
3
Acceptability of ISA: Results of a large-scale web-based survey VLASSENROOT, Sven; BROOKHUIS, Karel; DE MOL, Johan; MARCHAU, Vincent; WITLOX, Frank
speeding/traffic safety, travel behaviour and driving style are brought into relation with speeding behaviour [22]. Schade and Schlag [12] describe personal and social aims as the dilemma between social or personal aims and benefits. They assume that a higher valuation of common social aims will be positively related to acceptability. Perceived social norms and perceived social pressure refer to the (assumed) opinions of others (peers) multiplied by the importance of the others’ opinions for the individual [12, 23]. Problem perception has been defined as the extent to which speeding is perceived as a problem. There is common agreement that high problem awareness will lead to increased willingness to accept solutions for the perceived problems [12, 14, 19, 24-26]. Responsibility awareness explains how an individual stands in respect to the responsibility issue: is it the government (others/extrinsic) or is it the individual itself (own/intrinsic). [15, 24] The level of acceptability can depend on how well informed (information and knowledge about the problem) the respondents are about the problem and about the (new) device that is introduced to solve the problem [15, 24].
Device Specific Indicators The perceived efficiency indicates the possible benefits users expect of a concrete measure (or device) as compared to other measures. Effectiveness refers to the system’s functioning according to its design specifications, or in the manner it was intended to function [27]. Perceived usability can be defined as the ability to use the system successfully and with minimal effort [28]. Perceived usefulness and satisfaction are indicators from the ITS acceptance scale of Van der Laan et al. [29]. This scale was developed to study user acceptance. Acceptance is measured by direct attitudes towards a system and provides a system evaluation in two dimensions. The technique consists of nine rating-scale items, each a 5-point Likert scale. These items are mapped on two subscales, a scale denoting the usefulness of the system, and a scale designating satisfaction. Equity refers to the distribution of costs and benefits among affected parties. However, from a psychological point of view, perceived justice, integrity, privacy, etc., are basic requirements for acceptability [15]. In many trials acceptance was also defined by willingness to pay and affordability of ISA [30-32]. Giving incentives like lower road taxes, lower insurance fee, can stimulate the acceptability of ISA [33, 34]. In our conceptual study on acceptability it was noted that these indicators had the most potential to predict acceptability. However not that much acceptability studies were held and not every indicator has been studied in former acceptability research [26, 35]. In the next section we describe how the theoretical acceptability concept has been translated in a survey.
SURVEY SETUP Based on the acceptability concept as defined in Figure 1, a survey has been developed to identify the ISA acceptability among vehicle drivers. A web-survey was constructed, distributed by mail and placed on the popular network-website ‘Facebook’. The goal was to include 150 respondents. Based on the answers of these respondents further modifications th
12 WCTR, July 11-15, 2010 – Lisbon, Portugal
4
Acceptability of ISA: Results of a large-scale web-based survey VLASSENROOT, Sven; BROOKHUIS, Karel; DE MOL, Johan; MARCHAU, Vincent; WITLOX, Frank
were made to improve the survey and some first data were processed to find out whether the questions would cover the described indicators (main variables). The validated web-survey was put online at the end of September 2009. The web-address of the survey was published by the Flemish and Dutch motoring organisation. In particular, in Flanders an email newsletter was sent to the VAB members. In the Netherlands, the link to the survey was first announced on the ANWB website. Because of the initial low response rate in the Netherlands an additional email newsletter was sent only to the ‘active members.’ (i.e. members that pay a fee to ANWB for several kinds of services).
RESULTS Background Information Background characteristics of respondents In total 6370 individuals (see Table 1) responded to the web-survey in Belgium and 1158 persons in the Netherlands. Of these 7528 respondents 5599 responses of car drivers were used for further analysis. Table 1. Individual factors of the Belgian and Dutch respondents Belgian
Dutch
(Flemish)
All Respondents
Response Response
6370
1158
7528
N (withheld)
4641
958
5599
Male
77,3
89,4
79,4
Female
22,6
10,6
20,6
17-24
1,4
2,5
1,6
25-34
9,0
6,5
8,6
35-44
19,0
13,7
18,1
45-54
30,0
25,0
29,1
55-64
26,9
34,4
28,2
65 +
13,4
17,8
14,1
Higher education
58,2
53,9
57,4
Secondary education
39,2
44,9
40,2
Primary education
1,8
0,8
1,7
No education
0,7
0,3
0,6
Gender (in %)
Age (in %)
Education (in %)
th
12 WCTR, July 11-15, 2010 – Lisbon, Portugal
5
Acceptability of ISA: Results of a large-scale web-based survey VLASSENROOT, Sven; BROOKHUIS, Karel; DE MOL, Johan; MARCHAU, Vincent; WITLOX, Frank
Family-situation (in %) No children
48,5
58,7
49,1
Oldest child < 12 y.
19,2
14,3
18,4
Oldest child > 12 y.
13,3
12,7
13,2
Oldest child > 18 y.
19,0
14,3
18,2
Most respondents were male (79%) because most VAB and ANWB members are male [36]. Only 2% of the respondents were younger than 25 years, while 27% were between 25 and 45 years, and 71% of the respondents were older than 45 years. Compared with the population in Belgian and the Netherlands, drivers younger than the age of 30 are underrepresented and the age group 45 – 54 is overrepresented: more male and elder drivers have participated. Both organisations indicated that our results are significant compared to their member-databases, although exact data of every parameter (e.g. education level) was not available. This can partly be explained by the fact that predominantly elderly people have a membership of the motorist organisations. One out of two drivers had a “higher education” (university). This was expected since using a websurvey specifically stimulates people with a higher education to [37] participate. 49% of the drivers have no children living at home.
Driving and Travel Behaviour Over 90% of the respondents are private vehicle owners, 13% of the respondents had a company car (some of the respondents had more than one vehicle). About 30% of the respondents drove up to 10 000 km/year, 48% between 10 000 and 25 000 km/year and 22% more than 25 000 km/year. The average driver in Belgium would drive around 11 000 km/year, in the Netherlands the average driver would driver around 15000 km/year [38, 39]. It can be stated that our figures on mileage did not differ much from the national stated averages. Almost 76% of the drivers had been involved in an accident: 77% had only small damages, 18% had an accident with mildly injured people, 4% with severely injured people and 1% were involved in an accident with one or more casualties. In total 51% reported to use the car to go to work or school, 73% use their car for shopping and 74% use a car for leisure activities.
Information about ISA One out of two drivers were familiar with systems that can give information about the posted speed limits. Over 60% of the respondents were aware that speed limit advice can be found in navigation systems; 14% knew the concept of ISA and 20% was familiar with the term speed alert systems. Only 5% of the respondents had knowledge about the trials conducted in Ghent (B) or in Tilburg (NL).
th
12 WCTR, July 11-15, 2010 – Lisbon, Portugal
6
Acceptability of ISA: Results of a large-scale web-based survey VLASSENROOT, Sven; BROOKHUIS, Karel; DE MOL, Johan; MARCHAU, Vincent; WITLOX, Frank
General indicators Problem perception The respondents were asked to value which traffic offenses would have an impact on traffic accidents on a 5-point Likert scale (see Table 2). Table 2. The influence of traffic offences on accidents
No Influence 1
2
3
4
High influence 5
Driving under influence of alcohol or drugs
0,1
0,5
2,9
7,6
88,8
Little driving experience
0,3
5,5
24,8
36,6
32,7
Inappropriate speed
0,5
3,5
11
27,9
57,2
Other, less experienced drivers
0,5
7,2
28,1
37,1
27,2
Bad weather conditions
0,2
5,7
29,8
38,4
25,9
Mobile phone use (without using a car-kit)
0,9
5,8
18,3
31,5
43,6
Bad infrastructure
0,7
10,7
30,5
34,1
24,1
Other risk-seeking behaviour Fatigue Insufficient distance keeping
0,1 0,1 0,3
0,9 0,8 1,8
7 10,4 11,4
27,5 39,3 35,8
64,5 49,5 50,7
According to the respondents, ‘driving under influence’ is the number one cause of an accident (89% said it has a high influence), followed by ‘taking risks’ (65%), ‘inappropriate speed’ (57%), ‘no distance keeping’ (51%) and ‘fatigue’ (50%). Most of the drivers indicated the cause of an accident to their own driving behaviour instead of other (contextual) influences like bad weather (26%), bad infrastructure (24%) or other drivers (27%). The drivers were asked how often they would drive faster in different speed areas. One out of two drivers indicated that ‘sometimes’ they would drive faster, 30% drives regularly too fast outside urban area and on highways, while 22% would drive faster in 30 kph areas, and only 10% drive faster in urban area. The respondents had to indicate the best and safest speed for the different areas as well. Related to this question respondents had to indicate when a speeding offense is made, which maximum speed would be tolerable and which speed should be considered as irresponsible (Table 3).
th
12 WCTR, July 11-15, 2010 – Lisbon, Portugal
7
Acceptability of ISA: Results of a large-scale web-based survey VLASSENROOT, Sven; BROOKHUIS, Karel; DE MOL, Johan; MARCHAU, Vincent; WITLOX, Frank Table 3. Responses on safest speed, tolerable and irresponsible speeding offenses
Speed limit)
zone
(official
Home zone (20 kph) 30 area (30 kph) Urban area (50 kph) Outside urban area (80 or 90 kph) Highway (120 kph)
Safest indicated speed (median in kph)
Tolerable speeding offense (median in kph)
Irresponsible speeding offense (median in kph)
30 30 50
30 40 60
50 60 80
90 130
100 130
120 160
Except for home zones and highways, the drivers indicated the legal posted limit as the best and safest speed. Most of the drivers stated that driving 10 kph more than the posted limit is tolerable. Driving more than 30 kph too fast in home zones, 30 kph areas and urban areas, and driving more than 40 kph too fast outside urban areas and highways were noted as irresponsible offenses. These are rather high margins. The respondents are relatively tolerable about the driven speed as an irresponsible speeding offense, although they indicated that they would not speed very often.
Personal and social aims The respondents were given different descriptions of situations in which they could choose to maintain the speed, to drive slower or to drive faster: One out of two drivers will slow down if they think that they could endanger other road users, in the other situations they would maintain the speed or drive faster: two out of three respondents will drive faster in the situation of being in a hurry for an appointment and in the situation if there is nobody else on the road. One out of two drivers would speed during the night, 44% would drive too fast if the roads are familiar. Finally, 41% would speed if they were certain that there is no or little speed control, 58% would maintain the speed in this situation.
Responsibility awareness The respondents had to indicated how much responsibility (from no responsibility to high responsibility on a 5-point scale) different actors have to do something about the problem of speeding. 81% indicated that they are responsible themselves as drivers. 77% stated that the police are responsible to counter speeding, 63% puts the responsibility on the politicians and 54% on the road authorities.
Perceived efficiency of ITS Prior to analysing more specific aspects about ISA, the respondents were asked to evaluate different ITS systems. This approach is assumed to give an indication how the respondents
th
12 WCTR, July 11-15, 2010 – Lisbon, Portugal
8
Acceptability of ISA: Results of a large-scale web-based survey VLASSENROOT, Sven; BROOKHUIS, Karel; DE MOL, Johan; MARCHAU, Vincent; WITLOX, Frank
in general evaluate ITS and how they think about the use of ITS to assist in their driving behaviour. Table 4. Valuation of efficiency of different ITS by respondents
Following Distance Warning (FDW) Adaptive Cruise Control (ACC) Collision Warning systems Seat belt reminder: Car would not start if the driver does not wear the seat belt Seat belt reminder: Car would not start if everybody in the car is not wearing seat belt Alcohol-warning: Gives only a warningsignal when intoxicated Alcohol-lock Black box: Monitoring of driving aspects
Not efficient 1 18,7 22,4 10,3
2 11,7 14,1 9,3
3 19,8 18,2 18,3
4 24,3 20,6 25,0
Very efficient 5 25,5 24,7 37,1
24,8
10,3
15,5
17,5
31,9
25,1
11,7
16,5
18,1
28,6
20,5
8,6
14,8
18,1
38,0
21,7
8,2
11,3
13,9
45,0
27,1
11,6
18,0
19,9
23,4
In Table 4 the results are given on the evaluation about the efficiency of different ITS systems for the drivers. Instead of the (sometimes misleading) name of a certain ITS system, a description of its functionality was presented to the respondents. The alcohol-lock is found the most efficient (45%), followed by the alcohol-warning systems (38%) and the collision warning systems (37%). If the scores on 4 and 5 are combined, at least 40% of the respondents prefer a certain system: 62% is in favour of a collision warning system and 59% for the alcohol-lock. Even the black box is found efficient for 43% of the drivers. It is concluded that the respondents are certainly interested in different kinds of in-vehicle ITS systems.
Device specific indicators Perceived efficiency of ISA According to the respondents, they believed that the best measures against speeding are police controls (81%) and speed cameras (78%), followed by the use of technology in the vehicle (69%). Speed bumps (48% noted as effective) and road safety campaigns (15% noted as effective) were not valuated to be very effective. The drivers recognized that technology could help to reduce speed offenses or even help to maintain the speed. The respondents were also asked which ISA-system they preferred. Only the description of the system was given, for instance, a system that would give information about the speed limit. In this sense 30% was in favour of an informative system, 38% preferred a warning th
12 WCTR, July 11-15, 2010 – Lisbon, Portugal
9
Acceptability of ISA: Results of a large-scale web-based survey VLASSENROOT, Sven; BROOKHUIS, Karel; DE MOL, Johan; MARCHAU, Vincent; WITLOX, Frank
system, 12% a supportive system (active accelerator pedal) and 15% a closed. Only 5% indicated that they did not want any ISA, whereas 27% of the drivers indicated that they would rather choose to have an interfering type of ISA than just to have a warning or information.
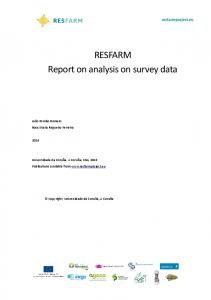
Perceived effectiveness The drivers were asked to indicate which system would be the most effective in different speed zones and for different reasons.
Figure 2 - Valuation on effectiveness of different types of ISA in different speed area
Warning ISA has been considered as the most effective in all speed zones (38% in home zones and 30 kph area, 41% in urban area, 40% outside urban area, and 36% on highways). The higher the speed zone, the less an intervening system was chosen. In low speed zones, restrictive ISA had a somewhat better support (20% in home zones and 30 kph zones). The respondents indicated that an informative system would be the most sufficient to reduce fuel consumption (40%) and C02 emissions (43%). A warning system would increase safety the best (32%) and would help the most to reduce the chance of getting speeding tickets (37%). Note that most drivers preferred a warning ISA, although studies [40] indicated that the more restrictive a system is, the better it would be for traffic safety and for the environment. The respondents would choose those systems that still give a certain feeling of freedom, but would be beneficial for their own driving behaviour as well. th
12 WCTR, July 11-15, 2010 – Lisbon, Portugal
10
Acceptability of ISA: Results of a large-scale web-based survey VLASSENROOT, Sven; BROOKHUIS, Karel; DE MOL, Johan; MARCHAU, Vincent; WITLOX, Frank
Perceived usefulness and satisfaction In Figure 3, the respondents’ opinions on usefulness and satisfaction have been scaled. The respondents could only evaluate the system from which they choose in a previously asked question. For example, when a respondent selected to have a closed ISA, he or she could only scale the 9 items on satisfaction and usefulness with respect to a closed system.
Figure 3 - Drivers’ opinion of ISA scaled on usefulness and satisfaction
All four systems were evaluated as positive. Drivers who chose to have closed ISA find it more satisfying. Respondents who preferred a warning ISA find it more useful. The supportive system has been evaluated as less satisfying and useful in relation to the other systems. It is assumed that it would be more difficult to evaluate a supportive system because it is far more difficult to imagine how it would work, or how it would feel. Also the less intervening the systems are, the more useful they were evaluated. Morsink et al. [40, 41] described this as the ‘acceptance versus effectiveness’ paradox: i.e., the more effective ISA is on road safety (e.g. restricting ISA), the less accepted it will be by the users.
Equity Equity was measured by asking respondents when they are willing to install a certain type of ISA and for whom a certain system would be considered to be the most useful.
th
12 WCTR, July 11-15, 2010 – Lisbon, Portugal
11
Acceptability of ISA: Results of a large-scale web-based survey VLASSENROOT, Sven; BROOKHUIS, Karel; DE MOL, Johan; MARCHAU, Vincent; WITLOX, Frank
Figure 4 - Level of penetration that would influence the drivers’ choice on a certain ISA system
The drivers were asked to indicate on which penetration level of a certain device they would decide to install a specific type of ISA. One out of four drivers would install informative ISA if only 5% of the population would have this kind of system, while half of the drivers indicated that they would rather not choose to have restrictive ISA. It is also noted that the more intervening a system is, the higher the penetration level has to be before a driver would choose to have it.
th
12 WCTR, July 11-15, 2010 – Lisbon, Portugal
12
Acceptability of ISA: Results of a large-scale web-based survey VLASSENROOT, Sven; BROOKHUIS, Karel; DE MOL, Johan; MARCHAU, Vincent; WITLOX, Frank
Figure 5 - Indication for which drivers a certain type of ISA would be the most beneficial
Eight out of ten drivers indicated that problem drivers should be using restrictive ISA. At least one out of two respondents stated that professional drivers should use intervening systems like supportive and restrictive ISA. This also gives a certain indication about the safety and ‘speeding’ image of these professional drivers. Also young drivers should be equipped with more intervening systems, 52% are in favour of restrictive ISA. It should also be noted that 97% stated that ISA is beneficial for all drivers, i.e. 24% informative ISA, 42% warning ISA, 18% supportive ISA and 12% restrictive ISA.
Willingness to pay The four different ISA types were explained to the respondents. The respondents could indicate under which financial condition they would buy a certain system.
th
12 WCTR, July 11-15, 2010 – Lisbon, Portugal
13
Acceptability of ISA: Results of a large-scale web-based survey VLASSENROOT, Sven; BROOKHUIS, Karel; DE MOL, Johan; MARCHAU, Vincent; WITLOX, Frank
Figure 6 - Willingness to pay for different ISA-types
For almost every type of ISA a certain specific strategy could be adopted. Although free placement is preferred for every system, most respondents are willing to pay for informative (30%) or warning ISA (24%) if the price is fair (e.g. compared with the price of a standard navigation system). Supportive ISA still got some high resistance (36%) but a smaller insurance fee (15%) and subsidies (14%) could convince people to install it. The best implementation strategy for a restrictive type of ISA would be free placement (19%), but still one out of two drivers would not want to have it.
CONCLUSIONS AND DISCUSSION It is recognized that knowledge concerning the level of acceptability of a measure is important for future implementation of in-vehicle technologies. Ironically, a clear definition of what acceptability is or how it should be measured is still lacking. Therefore there is a need to understand which factors would influence future drivers’ acceptability. A concept of acceptability was developed and tested by a large-scale survey. The high response rate makes the current survey one of the most successful surveys held on acceptability of ISA in Europe. The average respondent was male, aged between 45 and 54 years with a higher education and no children living at home. It was noted that more elder drivers have participated in the survey than younger drivers. Around 90% of the respondents were car-owners. Their vehicle was the main mode of transport and on average they drive between 10 000 and 25 000 km/year. 76% of the drivers were at least once involved in an accident.
th
12 WCTR, July 11-15, 2010 – Lisbon, Portugal
14
Acceptability of ISA: Results of a large-scale web-based survey VLASSENROOT, Sven; BROOKHUIS, Karel; DE MOL, Johan; MARCHAU, Vincent; WITLOX, Frank
The general indicators revealed us that the respondents considered driving under influence, inappropriate speed and other risk seeking behaviour as the top three causes of an accident. Mainly they stated that drivers’ (mis)behaviour would have an higher influence on the cause of an accident than contextual (e.g. infrastructure and other drivers) issues. Questioned about the use of ITS, it was noted that the respondents were in favour of the alcohol-lock, collision warning systems and active cruise control or systems that could assist in their driving behaviour. This indicates that there can be a high market potential for ADAS. Even the black boxes or driver-monitor-systems had a support of 40%. Outside urban areas and on highways, most drivers would speed regularly. Even in 30 km/h areas it was noted that 20% of the drivers would speed more often. Although they would speed in these areas, the actual posted speed limits in all the speed areas were found to be the safest, except for highways where the limit can be set higher. Driving 10 kph above the speed limit has been indicated as tolerable, driving faster than 20 kph was noted to be irresponsible. The use of technology to reduce speeding was found the most efficient besides enforcement measures like police control and speed cameras. Speed humps and campaigns were indicated as less effective than the use of technology. Almost 95% of the respondents stated that they are in favour of a certain ISA-system: 30% wanted informative ISA, 38% warning ISA, 12% supportive ISA and 15% restrictive ISA. Warning ISA was evaluated the most useful while restricting ISA was found the most satisfying. The respondents indicated that warning ISA would be the most effective. It is assumed that the respondents decided to have a system that would be helpful enough to maintain the speed but that would not restrict their ‘freedom or driving experience’. Drivers would only prefer intervening systems if the penetration level is high enough, although with a penetration rate of 95%, only one out of two would like to have restrictive ISA. This research stated that ISA is acceptable for most of the drivers, which is positive in terms of potential implementation. Speed and excessive speed has been indicated as a problem and it is noted that the respondents are fond of systems that could assist in their driving and speeding behaviour. It is necessary to develop a different strategy for every type of ISA. Informative and warning systems are the most favourable systems and even the respondents are willing to pay for these systems when the penetration level is low or average. A pure market-driven strategy could already lead to an acceptable penetration level. To obtain a higher penetration level for the intervening systems (restrictive and supportive) more governance involvement is needed, like the use of subsidies. Restrictive ISA will get the most resistance: it is likely that even subsidies or even free placement of the system would not convince drivers to install ISA. The respondents also indicated that professional drivers like taxis, buses, trucks, and lorries should use more intervening systems. It is assumed that implementing ISA in the fleet of professional vehicles would be very effective to get a higher acceptability rate. These companies and vehicles could be considered as role models in road safety. Previous studies and trials already stated that role models are effective to gain more th
12 WCTR, July 11-15, 2010 – Lisbon, Portugal
15
Acceptability of ISA: Results of a large-scale web-based survey VLASSENROOT, Sven; BROOKHUIS, Karel; DE MOL, Johan; MARCHAU, Vincent; WITLOX, Frank
awareness of ISA [42]. The high acceptability of ISA by the drivers should also be stimulating in further development of the feasibility framework of ISA and other ITS by the governments. Many ITS, like ISA will need road information like the speed limits: most of these speed limit databases are in development or premature for high-scale use [10]. Future steps in this research, based on the results of the large-scale survey, is to define how the indicators relate to each other and how well they would predict the acceptability based on the conceptual model. A cross-cultural analysis between the Dutch and Belgian drivers will be conducted. Also the acceptability of the different age groups will be examined as more detailed study in the preference difference of a certain type of ISA.
REFERENCES 1.
2.
3.
4.
5.
6.
7. 8.
9. 10.
11.
Brookhuis, K. and D. de Waard: ‘Limiting speed, towards an intelligent speed adapter (ISA),’ Transportation Research Part F: Traffic Psychology and Behaviour, 1999, 2, (2), pp. 81-90. Regan, M.A., et al.: ‘On-Road Evaluation of Intelligent Speed Adaptation, Following Distance Warning and Seatbelt Reminder Systems: Final Results of the TAC SafeCar Project 2006’ (Monash University Accident Research Centre Victoria, 2006) Marchau, V.A.W.J., R.E.C.M. van der Heijden, and E.J.E. Molin: ‘Desirability of advanced driver assistance from road safety perspective: the case of ISA,’ Safety Science, 2005, 43, (1), pp. 11-27. Vlassenroot, S., et al.: ‘Driving with intelligent speed adaptation: Final results of the Belgian ISA-trial,’ Transportation Research Part A: Policy and Practice, 2007, 41, (3), pp. 267-279. Agerholm, N., et al.: ‘Preliminary results from the Danish intelligent speed adaptation project pay as you speed,’ IET Intelligent Transport Systems, 2008, 2, (2), pp. 143153. Regan, M.A., et al.: ‘Impact on driving performance of intelligent speed adaptation, following distance warning and seatbelt reminder systems: Key findings from the TAC SafeCar project,’ IEE Proceedings: Intelligent Transport Systems, 2006, 153, (1), pp. 51-62. Carsten, O.M.J. and F.N. Tate: ‘Intelligent speed adaptation: accident savings and cost-benefit analysis,’ Accident Analysis & Prevention, 2005, 37, (3), pp. 407-416. Varhelyi, A., et al.: ‘Effects of an active accelerator pedal on driver behaviour and traffic safety after long-term use in urban areas,’ Accident Analysis and Prevention, 2004, 36, (5), pp. 729-737. Hogema, J.: ‘ISA effect assessment: from driving behaviour to traffic flow.’ Proc. The ICTCT-extra workshop, Nagoya, Japan, 2002, pp. 1-10. Vlassenroot, S., et al.: ‘Developments on Speed Limit Databases in Flanders: A First Prospective.’ Proc. 15th World Congress on ITS, New York, USA, November 2008, pp. 1-8. Ausserer, K. and R. Risser: ‘Intelligent transport systems and services - chances and risks.’ Proc. ICTCT-workshop, Heslinki, Finland, 2005, pp 1 – 12. th
12 WCTR, July 11-15, 2010 – Lisbon, Portugal
16
Acceptability of ISA: Results of a large-scale web-based survey VLASSENROOT, Sven; BROOKHUIS, Karel; DE MOL, Johan; MARCHAU, Vincent; WITLOX, Frank
12.
13.
14.
15.
16.
17. 18.
19.
20.
21. 22. 23. 24.
25.
26.
27.
Schade, J. and B. Schlag: ‘Acceptability of urban transport pricing strategies,’ Transportation Research Part F: Traffic Psychology and Behaviour, 2003, 6, (1), p. 45-61. Vlassenroot, S., et al: ‘ISA acceptance and acceptability: Definitions and underlying factors.’ Proc. 4th International Conference on Traffic & Transport Psychology, Washington, USA, 2008, pp. 1-2. Goldenbeld, C.: ‘Publiek draagvlak voor verkeersveiligheid en veiligheidsmaatregelen. Overzicht van bevindingen en mogelijkheden voor onderzoek’ (SWOV, 2002). Schade, J. and M. Baum: ‘Reactance or acceptance? Reactions towards the introduction of road pricing,’ Transportation Research Part A: Policy and Practice, 2007, 41, (1), pp. 41-48. Dragutinovic, N., et al.: ‘Behavioural effects of Advanced Cruise Control Use – a meta-analytic approach,’ European Journal of Transport and Infrastructure Research (EJTIR), 2005, 5, (4), pp. 267-280. Adell, E.: ‘The concept of acceptance,’ Proc. ICTCT-workshop, Riga, Latvia, 2008, pp. 1-7. Vlassenroot, S., et al: ‘Defining the carrying capacity: what can determine acceptance of road safety measures by a general public?’ Proc. European Transport Conference (ETC), Strasbourg, 2006, pp 1 – 15. Molin, E.J.E. and K.A. Brookhuis: ‘Modelling acceptability of the intelligent speed adapter,’ Transportation Research Part F: Traffic Psychology and Behaviour, 2007, 10, (2), pp. 99-108. Vlassenroot, S. et al.: ‘Towards defining a unified concept for the acceptability of Intelligent Transport Systems (ITS): A conceptual analysis based on the case of Intelligent Speed Adaptation (ISA),’ Transportation Research Part F: Traffic Psychology and Behaviour, DOI: 10.1016/j.trf.2010.02.001. Parker, D. and S. Stradling: ‘Influencing driver attitudes and behaviour’ (Department for Transport, 2001). Stradling, S., et al.: ‘ The Speeding Driver: Who, How and Why?’ (Scottish Executive Social Research, 2003). Ajzen, I.: ‘Attitudes, personality and behaviour’ (Open University Press, 2002). Steg, L., et al.: ‘Private car mobility. Problem awareness, willingness to change, and policy evaluation: A national interview study among Dutch car users,’ Studies in Environmental Science, 1995, pp. 1173-1176. Eriksson, L., J. Garvill, and A.M. Nordlund: ‘Acceptability of travel demand management measures: The importance of problem awareness, personal norm, freedom, and fairness,’ Journal of Environmental Psychology, 2006, 26, (1), pp. 1526. De Mol, J., et al.: ‘Naar een draagvlak voor een voertuigtechnische snelheidsbeheersing binnen een intrinsiek veilige verkeersomgeving’ (Centre for sustainable development/Ghent University—BIVV, 2001). Young, K.L., et al., ‘Acceptability of In-vehicle Intelligent transport systems to Young Novice Drivers in New South Wales (Monash University Accident Research Centre (Muarc), 2003). th
12 WCTR, July 11-15, 2010 – Lisbon, Portugal
17
Acceptability of ISA: Results of a large-scale web-based survey VLASSENROOT, Sven; BROOKHUIS, Karel; DE MOL, Johan; MARCHAU, Vincent; WITLOX, Frank
28. 29.
30.
31.
32.
33.
34.
35.
36.
37.
38. 39. 40. 41. 42.
SpeedAlert: ‘Evolution of SpeedAlert concepts, deployment recommendations and requiremenuts for standardisation’ (Ertico, 2005). Van Der Laan, J.D., A. Heino, and D. De Waard: ‘A simple procedure for the assessment of acceptance of advanced transport telematics,’ Transportation Research Part C: Emerging Technologies, 1997, 5, (1), pp. 1-10. Broeckx, S., et al.: ‘The European PROSPER-project: Final results of the trial on Intelligent Speed Adaptation (ISA) in Belgium.’ Proc. ITS World Congress, London, UK, Oktober 2006, pp 1 – 10. Biding, T. and G. Lind: ‘Intelligent Speed Adaptation (ISA), Results of Large-scale trials in Borlange, Lidkoping, Lund and Umea during the periode 1999-2002’ (Vägverket, 2002). Hjalmdahl, M. and A. Varhelyi: ‘Speed regulation by in-car active accelerator pedal: Effects on driver behaviour,’ Transportation Research Part F: Traffic Psychology and Behaviour, 2004, 7, (2), p. 77-94. Lahrmann, H., et al.: ‘Spar paa farten. an intelligent speed adaptation project in Denmark based on pay as you drive principles,’ Proc. 6th European Congress on Intelligent Transport Systems and Services, Aalborg, Denmark, June 2007. Schuitema, G. and L. Steg: ‘The role of revenue use in the acceptability of transport pricing policies,’ Transportation Research Part F: Traffic Psychology and Behaviour, 2008, 11, (3), pp. 221-231. Garvill, J., A. Marell, and K. Westin: ‘Factors influencing drivers' decision to install an electronic speed checker in the car,’ Transportation Research Part F: Traffic Psychology and Behaviour, 2003, 6, (1), pp. 37-43. Gardner, B. and C. Abraham: ‘What drives car use? A grounded theory analysis of commuters' reasons for driving’ Transportation Research Part F: Traffic Psychology and Behaviour, 2007, 10, (3), pp. 187-200. Van Acker V., Witlox F., van Wee B: ‘The effects of the land use system on travel behaviour: towards a new research approach,’ Transportation Planning and Technology, 2007, 30, (4), pp. 331-353. www.mobilit.fgov.be, accessed March 2010 www.anwb.nl, accessed March 2010 Morsink, P., et al.: ‘Speed support through the intelligent vehicle : perspective, estimated effects and implementation aspects’ (SWOV, 2006). Marchau, V., et al., Enhancing speed management by in-car speed assistance systems. IET Intelligent Transport Systems, 2010, 4, (1), pp. 3 – 11. De Mol, J. and S. Vlassenroot: ‘strategies in getting public and political support for ITS: the use of a demonstration-car and role-models within trials.’ 6th European Congress on Intelligent Transport Systems and Services, Aalborg, Denmark, June 2007.
th
12 WCTR, July 11-15, 2010 – Lisbon, Portugal
18