Advanced Review
Community detection in large-scale networks: a survey and empirical evaluation Steve Harenberg, Gonzalo Bello, L. Gjeltema, Stephen Ranshous, Jitendra Harlalka, Ramona Seay, Kanchana Padmanabhan and Nagiza Samatova∗ Community detection is a common problem in graph data analytics that consists of finding groups of densely connected nodes with few connections to nodes outside of the group. In particular, identifying communities in large-scale networks is an important task in many scientific domains. In this review, we evaluated eight state-of-the-art and five traditional algorithms for overlapping and disjoint community detection on large-scale real-world networks with known ground-truth communities. These 13 algorithms were empirically compared using goodness metrics that measure the structural properties of the identified communities, as well as performance metrics that evaluate these communities against the ground-truth. Our results show that these two types of metrics are not equivalent. That is, an algorithm may perform well in terms of goodness metrics, but poorly in terms of performance metrics, or vice versa. © 2014 The Authors. WIREs Computational Statistics published by Wiley Periodicals, Inc.
How to cite this article:
WIREs Comput Stat 2014. doi: 10.1002/wics.1319
Keywords: clustering; community detection; empirical evaluation; graphs; ground-truth; networks
INTRODUCTION
L
arge-scale networks with thousands to millions of nodes are ubiquitous across many different scientific domains. Community structures in these networks are often of particular interest. For example, communities represent modules of functionally associated proteins in biological networks,1 customers with similar interests in customer preferences databases,2 or ∗ Correspondence
to:
[email protected]
Department of Computer Science, North Carolina State University, Raleigh, NC, USA Computer Science and Mathematics Division, Oak Ridge National Laboratory, Oak Ridge, TN, USA Conflict of interest: The authors have declared no conflicts of interest for this article.
regions of homogeneous long-term climate variability in climate networks.3 Identifying communities in a network is a complex problem due to the existence of numerous definitions of community and the intractability of many community detection algorithms. Informally, a community is a densely connected group of nodes that is sparsely connected to the rest of the network. As there are several structural definitions that satisfy this criterion, no formal definition of community is universally accepted.4 In addition, communities can have various properties, often stemming from the domain at hand, such as hierarchical organization, overlapping nodes, or weighted edges. For all these reasons, community detection has been approached from many different perspectives and is one of the
© 2014 The Authors. WIREs Computational Statistics published by Wiley Periodicals, Inc. This is an open access article under the terms of the Creative Commons Attribution-NonCommercial License, which permits use, distribution and reproduction in any medium, provided the original work is properly cited and is not used for commercial purposes.
wires.wiley.com/compstats
Advanced Review
most widely researched problems in graph data analytics. In this article, we perform an extensive empirical review of state-of-the-art community detection algorithms, focusing on their performance in large-scale real-world networks.
for community detection on large-scale real-world networks with known ground-truth communities. The algorithms were evaluated based not only on the structural properties of the communities identified, but also on the accuracy of the results obtained with respect to the ground-truth communities.
RELATED WORK In recent years, several surveys in the area of community detection have been published. Fortunato4 and Coscia et al.5 presented comprehensive reviews of both disjoint and overlapping community detection algorithms published up to 2009 and 2011, respectively. Fortunato classified these algorithms based on their methodological principles, whereas Coscia et al. classified them based on the definition of community used. Crampes and Plantié6 proposed an alternative classification based on the type of input and output data. Malliaros and Vazirgiannis7 focused on community detection algorithms for directed graphs, and suggested a methodology-based taxonomy to classify the different algorithmic approaches. Furthermore, some existing surveys also offer an empirical evaluation of the algorithms considered. Danon et al.8 and Lancichinetti and Fortunato9 evaluated several community detection algorithms on synthetic graphs, by computing the fraction of correctly identified nodes and the Normalized Mutual Information (NMI), respectively. Orman et al.10 compared eight algorithms for disjoint community detection with respect to the performance metrics obtained and the topological properties of the communities identified on a set of synthetic graphs. Xie et al.11 contrasted the performance of 14 state-of-the-art algorithms for overlapping community detection on both synthetic graphs and on real-world social networks with no known ground-truth communities. Similarly, Leskovec et al.12 and Moradi et al.13 evaluated the structural quality of the communities identified by various algorithms on real-world networks. This review presents an overview of eight state-of-the-art (published since 2010) algorithms for both disjoint and overlapping community detection. We analyzed some of the top-performing algorithms identified in previous empirical studies, as well as more recent algorithms that have not been included in any survey. Five traditional community detection algorithms were also considered as benchmarks. Moreover, existing empirical comparisons of community detection algorithms have focused mostly on synthetic graphs or on real-world networks with no known ground-truth communities. To the best of our knowledge, this is the first review to present a systematic evaluation of state-of-the-art algorithms
ALGORITHMS In this section, we describe eight state-of-the-art (published since 2010) algorithms for overlapping and/or disjoint community detection. Two of the algorithms (TopGC and SLPA) can be used to detect both types of communities. Six of the algorithms (CGGC, MCD, CONCLUDE, SVINET, SLPA, and TopGC) are nondeterministic. Moreover, some of the algorithms can be applied to directed and/or weighted graphs. In addition, several traditional methods (CFinder, Walktrap, FastGreedy, LPA, and LE) for community detection are included as benchmarks. For an overview of the algorithms, see Table 1.
Overlapping Community Detection Many real-world networks contain overlapping communities; that is, each node can belong to multiple communities. One of the most widely used techniques to find overlapping communities is the Clique Percolation Method (CPM).26 This technique finds all the maximal cliques in a graph, which requires exponential time in the worst case,27 and then forms communities by merging cliques with common nodes. We used CFinder,1 an implementation of CPM, as the traditional method for benchmark comparison.
SLPA: Label Propagation Speaker-listener Label Propagation Algorithm (SLPA),14 later renamed to GANXiS, extends Label Propagation Algorithm (LPA)23 to overlapping community detection. SLPA identifies both disjoint and overlapping communities by propagating labels representing community membership between nodes in a graph. First, the memory of each node is initialized with a unique label. This means that initially each node belongs to a different community. Next, a node is selected as a listener. A label is propagated to the listener from each of its neighbors (speakers). Each label propagated is randomly selected with a probability proportional to its frequency in the memory of the speaker that sends it. The listener then incorporates the most common of the labels received into its memory. This label propagation process is repeated for a user-defined maximum number of iterations T
© 2014 The Authors. WIREs Computational Statistics published by Wiley Periodicals, Inc.
WIREs Computational Statistics
Community detection in large-scale networks
TABLE 1 Community Detection Algorithms Evaluated Algorithm State-of-the-art SLPA14 TopGC15 16
SVINET
Olap
Dir
Wght
Parm
√
√
√
√
√
√
√
*
* √
√ √
MCD17 CONCLUDE19 DSE20 SPICi
√
√
√
√ √
21
CFinder1 FastGreedy22 LPA23
√
√
CGGCi-RG18
Traditional
√
√
√ √ √
√
LE24 Walktrap25
Complexity
Implementation
Year
O(Tm)
Java
2012
?
Java
2010
?
C++
2013
O(nK )
C
2012
? ( ) O 𝜅 m + d (V )2 n + 𝛾 n
C++
2012
Java
2011
O(n log n + n)
C++
2012
O(n log n + m)
C++
2010
exponential
Java
2005
O(n log2 n)
Python
2004
O (m )
Python
2007
O(m(n + m))
Python
2006
O(mn2 )
Python
2005
SLPA, Speaker-listener Label Propagation Algorithm; TopGC, Top Graph Clusters; MCD, multithreaded community detection; CGGCi-RG, Core Groups Graph Cluster with iterated randomized greedy modularity maximization; CONCLUDE, Complex Network Cluster Detection; DSE, dense subgraph extraction; SPICi, Speed and Performance In Clustering; LPA, Label Propagation Algorithm; LE, leading eigenvector. n = |V|, m = |E|, and d (V) is the average degree of the graph. Other variables are explained in the corresponding algorithm sections. Checkmarks indicate that the algorithm identifies overlapping communities (Olap), can be run on directed graphs (Dir) or weighted graphs (Wght), or requires input parameters (Parm). Algorithms marked with * can also be used to find disjoint communities.
(SLPA has been empirically shown to produce relatively stable results for T > 20.14 ). Finally, a probability distribution of labels is built for the memory of each node. If the probability for a particular label of a node is less than a given threshold r ∈ [0, 1], the label is deleted. Nodes with common labels are then grouped into a community. If a node has multiple labels it will belong to multiple overlapping communities. Hence, the smaller the value of r, the greater the number of overlapping communities identified by the algorithm. Note that when r ≥ 0.5, the algorithm returns only disjoint communities.
TopGC: Locality Sensitive Hashing Top Graph Clusters (TopGC)15 is a probabilistic clustering algorithm that finds the top well-connected clusters in a graph. The main idea is to find sets of nodes whose neighborhoods are highly overlapping, as these nodes should be clustered together. This is achieved by applying a technique called MinHash, which estimates the similarity between two sets. To reduce memory, an initial pruning phase is used to determine the nodes most likely to be in the strongest clusters. The strength of a cluster is defined as the sum of edge weights in the cluster over the number of possible edges multiplied by the root of the cluster size. First, the algorithm generates m permutations 𝜋 1 , … , 𝜋 m of all the nodes in the graph. Second,
for each permutation 𝜋 i , a MinHash value mhi is determined for each node in the graph by selecting the neighboring node with the lowest order in the permutation. Third, l random numbers in [1, m] are generated signature for each ( to create a MinHash ) node, mhl1 , mhl2 , … , mhll . Hence, the probability of two nodes having matching signatures is the Jaccard index between the nodes raised to the power l. Finally, the nodes are hashed using their signatures and nodes with the same hash are placed in the same community.
SVINET: Statistical Inference SVINET16 is based on a Bayesian model for graphs with overlapping communities that uses a mixed-membership stochastic blockmodel.28 In this model, each node is assigned a vector of community memberships 𝜃 of length K, where K is the number of communities in the graph (which is assumed to be known). The community structure of an observed graph can then be estimated by computing the posterior distribution; that is, the conditional distribution of the community memberships given the graph. However, computing the posterior distribution is an intractable problem. For this reason, it is approximated using a stochastic optimization algorithm for mean-field variational inference. First, a set of pairs of nodes is subsampled from the graph. Next, this subsample is analyzed
© 2014 The Authors. WIREs Computational Statistics published by Wiley Periodicals, Inc.
wires.wiley.com/compstats
Advanced Review
and the community structure of the graph is updated accordingly. This subsampling procedure is repeated for a given number of iterations. Hence, SVINET analyzes a subgraph of the graph at each iteration.
pairs of communities to merge, and contracts the community graph based on these mergers. In all iterations, there are at most K contraction phases, which is bounded by |V|, but is often much less.
Disjoint Community Detection
CGGC: Ensemble-Based Modularity Maximization
The majority of algorithms for community detection find disjoint communities; that is, each node belongs to at most one community. In general, community detection in literature refers to disjoint communities unless explicitly stated otherwise. Graph partitioning methods divide the graph into two partitions (i.e., communities), which may then be further partitioned. One of the limitations of graph partitioning methods is that they usually require the user to specify the number of partitions, which may not be known in advance. One solution proposed to this problem is to use a goodness metric (e.g., modularity) to evaluate the partition of the graph at each step. However, this is computationally expensive and can be infeasible for large graphs. Several heuristics have been proposed to partition the graph. For instance, the traditional algorithm Walktrap25 uses random walks based on the intuition that a random walk will likely get trapped in densely connected regions of the graph corresponding to communities. Other traditional methods use a bottom-up approach, starting with individual nodes and combining them. Some of these methods, such as FastGreedy,22 are based on maximizing an objective function (e.g., modularity). Others, such as LPA,23 are based on communication theory. Another category of traditional methods use spectral clustering to identify communities; for example, by calculating the leading eigenvector (LE)24 of the modularity matrix of the graph.
MCD: Modularity Maximization The multithreaded community detection (MCD) algorithm in Ref 17 creates a set of disjoint partitions of the input graph. Like other agglomerative clustering algorithms, this method starts with each node as a separate community and merges communities until some objective function (such as modularity or negative conductance) achieves a local maximum. For our evaluation, we used modularity as the objective function. To cluster the graph, this algorithm maintains a community graph, where each community is represented by a single node and the edges are weighted with the number of collapsed edges. Using this community graph, at each iteration, the algorithm computes the change in the optimization metric after merging two adjacent communities, greedily selects
Core Groups Graph Cluster (CGGC)18 is an ensemble learning method for clustering graph data. This ensemble method combines several different clusterings to help decide about the final partitioning of the node set into clusters; if all the clusterings agree that a pair of nodes belong together in a cluster, it is probably true, otherwise, a second look should be taken. The general strategy is to run clustering algorithms k times to generate k different partitions of the nodes. From these k partitions, a maximum overlap ̂ is created where nodes that are part of the partition P same clusters in all of the k clusterings are in the same ̂ A graph is built using the partitions partition of P. ̂ as nodes and a final clustering step is performed from P on this smaller graph to find the final partitioning. An improvement to this method is made by performing the k-partitioning iteratively until a ‘best’ initial partitioning is achieved. Although a combination of several different clustering techniques can be used in the initial k-partitioning phase of the algorithm, the authors use only one clustering technique (run k times) and compare label propagation and a randomized greedy modularity maximization as their clustering techniques. For our evaluation, we used CGGC with iterated randomized greedy modularity maximization (CGGCi-RG), which was shown to perform best.18
CONCLUDE: Random Walks and Modularity Maximization The Complex Network Cluster Detection (CONCLUDE) algorithm19 aims to combine the accuracy of global methods with the efficiency of local methods. This is done by incorporating knowledge about the topology of the entire graph to heuristic algorithms for community detection. First, the 𝜅-path edge centrality of each edge in the graph is computed using the Edge Random Walk 𝜅-path Centrality (ERW-Kpath) algorithm.19 𝜅-path edge centrality is a measure of the importance of an edge in the connectivity of the graph. ERW-Kpath is a heuristic algorithm that approximates the 𝜅-path edge centrality of an edge by calculating the probability of the edge belonging to a random non-backtracking walk of finite length 𝜅. Next, we use the 𝜅-path edge centrality values estimated to compute the distances between all pairs of connected nodes in the graph. Finally, the distances computed are assigned
© 2014 The Authors. WIREs Computational Statistics published by Wiley Periodicals, Inc.
WIREs Computational Statistics
as edge weights and the resulting weighted graph is partitioned using the Louvain Method.29 The Louvain Method is a widely used greedy algorithm for community detection by network modularity maximization that converges in 𝛾 iterations.
DSE: Matrix Blocking via Cosine Similarity The method for dense subgraph extraction (DSE) in Ref 20 is inspired by matrix blocking. Matrix blocking is the process of reordering the rows and columns such that a critical mass of the nonzero elements are along or near the diagonal. The blocks along the diagonal correspond to dense subgraphs. Through an adaptation of the method presented in Ref 30, a hierarchical clustering algorithm for extracting dense subgraphs is created. This approach requires only the minimum density of the subgraphs and yields an incomplete clustering, meaning that not every node in the graph needs to be part of a community. Given a sparse graph G, a matrix M is created, where Mij is the cosine similarity between columns i and j in the adjacency matrix of G. A tree T, which represents the partitioning of the nodes, is constructed in a bottom-up fashion by iterating over the nonzero entries in M in descending order, each time joining two subtrees if they are not already connected. The dense subgraphs can be extracted by a simple tree traversal, outputting the subtrees rooted at internal nodes with densities greater than the threshold value.
SPICi: Support Maximization Speed and Performance In Clustering (SPICi)21 is a greedy heuristic algorithm that produces an incomplete clustering and is designed to work on large biological networks. It begins by identifying a seed pair of nodes, which will be the node ∑ u with the maximum weighted degree (dw (u) = v : (u,v) ∈ E wu,v ) and its neighbor with the highest weighted degree. The procedure for growing the current cluster S is similar to DPClus.31 At each iteration,∑the node with the highest support (support(u, S) = v ∈ S wu,v ) for the current cluster is chosen to be added if the density would remain above the user-defined threshold. Otherwise, the cluster is reported and its nodes and incident edges are removed from the graph.
EVALUATION METHODOLOGY In this section, we describe the methodology used to evaluate the community detection algorithms. Each algorithm was applied to several graph datasets to obtain goodness and performance metrics. Goodness metrics quantitatively measure structural properties of the identified communities, whereas the performance
Community detection in large-scale networks
metrics quantitatively compare these communities against the ground-truth communities. These metrics were analyzed and compared in R 3.0.2. The nondeterministic algorithms were run 10 times on each graph. All experiments were performed on a dedicated Intel server consisting of two hex-core E5645 processors and 64 GB DDR2 RAM. The data was stored on a 2TB RAID1 partition and the operating system was installed on a 120.5 GB SSD.
Datasets For our experiments, we used real-world networks with overlapping ground-truth communities from the Stanford Large Network Dataset Collection (SNAP).31 Five undirected, unweighted networks from three different domains were considered: • Co-product purchasing network (Amazon): Nodes represent products. Adjacent nodes represent products that are frequently copurchased. Ground-truth communities are defined by the hierarchy of product categories. • Co-publishing network (DBLP): Nodes represent authors. Adjacent nodes represent authors with at least one shared publication. Ground-truth communities are defined as sets of authors who published in the same journal or conference. • Social networks (LiveJournal, Orkut, Youtube): Nodes represent users and edges represent friendship between two users. Ground-truth communities are defined by node membership in user-created groups. Only the top 5000 ground-truth communities from each network (determined by Ref 32) were used for evaluation, as goodness metrics have been shown to degrade quickly after roughly the top 5000. In addition, many of these top communities had low internal densities, contradicting the intuitive definition of a community. Therefore, we ranked the top 5000 ground-truth communities based on internal density and removed the bottom quartile. Duplicate communities were also eliminated. Finally, all the nodes (and incident edges) that did not belong to any of the remaining communities were removed from the networks. The resulting graphs and ground-truth communities were used to test the algorithms for overlapping community detection. In addition, five more graphs with disjoint ground-truth communities were derived from the real-world networks in order to test the algorithms for disjoint communities. To obtain these graphs, the maximum independent set of disjoint ground-truth
© 2014 The Authors. WIREs Computational Statistics published by Wiley Periodicals, Inc.
wires.wiley.com/compstats
Advanced Review
TABLE 2 Summary of the Graphs Used for the Evaluations Parameter
Amazon
Youtube
DBLP
LiveJournal
Orkut
Algorithms
Overlap Num vertices Num edges Max comms per node Num communities
8275
12,091
26,956
44,093
297,691
—
22,231
29,775
88,742
871,409
7,747,026
—
4
11
8
13
43
SLPA
1138
3579
3721
3528
3664
SVINET
Min comm size
3
2
6
3
3
TopGC
Max comm size
27
31
38
407
787
TopGC
Max comm overlap Min density
1
1
1
1
1
TopGC
0.324
0.286
0.489
0.667
0.101
—
Disjoint Num vertices
1644
3088
5831
17,969
1247
—
Num edges
5022
6695
18,733
434,075
15,511
—
Max comms per node Num communities
1
1
1
1
1
SLPA
131
595
676
668
43
MCD
Min comm size
4
2
6
3
3
TopGC, DSE, SPICi
Max comm size
25
29
27
407
211
TopGC, MCD
Max comm overlap Min density
0
0
0
0
0
TopGC
0.325
0.286
0.489
0.667
0.165
DSE, SPICi
SLPA, Speaker-listener Label Propagation Algorithm; TopGC, Top Graph Clusters; MCD, multithreaded community detection; DSE, dense subgraph extraction; SPICi, Speed and Performance In Clustering. Algorithms are listed in the row of the input parameter needed.
communities was found. Then, the nodes (and incident edges) that did not belong to any of these communities were removed. Thus, in total, 10 graphs corresponding to real-world networks (Amazon, DBLP, LiveJournal, Orkut, and Youtube) were used for our experiments; five with overlapping ground-truth communities and five with disjoint ground-truth communities. The summary of these graphs can be found in Table 2. For algorithms that require edge-weighted networks as input, a weight of one was assigned to all edges.
per node, Table 2). This value guarantees that each node can belong to as many communities as in the ground-truth. The maximum community overlap used in TopGC is defined as the maximum overlap between any two communities (max comm overlap, Table 2). The overlap between two communities was calculated by dividing the number of common vertices between the two communities by the number of vertices in the smaller community.
Goodness Metrics Parameter Selection In many cases, the community detection algorithms require the user to specify certain parameters, such as minimum community size, overlap threshold, minimum density (Table 2). For each graph, the parameters were chosen based on statistics of the ground-truth communities. Although it may inflate the performance results compared to the parameter-free algorithms, this approach was selected to provide a uniform comparison of the algorithms. For the probability threshold parameter r used in SLPA, we chose the inverse of one plus the maximum number of communities per node (max comms
Goodness metrics quantitatively measure different attributes of community structures. A list of various commonly used scoring functions was compiled in Ref 32. It can be difficult to decide which goodness metric is suitable to express ‘good’ communities in a particular graph. Therefore, we selected four goodness metrics that measure complementary properties for our empirical analysis: density, clustering coefficient, conductance, and triangle participation ratio. Given an undirected graph G = (V, E) and a set of nodes S ⊆ V, let ES = |{(u, v) ∈ E | u, v ∈ S}| be the number of edges in the subgraph induced by S. Let
© 2014 The Authors. WIREs Computational Statistics published by Wiley Periodicals, Inc.
WIREs Computational Statistics
Community detection in large-scale networks
Amazon
Youtube
DBLP
LiveJournal
Orkut
1.0
Density
0.8 0.6 0.4 0.2 0.0
Clustering coefficient
1.0 0.8 0.6 0.4 0.2 0.0 1.0
TPR
0.8 0.6 0.4 0.2 0.0 1.0 Conductance
0.8 0.6 0.4 0.2
Traditional algorithm Ground−truth
ground−truth
CFinder
TopGC
SVINET
SLPA
CFinder
ground−truth
TopGC
SVINET
SLPA
CFinder
ground−truth
SVINET
SLPA
TopGC
CFinder
ground−truth
SVINET
SLPA
TopGC
ground−truth
CFinder
SVINET
SLPA
TopGC
0.0
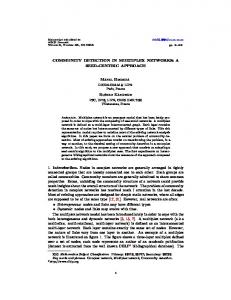
FIGURE 1 | Goodness metrics for overlapping community detection. Missing boxplots indicate that the corresponding algorithm did not finish on that graph within 4 h.
OS = |{(u, v)| u ∈ S, v ∉ S}| be the number of edges between the vertices in S and any vertex outside of S. A triplet is defined as a tuple of three nodes (u, v, w) where (u, v), (v, w) ∈ E. If (u, w) ∈ E, then the triplet is said to be closed, otherwise the triplet is open. A triplet is defined to be centered at a vertex, thus (u, v, w) = (w, v, u), but (u, v, w) ≠ (v, u, w). We denote the set of closed and open triplets as T c and T o respectively. Given these notations, the goodness metrics for a community S are defined as follows32 :
2 |E |
S : the ratio of edges to the number • Density, |S|(|S|−1) of possible edges. | Tc | : the ratio of closed • Clustering coefficient, T |+|T | c o| triplets to all triplets. OS • Conductance, 2 E +O : the fraction of edges that S S point outside the community. • Triangle participation ratio (TPR), |{v∈T | T∈Tc }| : the fraction of nodes that belong |S| to a triangle.
© 2014 The Authors. WIREs Computational Statistics published by Wiley Periodicals, Inc.
wires.wiley.com/compstats
DBLP
LiveJournal
Orkut
SLPA TopGC MCD CGGCi−RG CONCLUDE DSE SPICi FastGreedy LPA LE Walktrap ground−truth
SLPA TopGC MCD CGGCi−RG CONCLUDE DSE SPICi FastGreedy LPA LE Walktrap ground−truth
Amazon
SLPA TopGC MCD CGGCi−RG CONCLUDE DSE SPICi FastGreedy LPA LE Walktrap ground−truth
Advanced Review
Youtube
1.0 Density
0.8 0.6 0.4 0.2
Clustering coefficient
0.0 1.0 0.8 0.6 0.4 0.2 0.0 1.0
TPR
0.8 0.6 0.4 0.2 0.0
Conductance
1.0 0.8 0.6 0.4 0.2
SLPA TopGC MCD CGGCi−RG CONCLUDE DSE SPICi FastGreedy LPA LE Walktrap ground−truth
SLPA TopGC MCD CGGCi−RG CONCLUDE DSE SPICi FastGreedy LPA LE Walktrap ground−truth
0.0
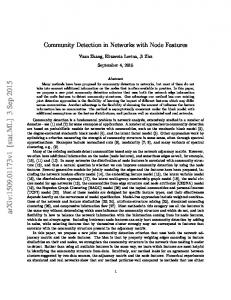
FIGURE 2 | Goodness metrics for disjoint community detection. Missing boxplots indicate that the corresponding algorithm did not finish on that graph within 4 h.
Performance Metrics Performance metrics are another way to measure the quality of the output by comparing identified communities against the ground-truth communities. For every pair of nodes, we checked whether they belong to the same community. A pair of nodes is misclassified if (1) they were assigned to different communities but belong to the same ground-truth community (false negative) or if (2) they were assigned to the same community but belong to different ground-truth communities (false positive). Using the true/false positives/ negatives, we obtained several statistical measures: precision (P), recall (R), F-measure (F), specificity (S), accuracy (A),33 and NMI,34 which measures the similarity between the set of ground-truth communities and the set of communities output by an algorithm.
RESULTS AND DISCUSSION In this section, we present the results obtained with the community detection algorithms evaluated in terms of goodness metrics, performance metrics, output similarity, and run-time. To obtain these values, the
deterministic algorithms were run once and the nondeterministic algorithms were run 10 times. For the nondeterministic algorithms, the values per goodness metric in an ‘average’ run, shown in the boxplots, were computed as follows: for each percentile, the mean of the 10 runs was calculated; the resulting 100 points were used as an approximation of an ‘average’ distribution of the goodness metric.
Goodness Metrics Results The algorithms were evaluated on a pergoodness-metric basis. The results for the overlapping and disjoint community detection algorithms can be found in Figures 1 and 2 respectively. The goodness metrics selected for evaluation are bounded by 0 and 1. A high value of density, clustering coefficient, or TPR indicates ‘good’ communities, as does a low value of conductance.
Analysis of Ground-Truth Communities An analysis of the overlapping and disjoint ground-truth communities revealed that the LiveJournal, Orkut, and Youtube networks do not
© 2014 The Authors. WIREs Computational Statistics published by Wiley Periodicals, Inc.
WIREs Computational Statistics
have similar values for the majority of the goodness metrics, despite all being social networks. LiveJournal communities have low median scores for conductance and high scores for density, clustering coefficient, and TPR, whereas Orkut communities have a wider range and lower scores for density and clustering coefficient. On the other hand, Youtube communities exhibit the widest range of values for all the goodness metrics except for density. The ground-truth communities of the Youtube network have unexpected values for most of the goodness metrics. Three quarters of the Youtube overlapping and disjoint ground-truth communities have low clustering coefficients and low TPRs. The median clustering coefficient (0 for overlapping and 0.214 for disjoint) and the median TPR (0 for overlapping and 0.429 for disjoint) are considerably lower than in the other networks. For the disjoint graphs, Youtube’s communities also have a higher median conductance (0.2) than the communities of the other networks (0 for each). This means that most of the Youtube communities do not exhibit the expected structural properties of ‘good’ communities; that is, there are many edges within these communities (indicated by the high density), but there are not many triangles (indicated by the low TPR and the low clustering coefficient). Owing to these particular structural properties, all the community detection algorithms evaluated yielded a low precision (and thus a low F-measure) on the Youtube network.
Analysis of Algorithms For each graph, the algorithms were ranked based on the median values of the goodness metrics of the communities found. In cases where the medians were similar, the interquartile ranges were compared, followed by inspection of the ranges. Note that the comparison of the overlapping algorithms for the LiveJournal and Orkut networks may be affected by the fact that only two of these algorithms ran within the allotted time frame. The overall top and bottom ranked algorithms are shown in Table 5. No full ranking is provided, because some instances had no clear distinction between the rankings of the algorithms. For instance, all the overlapping and disjoint community detection algorithms identified communities with generally high TPR (median very close to 1 and small interquartile range of 0.106), except in the case of the Youtube network. Among all the algorithms, TopGC identified the best overlapping and disjoint communities in terms of density and clustering coefficient. TopGC achieves this high performance because it aims to find only the
Community detection in large-scale networks
best communities as determined by a scoring function proportional to density, rather than all communities in the graph. However, the communities identified by TopGC also had the worst conductance. This demonstrates that an algorithm optimizing for a single goodness metric may not capture all desired structural properties of a community. On the other hand, SLPA found the communities with the lowest conductance of all the overlapping algorithms. SLPA achieved a low conductance, because it naturally forms communities with few outgoing edges: sets of nodes with few outgoing edges are likely to propagate the same labels between them and hence will frequently be placed into the same community.
Performance Metrics Results The performance metrics for each algorithm were calculated using the ground-truth communities. These metrics can be found in Tables 3 and 4. The algorithms were ranked on a per-performance-metric basis using the median values as described in the previous section. The overall top and bottom ranked algorithms are shown in Table 5. Note that due to a high number of true negatives, the specificity and accuracy of all the overlapping and disjoint community detection algorithms were near perfect (almost 1) on most graphs. Therefore, these two performance metrics did not provide any discriminatory information and were not included in our analysis. In most cases, TopGC yielded considerably worse values of recall, F-measure, and NMI than all the other overlapping and disjoint community detection algorithms. TopGC only identifies the top communities in the graph as determined by its scoring function. Therefore, many nodes are not placed in any community, resulting in a very large number of false negatives (and thus in a very low recall and F-measure). On the other hand, the number of false positives is likely to be low, which explains the high precision of the algorithm. For overlapping communities, SLPA achieved the best recall, F-measure, and NMI on all graphs. SLPA has been previously identified as one of the best performing algorithms on overlapping networks.11 For disjoint communities, SLPA also produced very good results in terms of recall, F-measure, and NMI on all graphs except Youtube.
Similarity Measure To further compare the community detection algorithms, the pairwise similarity between the output of the algorithms (i.e., the identified communities) was
© 2014 The Authors. WIREs Computational Statistics published by Wiley Periodicals, Inc.
wires.wiley.com/compstats
Advanced Review
TABLE 3 Performance Metrics for Overlapping Community Detection Metric
SLPA
TopGC
SVINET
CFinder
Recall
.938 [.932; .944]
.134 [.115; .141]
.640 [.617; .747]
.727
Precision
.996 [.992; .999]
.999 [.996; 1 ]
.789 [.492; .837]
1
F -measure
.966 [.962; .969]
.236 [.207; .248]
.719 [.547; .757]
.842
NMI
.826 [.823; .827]
.208 [.170; .246]
.634 [.378; .680]
.649
.917 [.915; .926]
.076 [.057; .094]
.438 [.431; .449]
.293
Amazon
Youtube Recall Precision
.006 [.005; .007]
.381 [.255; .570]
.167 [.142; .187]
.011
F -measure
.012 [.009; .014]
.126 [.103; .144]
.242 [.214; .263]
.022
NMI
.449 [.425; .465]
.067 [.050; .080]
.100 [.063; .163]
.068
.925 [.922; .927]
.131 [.126; .136]
.782 [.773; .875]
.805
DBLP Recall Precision
.840 [.831; .853]
.975 [.944; .984]
.665 [.491; .721]
.925
F -measure
.881 [.875; .888]
.231 [.224; .237]
.742 [.601; .748]
.861
NMI
.820 [.818; .828]
.214 [.165; .245]
.701 [.512; .719]
.843
LiveJournal Recall
.974 [.972; .977]
.166 [.159; .182]
NA
NA
Precision
.933 [.923; .936]
.961 [.957; .970]
NA
NA
F -measure
.953 [.947; .956]
.283 [.273; .307]
NA
NA
NMI
.593 [.592; .595]
.110 [.095; .132]
NA
NA
Recall
.743 [.732; .753]
.003 [.003; .003]
NA
NA
Precision
.483 [.465; .557]
.868 [.865; .874]
NA
NA
F -measure
.587 [.572; .634]
.005 [.005; .005]
NA
NA
NMI
.491 [.481; .496]
0[0;0]
NA
NA
Orkut
SLPA, Speaker-listener Label Propagation Algorithm; TopGC, Top Graph Clusters; NMI, Normalized Mutual Information. Results displayed as median [range] over 10 runs where applicable.
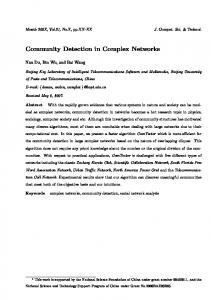
computed. Moreover, the similarity between the output of each algorithm and the ground-truth communities was also determined. The similarity between the output of two community detection algorithms A and B is given by Ref 7: 1 ∑ ||CA (v) ∩ CB (v)|| S (A, B) = (1) n v∈V ||CA (v) ∪ CB (v)|| where Ci (v) is the set of nodes that belong to the same community as v in the output of algorithm i. The similarity matrices for the overlapping and disjoint community detection algorithms are shown in Figure 3. Some of the similarities obtained are relatively consistent across different graphs (e.g., Amazon and Orkut). However, for the Youtube graph, all the community detection algorithms have very different outputs and none of them is very similar to the ground-truth communities. This is likely due to the
unconventional structure of the communities of this graph. In most cases, the outputs of TopGC and SPICi were considerably different from the output of the other algorithms and from the ground-truth communities. This can be partly explained by the fact that both algorithms produce incomplete clusterings of the graph, whereas the ground-truth communities are a complete clustering. In addition, TopGC aims to identify only the most densely connected communities in the graph. For this reason, it usually finds fewer or smaller communities than the other algorithms and than the ground-truth. Furthermore, among the overlapping algorithms, the communities identified by SLPA were the most similar to the ground-truth communities for all graphs. This agrees with the performance metrics obtained in our evaluation and with the conclusion of other community detection empirical surveys.11
© 2014 The Authors. WIREs Computational Statistics published by Wiley Periodicals, Inc.
WIREs Computational Statistics
Community detection in large-scale networks
TABLE 4 Performance Metrics for Disjoint Community Detection Metric
SLPA
TopGC
MCD
CGGCi-RG
CONCLUDE
1[1;1]
.791 [.771; .816] 1 [.999; 1 ]
DSE
SPICi FastGreedy
LPA
LE
Walktrap
1
.639
1
.866
1
1
.974
.999
.956
1
.956
.956
Amazon R
.904 [.889; .923] .061 [.055; .067] .990 [.985; .995]
P
1 [.995; 1]
1 [.995; 1 ]
.956 [.955; .969] .956 [.956; .956]
F
.950 [.941; .960] .114 [.105; .126] .973 [.970; .982] .978 [.978; .978] .883 [.871; .898] .987
.779
.978
.928 .978
.978
NMI
.939 [.932; .948] .079 [.063; .093] .957 [.956; .961] .960 [.960; .960] .861 [.853; .874] .970
.774
.960
.915 .960
.960
R
.875 [.850; .890] .035 [.025; .045] .709 [.700; .714] .926 [.920; .932] .779 [.763; .794] .373
.436
.911
.908 .787
.817
P
.031 [.024; .041] .680 [.536; .765] .501 [.491; .514] .058 [.049; .063] .433 [.227; .480] .756
.564
.041
.014 .008
.040
F
.060 [.047; .079] .066 [.048; .085] .587 [.577; .596] .109 [.094; .117] .555 [.352; .594] .499
.492
.078
.028 .016
.077
NMI
.565 [.548; .579] .043 [.031; .052] .592 [.578; .602] .290 [.287; .298] .678 [.651; .695] .286
.510
.354
.538 .261
.663
Youtube
DBLP R
.912 [.901; .919] .070 [.063; .075] .879 [.877; .884]
P
.954 [.942; .966]
.997 [.987; 1 ]
.855 [.845; .871] .949
.556
1
.884 .998
.997
.847 [.844; .851] .469 [.469; .470] .985 [.975; .994] .948
1 [.999; 1 ]
.972
.461
.972 .459
.284
F
.932 [.922; .942] .131 [.118; .140] .863 [.862; .867] .639 [.639; .639] .918 [.910; .924] .948
.707
.631
.926 .629
.442
NMI
.932 [.925; .939] .073 [.066; .082] .856 [.852; .863] .638 [.638; .638] .911 [.902; .917] .942
.567
.635
.918 .641
.635
LiveJournal R
.983 [.980; .985] .079 [.062; .098] .576 [.575; .578] .994 [.994; .994]
NA
.974
.871
.995
.985 .993
.977
P
.986 [.983; .989] .997 [.991; .998] .859 [.852; .864] .728 [.727; .729]
NA
.981
.994
.644
.967 .088
.988
F
.984 [.984; .986] .147 [.116; .179] .690 [.687; .692] .841 [.839; .841]
NA
.978
.928
.782
.976 .162
.983
NMI
.979 [.977; .980] .109 [.100; .116] .797 [.793; .802] .779 [.776; .779]
NA
.974
.923
.750
.975 .668
.974
R
.989 [.988; .994] .013 [.012; .014] .997 [.994; .999] .999 [.999; .999] .970 [.798; .993] .990
.414
.999
.997 .997
.977
P
.996 [.996; .996]
.997
.996
.996 .992
.996
Orkut
.997 [.993; 1 ]
.996 [.979; .996] .888 [.888; .888] .996 [.996; .997] .804
F
.992 [.992; .995] .026 [.023; .028] .997 [.986; .997] .940 [.940; .940] .983 [.886; .995] .887
.585
.997
.996 .995
.986
NMI
.975 [.969; .982] .073 [.068; .085] .984 [.907; .987] .903 [.903; .903] .942 [.899; .977] .894
.615
.987
.981 .984
.956
SLPA, Speaker-listener Label Propagation Algorithm; TopGC, Top Graph Clusters; MCD, multithreaded community detection; CGGCi-RG, Core Groups Graph Cluster with iterated randomized greedy modularity maximization; CONCLUDE, Complex Network Cluster Detection; DSE, dense subgraph extraction; SPICi, Speed and Performance In Clustering; LPA, Label Propagation Algorithm; LE, leading eigenvector; P, precision; R, recall; F, F-measure; NMI, Normalized Mutual Information. Results displayed as median [range] over 10 runs where applicable.
TABLE 5 Best and Worst Algorithms for Each Goodness and Performance Metric Best Performing Algorithm Metric
Worst Performing Algorithm
Overlapping
Disjoint
Overlapping
Disjoint
TopGC
TopGC
SVINET
—
Clustering coefficient
TopGC
TopGC
SLPA
—
TPR
CFinder
—
—
—
SLPA
CGGCi-RG
TopGC
TopGC
SLPA
CGGCi-RG
TopGC
TopGC
TopGC
—
SLPA, SVINET
—
Goodness metrics Density
Conductance Performance metrics Recall Precision
F -measure
SLPA
—
TopGC
TopGC
NMI
SLPA
—
TopGC
TopGC
TopGC, Top Graph Clusters; SLPA, Speaker-listener Label Propagation Algorithm; CGGCi-RG, Core Groups Graph Cluster with iterated randomized greedy modularity maximization; TPR, triangle participation ratio; NMI, Normalized Mutual Information.
© 2014 The Authors. WIREs Computational Statistics published by Wiley Periodicals, Inc.
wires.wiley.com/compstats
Advanced Review
ground−truth
CFinder
SVINET
SLPA
TopGC
Orkut ground−truth
CFinder
SVINET
TopGC
SLPA
ground−truth
Live journal
CFinder
SVINET
TopGC
SLPA
ground−truth
DBLP
CFinder
SVINET
TopGC
SLPA
Youtube ground−truth
CFinder
SVINET
TopGC
SLPA
Amazon
SLPA
SLPA
TopGC
TopGC
SVINET
SVINET
CFinder
CFinder
SLPA TopGC MCD CGGCi−RG CONCLUDE DSE SPICi FastGreedy LPA LE Walktrap ground−truth
SLPA TopGC MCD CGGCi−RG CONCLUDE DSE SPICi FastGreedy LPA LE Walktrap ground−truth
SLPA TopGC MCD CGGCi−RG CONCLUDE DSE SPICi FastGreedy LPA LE Walktrap ground−truth
SLPA TopGC MCD CGGCi−RG CONCLUDE DSE SPICi FastGreedy LPA LE Walktrap ground−truth
ground−truth
SLPA TopGC MCD CGGCi−RG CONCLUDE DSE SPICi FastGreedy LPA LE Walktrap ground−truth
ground−truth
SLPA TopGC MCD CGGCi−RG CONCLUDE DSE SPICi FastGreedy LPA LE Walktrap ground−truth
SLPA TopGC MCD CGGCi−RG CONCLUDE DSE SPICi FastGreedy LPA LE Walktrap ground−truth
0.0
0.2
0.4
0.6
0.8
1.0
FIGURE 3 | Matrices of pairwise similarity scores for the community detection algorithms and the ground-truth. Dots indicate that a similarity
Youtube
DBLP
LiveJournal
LE
Amazon
FastGreedy
score could not be computed, because one of the algorithms did not finish on that graph within 4 h. Orkut
Time (seconds)
10000
100
1
CFinder
SVINET
TopGC
SLPA
Walktrap
LPA
SPICi
DSE
CONCLUDE
CGGCi−RG
MCD
TopGC
SLPA
0.01
FIGURE 4 | Run-times of the disjoint and overlapping community detection algorithms (including read and write times) per graph. The algorithms were terminated if they did not finish within 4 h. For the nondeterministic algorithms, the average of 10 run-times was taken.
Run-Time Figure 4 shows the run-time of the community detection algorithms on each network. For our evaluations, we used the available implementation of each algorithm (Table 1). Note that the language of these implementations likely had an impact on the run-time. Among the algorithms for overlapping community detection, TopGC had the fastest run-time. CFinder was not able to run on the two largest networks (LiveJournal and Orkut) within the allotted time frame of 4 h. This algorithm is very
computationally expensive and thus may not be appropriate for community detection in large-scale networks. The time complexity of SVINET is not explicitly stated in Ref 16 but it also failed to run on LiveJournal and Orkut. Among the algorithms for disjoint community detection, DSE and SPICi had the fastest run-time in all networks except for LiveJournal. On LiveJournal, MCD had the fastest run-time. Moreover, CONCLUDE did not run on LiveJournal within the allotted time frame.
© 2014 The Authors. WIREs Computational Statistics published by Wiley Periodicals, Inc.
WIREs Computational Statistics
CONCLUSION In this review, we empirically evaluated several state-of-the-art community detection algorithms for overlapping and disjoint community detection on large-scale real-world networks. The algorithms were evaluated by measuring the structural properties of their identified communities, as well as their performance with respect to the known ground-truth communities. Our results show that these two types of measures are not equivalent; an algorithm
Community detection in large-scale networks
that identifies communities with ‘good’ structural properties does not necessarily yield good performance metrics. For example, TopGC obtained good results in terms of goodness metrics (i.e., density, clustering coefficient, and TPR), but it did not perform well when compared against ground-truth communities. In contrast, SLPA did not identify communities with good clustering coefficients. However, it returned the best values for the performance metrics (i.e., recall, precision, and NMI), and the communities it identified were the most similar to the ground-truth.
ACKNOWLEDGMENTS This work was supported in part by the DOE SDAVI Institute and the U.S. National Science Foundation (Expeditions in Computing program).
REFERENCES 1. Adamcsek B, Palla G, Farkas IJ, Derényi I, Vicsek T. Cfinder: locating cliques and overlapping modules in biological networks. Bioinformatics 2006, 22:1021–1023. 2. Reddy PK, Kitsuregawa M, Sreekanth P, Rao SS. A graph based approach to extract a neighborhood customer community for collaborative filtering. In: Subhash Bhalla, eds. Databases in Networked Information Systems. Berlin/Heidelberg: Springer; 2002, 188–200. 3. Steinhaeuser K, Chawla NV, Ganguly AR. Complex networks as a unified framework for descriptive analysis and predictive modeling in climate science. Stat Anal Data Mining 2011, 4:497–511.
11. Xie J, Kelley S, Szymanski BK. Overlapping community detection in networks: the state-of-the-art and comparative study. ACM Comput Surv 2013, 45:43. 12. Leskovec J, Lang KJ, Mahoney MW. Empirical comparison of algorithms for network community detection. CoRR, abs/1004.3539, 2010. 13. Moradi F, Olovsson T, Tsigas P. An evaluation of community detection algorithms on large-scale email traffic. In: SEA. Berlin/Heidelberg: Springer; 2012; 283–294. 14. Xie J, Szymanski BK. Towards linear time overlapping community detection in social networks. In: PAKDD. Berlin/Heidelberg: Springer; 2012, 25–36.
4. Fortunato S. Community detection in graphs. CoRR, abs/0906.0612, 2009.
15. Macropol K, Singh AK. Scalable discovery of best clusters on large graphs. Proc VLDB Endowment 2010, 3:693–702.
5. Coscia M, Giannotti F, Pedreschi D. A classification for community discovery methods in complex networks. CoRR, abs/1206.3552, 2012.
16. Gopalan PK, Blei DM. Efficient discovery of overlapping communities in massive networks. Proc Natl Acad Sci 2013, 110:14534–14539.
6. Crampes M, Plantié M. A unified community detection, visualization and analysis method. CoRR, abs/1301.7006, 2013.
17. Riedy J, Bader DA, Meyerhenke H. Scalable multithreaded community detection in social networks. In: Parallel and Distributed Processing Symposium Workshops & PhD Forum (IPDPSW), 2012 IEEE 26th International. Washington, DC: IEEE; 2012, 1619–1628.
7. Malliaros FD, Vazirgiannis M. Clustering and community detection in directed networks: a survey. CoRR, abs/1308.0971, 2013. 8. Danon L, Diaz-Guilera A, Duch J, Arenas A. Comparing community structure identification. J Stat Mech Theor Exp 2005, 2005:P09008. 9. Lancichinetti A, Fortunato S. Community detection algorithms: a comparative analysis. Phys Rev E 2009, 80:056117. 10. Orman GK, Labatut V, Cherifi H. Comparative evaluation of community detection algorithms: a topological approach. J Stat Mech Theor Exp 2012, 2012: P08001.
18. Ovelgönne M, Geyer-Schulz A. An ensemble learning strategy for graph clustering. In: Bader DA, Meyerhenke H, Sanders P, Wagner D, eds. Graph Partitioning and Graph Clustering. Providence, RI: American Mathematical Society; 2012, 187–206. 19. De Meo P, Ferrara E, Fiumara G, Provetti A. Mixing local and global information for community detection in large networks. J Comput Syst Sci 2014, 80:72–87. 20. Chen J, Saad Y. Dense subgraph extraction with application to community detection. IEEE Trans Knowl Data Eng 2012, 24:1216–1230.
© 2014 The Authors. WIREs Computational Statistics published by Wiley Periodicals, Inc.
wires.wiley.com/compstats
Advanced Review
21. Jiang P, Singh M. Spici: a fast clustering algorithm for large biological networks. Bioinformatics 2010, 26:1105–1111.
28. Airoldi EM, Blei DM, Fienberg SE, Xing EP. Mixed membership stochastic blockmodels. J Mach Learn Res 2008, 9:1981–2014.
22. Clauset A, Newman MEJ, Moore C. Finding community structure in very large networks. Phys Rev E 2004, 70:066111.
29. Blondel VD, Guillaume J-L, Lambiotte R, Lefebvre E. Fast unfolding of communities in large networks. J Stat Mech Theor Exp 2008, 2008:P10008.
23. Raghavan UN, Albert R, Kumara S. Near linear time algorithm to detect community structures in large-scale networks. Phys Rev E 2007, 76:036106.
30. Saad Y. Finding exact and approximate block structures for ilu preconditioning. SIAM J Sci Comput 2003, 24:1107–1123.
24. Newman MEJ. Finding community structure in networks using the eigenvectors of matrices. Phys Rev E 2006, 74:036104.
31. Altaf-Ul-Amin M, Shinbo Y, Mihara K, Kurokawa K, Kanaya S. Development and implementation of an algorithm for detection of protein complexes in large interaction networks. BMC Bioinformatics 2006, 7:207.
25. Pons P, Latapy M. Computing communities in large networks using random walks. In: Proceedings of the 20th International Conference on Computer and Information Sciences. Berlin/Heidelberg: Springer-Verlag; 2005, 284–293. 26. Palla G, Derényi I, Farkas I, Vicsek T. Uncovering the overlapping community structure of complex networks in nature and society. Nature 2005, 435: 814–818. 27. Tomita E, Tanaka A, Takahashi H. The worst-case time complexity for generating all maximal cliques. In Chwa KY, Munro JI, eds. Computing and Combinatorics. Berlin/Heidelberg: Springer; 2004, 161–170.
32. Yang J, Leskovec J. Defining and evaluating network communities based on ground-truth. In: ICDM. New York, NY: ACM; 2012, 745–754. 33. Samatova NF, Hendrix W, Jenkins J, Padmanabhan K, Chakraborty A. In: Samatova NF, Hendrix W, Jenkins J, Padmanabhan K, Chakraborty A, eds. Practical Graph Mining with R. Chapman and Hall/CRC: CRC Press; 2013. 34. McDaid AF, Greene D, Hurley NJ. Normalized mutual information to evaluate overlapping community finding algorithms. CoRR, abs/1110.2515, 2011.
© 2014 The Authors. WIREs Computational Statistics published by Wiley Periodicals, Inc.