IEEE TRANSACTIONS ON INSTRUMENTATION AND MEASUREMENT, VOL. 59, NO. 5, MAY 2010
1439
ISDP: Interactive Software Development Platform for Household Appliance Testing Industry Zhongwen Guo, Member, IEEE, Pengpeng Chen, Yuan Feng, Member, IEEE, Yongguo Jiang, and Feng Hong, Member, IEEE
Abstract—Distributed measurement systems (DMSs) are widely adopted to assist the design and testing of household appliances. Unfortunately, a reference model rarely rules the development of those systems, leading to poor software quality and bringing many troubles in the process of maintenance and integration. Furthermore, the development of measurement systems often suffers from low efficiency due to the complex programming and debugging process. To address the aforementioned issues, we first present a universal reference model serving as a foundation in the design of DMSs, particularly for the household appliance testing industry. The model provides the design criteria and methodologies of DMSs in terms of data collection and management. Then, according to the model, an interactive platform is built to facilitate the software development of DMSs for both local and web-based applications. The platform consists of the reusable component libraries, the client-based assembly subsystem, the web-based assembly subsystem, the data collection subsystem, and the customization subsystem. The software development process for measurement systems is turned into configuring parameters through interactive dialog boxes. The development efficiency and performance of the system generated by the platform are evaluated. Moreover, the model and platform are validated by various development cases for manufacturing enterprises. The results demonstrate that the model is feasible and that the platform remarkably improves the development efficiency and software quality. Index Terms—Data collection, development platform, household appliances, measurement systems, model.
I. I NTRODUCTION
P
RODUCT testing is an essential part of the manufacturing process in the household appliance industry. It contains various tests such as performance test, sample test, and reliability test [1]. All the tests are completed by the measurement systems in multiple test laboratories distributed over a wide geographic area. These distributed measurement systems (DMSs) become a part of standard production lines, owing to their cost-effectiveness, reliability, and flexibility. They mainly Manuscript received June 29, 2009; revised December 6, 2009. First published February 1, 2010; current version published April 7, 2010. This work was supported in part by the National High Technology Research and Development Program of China (863 Program) under Grant 2006AA09Z113, by the National Natural Science Foundation of China under Grant 60873248, and by the Key Program of National Natural Science Foundation of China under Grant 60933011. The Associate Editor coordinating the review process for this paper was Dr. Serge Demidenko. The authors are with the Department of Computer Science and Technology, College of Information Science and Engineering, Ocean University of China, Qingdao 266003, China (e-mail:
[email protected];
[email protected];
[email protected];
[email protected];
[email protected]). Color versions of one or more of the figures in this paper are available online at http://ieeexplore.ieee.org. Digital Object Identifier 10.1109/TIM.2010.2040931
include three parts: instruments, computers, and supervision software. The software part, which is called test software in this paper, is responsible for automatically collecting, managing, analyzing, and presenting the data for the users. Therefore, it is regarded as the backbone of DMSs. With the rapid development of the household appliance industry, web-based services like the remote query are highly demanded for purposes other than the local measurement in the laboratory. Hence, the task of software development becomes more and more important and challenging. There are two approaches for the software development of DMSs: commercial software tools and textual programming. They are compared in [2]. The first one, which includes LabVIEW, Lab-Windows/CVI, and HP VEE, is specifically designed for measurement applications. The second one, which includes C++ and Java, is relatively flexible, and the designer can freely implement the system function. Although these tools are powerful for development, directly utilizing them often suffers from several problems. First, the developer has to spend lots of time on writing the codes or assembling complex block diagrams and debugging them, resulting in a long development cycle, high cost, and low efficiency. Second, the developer must be familiar with several programming languages and diverse instruments, which is obviously a nontrivial job. Third, because the traditional tools offer a low standardization as they are applied to a special domain, it is difficult to seamlessly integrate the systems or to update them. Most of previous works on DMSs are mainly about solving particular problems [3]–[8] or architecture study [9]–[13]. Few research works focus on further simplifying the system development. In [14], an advanced modular conception of software designed for the purpose of dynamic analog-to-digital converter testing is presented. They just discuss the main principles of development, software blocks, and application modes. Improvements to an innovative instrument software test methodology have been proposed in [15]. It focuses on testing measurement software using new statistical tools for improving the code-and-debugging cycle. And an automated software testing has been realized in [16] for granting a software high quality level. These works focus on the design and testing of measurement software and do not offer a specific development approach to remarkably simplify the software design, particularly for simplifying the coding work. In [17], a virtual environment for the development of distributed measurement applications is proposed. The environment is based on a client/server architecture, and a composer tool is designed to allow a fast development of a new client application. In another similar work [18], a Java-based software environment for DMS
0018-9456/$26.00 © 2010 IEEE Authorized licensed use limited to: University of Minnesota. Downloaded on May 19,2010 at 18:04:51 UTC from IEEE Xplore. Restrictions apply.
1440
IEEE TRANSACTIONS ON INSTRUMENTATION AND MEASUREMENT, VOL. 59, NO. 5, MAY 2010
Fig. 1. Typical hardware structure for testing appliances.
design is proposed. They both design a graphical environment for making front panels of measuring instruments and systems. Virtual panels are designed for the instruments in their works. However, instead of operating and controlling the instruments, the users pay more attention to collecting the sampled data of all instruments equipped, managing them, and evaluating the product performance in the household appliance test field. In addition, various international test standards of appliances [19]–[22] for calculating the product performance should be considered as well. Existing solutions are hard to well meet the requirements of the household appliance test field. The need to design a new development platform that can support the quick development of DMSs for household appliance testing arises. For building an advanced platform to develop scalable and maintainable measurement applications, a reference model of DMSs from the view of system development should first be constructed by extracting the essential characters. In this paper, we analyze the commonalities and variabilities of measurement applications and construct a reference model that introduces the standardized view on DMS. Then, according to the model, we employ software engineering methodologies to leverage past accomplishments and build an advanced interactive software development platform (ISDP) based on a database. The development of test software becomes visual and, hence, efficient. The designer can develop the software for household appliances testing without writing any code. To the best of our knowledge, the platform is the first custom-built one to develop test software for household appliances. It is important to note that, although the development platform is intended to be used to develop test software for household appliances, the platform can also be applied to other fields like water quality monitoring and blood cold chain wireless monitoring [23]. Furthermore, with the help of the platform, a web-based ocean monitoring system for the OceanSense project based on wireless sensor networks has been developed in a very short time, which is available at [24]. This paper is structured as follows. Section II describes reference model of measurement systems, which is the basis of the development platform. The design strategy is presented in
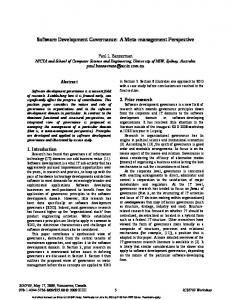
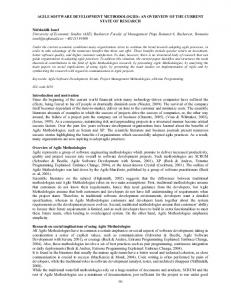
Section III. Section IV illustrates the development platform and its implementation. The software development procedure and the system deployment are illustrated in Section V. Section VI evaluates the development efficiency and system performance. The application examples are also given. Finally, conclusions are presented together with future works. II. R EFERENCE MODEL FOR DMS The trend in the recent years has been to migrate away from proprietary hardware and software platforms for DMSs in favor of open and standardized approaches [25]. However, in the household appliance test field, there is no existing reference model that guides the development of measurement systems. Therefore, specific solutions are commonly developed as needs arise. This situation leads to the problems of universality, maintainability, and integration. In this section, a general model of DMSs is provided. The services offered by the reference model are illustrated, followed by an insight on the exchange standard among layers. Based only on the reference model, an advanced software development platform can be designed, and the systems generated from the development platform are interoperable, scalable, and powerful. A. Background Most of the test systems for household appliances follow the following structure: a number of instruments are connected to a data collection PC using standard interfaces such as the RS485, GPIB, and Ethernet; each instrument is equipped with many sensors; several sensors constitute a test unit, which is used to monitor one appliance’s status like temperature, electricity, pressure, and so on. One test unit corresponds to one appliance, as illustrated in Fig. 1. In the test software, there are several parts for describing a test unit: the textual data presentation part, in which the monitoring data are shown in numeric form; the trend display part, in which the change trends of sensors in the test unit are displayed by the curves with different colors; the curve printing
Authorized licensed use limited to: University of Minnesota. Downloaded on May 19,2010 at 18:04:51 UTC from IEEE Xplore. Restrictions apply.
GUO et al.: ISDP: INTERACTIVE SOFTWARE DEVELOPMENT PLATFORM FOR HOUSEHOLD APPLIANCE TESTING INDUSTRY
Fig. 2.
Layered model of DMSs.
and report part, which is used to print the curves and export the testing results in the form of a spreadsheet file; and the testing result query part, in which the historical data of the test unit can be queried. Furthermore, one of the main configuration operations in the design process is about test units, which will be described in the following section. B. Layer Architecture The reference model is designed on the basis of a requirement analysis of measurement systems for household appliance testing. It provides a functional framework for the orderly development of DMSs. Furthermore, it models the system as being logically composed of a hierarchy of layers. Each layer defines a subset of the services necessary to the measurement system. Fig. 2 shows the layered structure. The layers are the physical layer, the collection layer, the management layer, and the application layer, respectively. The lower level functions are more basic and prerequisite for the higher level functions. Each layer utilizes the services of the adjacent lower layer while providing its services to the next higher layer. The physical layer measures a physical quantity and converts it into an electrical signal. It mainly consists of communication port, data acquisition instruments, and sensors. The data acquisition equipment is the building blocks of versatile DMSs. Based on them people can finish their specific measurement tasks. The collection layer consists of a set of classes and interfaces which are used to communicate with the data acquisition equipment. Its importance lies in the fact that it is the link between the low-level data acquisition hardware and the highlevel management system. The layer has the following features: it provides the functional means to collect the data from the physical layer and transfer the data to the aforementioned layer periodically; it attempts to detect and correct the configuration errors of acquisition hardware. For example, it can detect whether the configuration parameters of instruments are the same as the configurations that are set in advance. If not, the instruments can be reset; it performs the control of the acquisition equipment, like turning on or off the instruments, and returns the performing status. The management layer is mainly responsible for performing three tasks. First, it deals with the request and visit from the above layer and provides interfaces for receiving data from
1441
the lower layer. When sampled values arrive, this layer will first preprocess the raw measurement data. In particular, the definition of virtual sensors, which are used to describe some parameters is introduced. Instead of measuring from real sensors, the values of these virtual sensors are got by calculating other sensors’ sampled data. For example, the average value of multiple real temperature sensors can be viewed as the value of a virtual sensor. The virtual sensor should be treated identically with other real physical sensors. For example, its real-time curve is also drawn. The introduction of virtual sensors is mainly for simplifying the software design. Second, it takes charge of the data schedule, such as accessing data from the database. Third, it stores the configuration settings of measurement systems, which are the regular parameters or configuration information of DMSs in both the software and hardware sides. The application layer is actually composed of clients with different modalities that run on PCs. It provides both the local and web-based services to translate the raw measurement results to a more useful and meaningful format. For the local services, the operator can supervise and control their measurement process in the local laboratories via the desktop applications. For the web-based services, the remote user can visit the measurement data by any browser without installing client applications. In either the local or the web applications, several necessary functions must be offered for the end user, like the graphical data presentation, textual data presentation, measurement result query, and measurement result printing and exporting. C. Interactions Between Layers The reference model provides a framework for identifying the major functional blocks of DMSs. Moreover, it specifies the interactions between layers, such as the definition of allowable sequences and formats of exchanged messages. In addition, it also extracts the common application settings from various household appliance test systems. These settings are often reconfigured when developing new systems. Two schemas are designed for describing these settings, which are the application configuration schema and the collection setting schema, respectively. The extraction of the application settings and standardization of the configuration format can achieve the aim of changing the configuration without having to recompile the codes, which saves the programmer a lot of time and effort. The two schemas are the basis of the development platform and will further be described below. The communications between the physical and collection layers are classified into the GPIB bus, Ethernet, the serial bus, Zigbee, the PCI bus, and so on. Based on the communication interfaces of the hardware equipment, the two layers exchange information by the proprietary protocols offered by the manufacturers, as shown in Fig. 3. Therefore, it is not necessary to specify the additional protocols. The collection layer transfers the communication commands to the physical layer, and the physical layer returns the execution results in ASCII string or binary format. It is noted that the communication commands refer to the commands defined by the manufacturers in advance.
Authorized licensed use limited to: University of Minnesota. Downloaded on May 19,2010 at 18:04:51 UTC from IEEE Xplore. Restrictions apply.
1442
IEEE TRANSACTIONS ON INSTRUMENTATION AND MEASUREMENT, VOL. 59, NO. 5, MAY 2010
Fig. 3. Interaction between the physical and collection layers.
ical commands achieves the aim of instrument independence. Any instrument in the physical layer can be replaced without impacting the high layer. For the measurement data access between the two layers, two types of data are contained, as shown in Fig. 7(b). There are the basic measurement metadata (the description of the measurement process, like the laboratory name, the number of sensors, the test time, and the instrument information) and the sensor data (the samples of sensors, the sensor type, the precision, and so on). For the configuration data, two parts are included, as shown in Fig. 7(c). One is the configuration data for describing the test units, which are mainly curve display parameters for test units; the other is for building an input form that provides the user with an interface for inputting the information of household appliances. The applications will read the configuration data to finish initialization when running. III. ISDP D ESIGN A. Design Strategy
Fig. 4. Interaction between the collection and management layers.
Fig. 4 shows the interaction between the collection layer and the management layer. The two layers communicate based on TCP/IP, and their interaction realization can be based on web service technology. The exchange variables between them can be regarded as quadruples (t, v, i, s), where t is a time stamp that represents the sampled time, v is the value of a sensor at time t, i refers to the instrument that the sensor belongs to, and s indicates the sequence number of the sensor. The implementation of the quadruples can be XML or ASCII. Furthermore, its schema can be seen in Fig. 5(a). After the management layer correctly receives all the quadruples, it will return an acknowledgment. The main advantage of the quadruples is that they offer a simple format for receiving data from the lower layer or other similar data acquisition systems, further promoting the system integration. In addition, a schema is designed for describing the main settings of data collection systems, which are about the interface, channel, and data collection function of instruments, as shown in Fig. 5(b). The main exchanges between the management layer and the application layer are collection commands, measurement data, and configuration data, as shown in Fig. 6. For the collection commands, the model adopts the logical commands, which schema can be seen in Fig. 7(a). Generally, different instrument manufacturers have different commands to control and acquire data from their data acquisition equipment. These manufacturers’ commands are defined as physical commands in this paper. To make the lower mechanism transparent, the model defines the logical commands to unify the access and control of diverse data acquisition equipment. The logical commands will be remapped into the real commands in the collection layer so that the equipment can recognize them. The use of the log-
One of the primary design goals of the development platform is to construct the measurement systems following the reference model aforementioned. For the realization of the data collection layer, a stand-alone subsystem can be built. For the management layer, the critical performance parameters, which are used to describe the performance of appliances, can be viewed as virtual sensors, as defined in the reference model. Their “monitoring” values can be got from special calculation functions, which are constructed according to the international test standards of household appliances. In the application layer, the approach of component-based development is widely used for the software development [26]. Because the functions of the test software for different appliances are fixed and similar, it is possible to design several reusable components that implement the common functions. Furthermore, the attributes and elements in the schemas presented in the model can be defined in the components. By assembling these components, the test software can easily be generated. In addition, there are often many application settings in a test system. To specify them in a convenient and standard way, two ways are presented in this paper. One is to create the XML configuration files based on the schema in the model and then import them to a database, which is a little complicated and requires the developer to know the relevant knowledge. The other way is to design a friendly interactive interface for specifying settings and storing them into a database, which does not require the developer to know the programming language. B. Roles Definitions According to the design strategy, some roles from the perspective of the development platform are defined in this paper. Some terms will be used, which may not have the same signification as the ones used in other literature. 1) Builder: It refers to the designer of ISDP. The authors are the builders who build the basic development platform. We must know the programming language and constitute
Authorized licensed use limited to: University of Minnesota. Downloaded on May 19,2010 at 18:04:51 UTC from IEEE Xplore. Restrictions apply.
GUO et al.: ISDP: INTERACTIVE SOFTWARE DEVELOPMENT PLATFORM FOR HOUSEHOLD APPLIANCE TESTING INDUSTRY
Fig. 5.
Fig. 6.
1443
XML schemas. (a) Exchange sampled data in the XML schema. (b) Collection settings in the XML schema.
Interaction between the management and application layers.
the criterion for software configuration and integrating new data acquisition devices. 2) Improver: It refers to the person who further improves the platform. The improver mainly operates configuration files to integrate new devices or develop software. Few codes may be written. 3) Designer: It refers to the person who uses ISDP to construct the test software. The person is guided by the platform step by step to finish the development process. 4) Tester: It refers to the person who operates the test software in the laboratory. The test of the household appliances and the control of the instruments can be completed by the tester. IV. ISDP I MPLEMENTATION In this section, the whole ISDP structure and the database design are first introduced, and then, all parts of ISDP are described one by one. A. ISDP Structure Fig. 8 shows the complete platform architecture. The platform consists of the reusable component libraries, the data
collection subsystem, the client-based assembly subsystem, the web-based assembly subsystem, and the customization subsystem. All of them are integrated based on the database. Specifically, the reusable component libraries contain the web-based component library and client-based component library, which support the web-based and local test applications, respectively. The web-based components and client-based components are assembled into two subsystems, which are the web-based assembly subsystem and the client-based assembly subsystem. The data collection subsystem is responsible for collecting all the monitoring data from the instruments or acquisition boards. The customization subsystem offers the designer some assistants to specify the overall parameters of the test software and store the parameters into database. These assistants provide a friendly interface to guide the designer step by step and allow him to go back and forth in the design process.
B. Database Overview Now, the whole development procedure is presented. First, the designer specifies the configuration parameters and stores them into the database using the customization subsystem. Then, both the client-based and web-based applications obtain the parameters to initialize their own components. In addition, the two applications often obtain or modify the information from the database in the test process of the appliances. Hence, the design of the database is crucial. The database was created using Oracle 10g, and the following database tables are designed: software configuration tables that contain all the configuration parameters of the client-based and web-based test software, a product information table, a test data table, and a user information table. Fig. 9 illustrates the main database schema used in this paper. A detailed description of these tables is provided below. 1) Software configuration tables: They mainly correspond to the application configuration schema and collection
Authorized licensed use limited to: University of Minnesota. Downloaded on May 19,2010 at 18:04:51 UTC from IEEE Xplore. Restrictions apply.
1444
IEEE TRANSACTIONS ON INSTRUMENTATION AND MEASUREMENT, VOL. 59, NO. 5, MAY 2010
Fig. 7. XML schemas. (a) Logical commands in the XML schema. (b) Measurement information structure in the XML schema. (c) Application configuration schema.
Fig. 8. Platform structure.
settings schema. Here, only the tables about the application configuration are given: the TestUnitConfig table, which is used to store the relevant information about a test unit; the SubwindowConfig table, which stores all the subwindow information for displaying sensor curves; the CoordinateConfig table, which contains the coordinate parameters such as the unit and the name in the subwindows; the SensorConfig table, which stores the sensor parameters for drawing curves like color and ID of the coordinate; and the InputInfoConfig table, which contains parameters for building a product input form. All these tables are denoted by blue in the figure. 2) Product information table: It stores the basic information for testing appliances, such as the begin time of testing, the end time of testing, the appliance type, and the serial number of appliance. It refers to the InputInfoValue in the figure, which is represented by green. 3) Test data table: It is used to store the sampled values and the calculation data.
Authorized licensed use limited to: University of Minnesota. Downloaded on May 19,2010 at 18:04:51 UTC from IEEE Xplore. Restrictions apply.
GUO et al.: ISDP: INTERACTIVE SOFTWARE DEVELOPMENT PLATFORM FOR HOUSEHOLD APPLIANCE TESTING INDUSTRY
Fig. 9.
1445
Database table structure.
Fig. 10. XML files. (a) Logical commands in an XML file. (b) Sampled data in an XML file.
4) User information table: All the users’ information and their ranks are stored in this table.
C. Reusable Component Libraries The client-based and web-based component libraries have been designed. Components in the two libraries perform similar tasks and functions but with their own modalities. The clientbased components are constructed by the Microsoft Visual Studio, and the web-based components are developed based on Java. They are configurable and have already been verified. In the household appliance test case, the following components have been designed: product information input component (CInput); trend display and operation component (CDisp); numeric display component (CNum); historical viewer component (CHis); testing result export component (CExp); and data management component (CMan).
D. Data Collection Subsystem A scalable and stand-alone subsystem that supports most common data acquisition instruments is built. The verified subsystem remarkably shortens the debugging time of communicating with hardware. When applied to other test applications, it is adjusted by resetting the parameters. Web service technology is adopted in the implementation process, which can make instruments accessible in a standard-based and uniform way. In the implementation process, the subsystem adopts the logical commands defined in the reference model for communicating with all instruments, and an XML file of logical commands is given as an example in Fig. 10(a). For example, when receiving the logical command of “RequireAll”, all instruments will be collected, and all the sampled data will be sent. In the household appliance test filed, multiple clients can visit a laboratory’s test data. The collection subsystem gathers data in a periodic fashion. It listens for the clients’ data
Authorized licensed use limited to: University of Minnesota. Downloaded on May 19,2010 at 18:04:51 UTC from IEEE Xplore. Restrictions apply.
1446
IEEE TRANSACTIONS ON INSTRUMENTATION AND MEASUREMENT, VOL. 59, NO. 5, MAY 2010
All the realizations of uniform services access and uniform data collection commands can make the designer create portable and scalable data acquisition systems without knowing any programming knowledge of the instruments. Fig. 12 shows the message sequence chart that illustrates the workflow of the subsystem. It is pointed out that this subsystem is constructed based on our previous projects, and it only supports most of common instruments now. However, the improver can integrate any new instrument just by adding DLLs and specifying the collection setting library without recompiling the subsystem, because of the good design of the subsystem. E. Assembly Subsystems
Fig. 11. Structure of the data collection subsystem.
request and transfers the corresponding updated data to each client in a standard XML format, no matter which instruments are equipped. The simple sampled data XML file is shown in Fig. 10(b). Generally, a client does not aggregate data from multiple data collection systems, because a data collection system corresponds to a test laboratory and the user just focuses on a laboratory’s test data at a certain time. Therefore, there is no synchronization problem between multiple data collection subsystems. Fig. 11 shows the layered subsystem. From the bottom to the top, it consists of the communication interface layer, the driver layer, the middleware layer, and the service layer. The entities of the interface and driver layers are provided by the instrument manufacturers. The middleware layer is responsible for periodically gathering data from all the instruments. There exist two main programs: the data interface program and the periodic collection program. The data interface program takes charge of receiving the logical commands. It also aggregates the sampled data got from the periodic collection program into XML format. The periodic collection program calls the data collection functions based on the configuration information library. It is used to store the specified instrument settings like communication interfaces, channel settings, and the data collection function name. The data collection function library can be implemented by a dynamic-link library (DLL). Furthermore, the DLL path, the DLL name, and the function names defined in the DLL should be specified in the collection setting library. Then, the data collection subsystem can perform the DLL reference and call the functions in the DLL. The service layer mainly includes the collection service and the registry service. The service consumer and provider communicate with each other through a simple object access protocol (SOAP). Based on the aforementioned design, the subsystem should achieve the aim of hardware independence and reuse, as described in [27].
The web-based assembly subsystem and the client-based assembly subsystem have been developed in the platform. Furthermore, the database access functions that are called by the runtime systems are both provided in the two subsystems. Those database access functions are implemented and assembled in advance. It allows the designer to use database functions without knowing much about database programming knowledge. For the web-based data query, the web-based components developed in advance are assembled. For the local test, clientbased components are integrated. Hence, the database, the data collection subsystem, and the assembly subsystems construct the whole test software. Based on the assembly subsystems, various types of test software for different requirements can be generated by adjusting the corresponding parameters. F. Customization Subsystem For speeding up the setting process of parameters for the designer, the customization subsystem is developed. The subsystem contains several assistants that drastically accelerate the design process. The designer can specify the parameters of the assembly subsystems and check them via the subsystem. The detailed descriptions are described in [28]. 1) Parameters Configuration Assistant: The assembly subsystems contain several components with many attributes. The functions provided by CNum, CHis, CMan, and CExp are relatively common and fixed. Once they are developed, the designer rarely resets them. However, the data collection subsystem and other components like CInput and CDisp are often reset to adapt various test applications. This assistant provides several friendly dialog boxes to guide the designer step by step and allows the designer to go back and forth in the design process. 1) Settings for basic information: The designer should first specify the basic information as the precondition for the following operations, such as the name of the software, the type of appliances, and the total number of sensors, as shown in Fig. 13(a). It is noted that the number of the virtual sensors should be included in the specified total number of the sensors if the virtual sensors are adopted in the test software. 2) Settings for CDisp: In the CDisp, the subwindow class, the sensor class, and the coordinate class have been designed. The main operations for the designer are only
Authorized licensed use limited to: University of Minnesota. Downloaded on May 19,2010 at 18:04:51 UTC from IEEE Xplore. Restrictions apply.
GUO et al.: ISDP: INTERACTIVE SOFTWARE DEVELOPMENT PLATFORM FOR HOUSEHOLD APPLIANCE TESTING INDUSTRY
1447
Fig. 12. Message sequence chart.
Fig. 13. Graphical user interface screens of the parameter configuration assistant. (a) Basic information configuration dialog. (b) Display configuration dialog. (c) Product information input configuration dialog. (d) Data acquisition configuration dialog.
the attribute configuration, as illustrated in Fig. 13(b). In particular, in this step, the display parameters of virtual sensors should also be specified like the other real sensors, like its color and name. 3) Settings for CInput: This step allows the designer to specify which information should be obtained from testers. The designer first specifies the number of each input
type, as shown in Fig. 13(c). Then, the assistant asks the designer to input the default contents one by one. 4) Settings for the data collection subsystem: Two configuration methods are offered for the data collection subsystem. One is reloading the configuration files, which are ever used in the past; the other is customization mode. In the customization mode, the new setting information can
Authorized licensed use limited to: University of Minnesota. Downloaded on May 19,2010 at 18:04:51 UTC from IEEE Xplore. Restrictions apply.
1448
IEEE TRANSACTIONS ON INSTRUMENTATION AND MEASUREMENT, VOL. 59, NO. 5, MAY 2010
Fig. 14. Configuration XML files. (a) Application configuration XML file. (b) Collection setting XML file.
be saved as a new configuration file, which can be reused in future applications. 2) Validity Confirmation Assistant: After all the parameters have been specified, the designer performs the consistency checking to scan the possible errors in the design process and several aspects of the application. When finishing the error checking, the new test software is generated. Another way to specify these parameters is to create the XML configuration document based on the defined schema in the model. Considering the paper length, Fig. 14(a) and (b) just display parts of the application configuration and the collection setting XML documents, respectively. After specifying the parameters, the XML files will be imported into the database. V. P ERFORMANCE E VALUATION AND A PPLICATIONS A. System Deployment After finishing the parameters configuration, the test system can be deployed, as shown in Fig. 15. Generally, the physical layer is implemented by real acquisition hardware. The appli-
Fig. 15.
System deployment.
cation layer lies on the client application, while the collection layer and the management layer lie on the server application. The client finds the server by the directory services, and the directory is configured in advance. In the real deployment, the application layer, the management layer, and the collection layer can be implemented in a single computer with high performance.
Authorized licensed use limited to: University of Minnesota. Downloaded on May 19,2010 at 18:04:51 UTC from IEEE Xplore. Restrictions apply.
GUO et al.: ISDP: INTERACTIVE SOFTWARE DEVELOPMENT PLATFORM FOR HOUSEHOLD APPLIANCE TESTING INDUSTRY
Fig. 16. Development efficiency comparison among different approaches.
B. Development Efficiency A traditional development platform consists of many parts like the programming language, the runtime environment, and the reusable library. To learn a new object-oriented programming language may take a few days. Furthermore, it can take one or two months to learn the details of a new development tool like Microsoft Visual C++ and even longer to become familiar with its use. ISDP is an interactive platform that guides the designer step by step. All of the operations are provided by dialog boxes. The designer need not know any programming language. Hence, the development efficiency is remarkably improved. The ISDP development efficiency is further evaluated in terms of system development, testing, and maintenance based on the refrigerator testing case. The test software is used to store and analyze the change trend of the refrigerators’ temperature and electricity. For building such a local test system, four software development approaches have been adopted: the coding approach, in which the test software is developed from zero by the Microsoft Visual Basic; the modification approach, in which the software is developed by modifying the codes from other similar projects, for example, the programmer develops a new test system for refrigerators based on the prevenient test system, in which the number of test units and sensors, software interfaces, and data collection instruments are different (all the differences have to be modified one by one in this approach); the component approach, in which the designer assembles the existing components and writes few codes for development; and the ISDP approach, in which the software is developed by the proposed platform. The designer just performs the parameter configuration based on requirements. The whole development cycle, including development, testing, and maintenance, is statistically evaluated for each approach. The comparison results can be seen from Fig. 16.
C. System Performance Due to the adoption of the XML and SOAP standards, the performance of real-time data update is not excellent. However, in the household appliance test field, the tester focuses more on the data analysis. The sampling interval for data collection can
1449
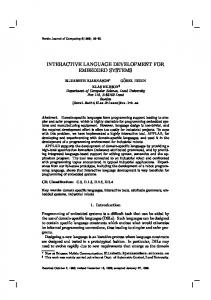
be set as 15 to 30 s. Generally, this speed of data update can meet the testers’ requirements. The graphic presentation is very important in the household appliance test field, so the graph generation time is evaluated when querying different amounts of data for both the clientbased and web-based test software. The total time from the user request to result display includes the cost time of reading data from the database, the result transfer time from the server to the client side, the time of drawing curve, the client request time, the server parse time, and so on. For the web-based test software, the data reading from the database and curve drawing are finished by the server side. A picture with drawn curves is transferred to the client. In the client-based test software, the original data are transferred to the client and then converted into a graph by the client. For evaluating the system performance, experiments are conducted in three environments, in which the client and the server are connected to a LAN, WAN, and wireless network, respectively. We build the wireless environment based on an access point (AP), which uses IEEE 802.11 standards. Within the range of the AP, the client equipped with a wireless LAN adapter can connect to the server. In addition, a computer named C1 with dual Pentium processors and 2 GB of RAM is employed as the server. Furthermore, another computer named C2, which is equipped with 1 GB of RAM, is used as the client. Moreover, Oracle 10g is installed in the two computers. As illustrated in Fig. 17(a), when few data are transferred, the response time of the client-based test software is less than the web-based test software, no matter in which environment they are. However, the web-based test software does better than the client-based test software when gradually increasing the amount of data, as shown in Fig. 17(b). That is because, in the web-based test software, the curve is drawn in the server side and only a picture is transferred instead of transferring lots of data to the client and then drawing in the client-based test software. To fairly estimate their performance without considering the impact of network transferring, the client-based and webbased test software are deployed on the same computer, which is used as the server and client. Experiments are performed on the C1 and C2, respectively. The performance gap between the two kinds of software is tiny, as shown in Fig. 17(c). In all, the client-based test software has rich interfaces and interaction, as well as good performance in graph generation time when querying small amounts of data. However, the data have to be transmitted to the client, which is not suitable for a low-speed network. It should be adopted for the local test applications in the LAN environment. The web-based test software has excellent remote query performance without transferring lots of data. However, the user interaction by the browser is poor. The implementation of curve zooming in, zooming out, moving, and marking is complex, and these operations are unfriendly. Hence, the web-based test software mainly serves the enterprise manager for remote test. D. Application Example The new platform has been validated by applying it to developing test software for many types of appliances such as
Authorized licensed use limited to: University of Minnesota. Downloaded on May 19,2010 at 18:04:51 UTC from IEEE Xplore. Restrictions apply.
1450
IEEE TRANSACTIONS ON INSTRUMENTATION AND MEASUREMENT, VOL. 59, NO. 5, MAY 2010
Fig. 17. Performance evaluation. (a) Graph generation time when querying small amounts of data. (b) Graph generation time when querying large amounts of data. (c) Graph generation time when running on the same computer.
Fig. 18. Topology structure and test laboratories. (a) System topology. (b) Refrigerator test laboratory. (c) Air-conditioner test laboratory.
Fig. 19. Measurement systems and user interface. (a) Measurement equipment. (b) Interface of the client-based test software. (c) Interface of the web-based test software.
refrigerators, air-conditioners, washing machines, and electrical water heaters. The software development is accomplished in just several days. For the local test application, the client-based test software is installed in the local laboratory computer. For the web-based test application, the distributed database systems are adopted. Each test laboratory has a database server, and every department in the corporation has a web server. Anyone can visit the testing information over the Internet by any web browser if he owns the special authority. Fig. 18(a) shows the detailed topology, and the whole appearance of two test
laboratories can be seen in Fig. 18(b) and (c). In particular, for the refrigerator testing, the data acquisition instruments are exhibited in Fig. 19(a). Furthermore, the trend display screens of the client-based and web-based test software are shown in Fig. 19(b) and (c). In addition, with the help of the platform, a web-based system for ocean monitoring based on wireless sensor networks [29] has also quickly been developed. All of the cases have proved that the development platform is flexible enough and remarkably improves the development efficiency.
Authorized licensed use limited to: University of Minnesota. Downloaded on May 19,2010 at 18:04:51 UTC from IEEE Xplore. Restrictions apply.
GUO et al.: ISDP: INTERACTIVE SOFTWARE DEVELOPMENT PLATFORM FOR HOUSEHOLD APPLIANCE TESTING INDUSTRY
VI. C ONCLUSION Based on previous projects, the common characters of test applications for different types of appliances have been studied. Then, we have presented a reference model for DMS development in the household appliance test field. According to the design principle defined by the model, a software generation platform has been developed, which is customizable and flexible and has a high degree of automation. In the design process of ISDP, modularity has been implemented using components that are reconfigurable and designed to have replacement independence. For easily and quickly developing the test software, friendly graphical configuration dialog boxes have been developed for the designer. They enable the designer to concurrently specify the appropriate parameters for both the client-based software and the web-based test software. Since the platform was put into practice, good results have been obtained in the household appliance testing domain. The development platform is a huge engineering, so some limitations inevitably exist. For example, the number of components and component functions should be increased to build a powerful platform; the interactive dialogs of the customization subsystem should further be improved; the platform is based on the Oracle database and now cannot support other databases. Considering the limitations and growing requirements, we have decided to broaden and update the platform to support efficient development of more complex testing applications in the future. R EFERENCES [1] S. Frattesi, L. Andrenacci, L. Pasqualini, and L. Starna, “A modern approach to the automatic design and testing of household appliances,” in Proc. MED, Ancona, Italy, Jun. 28–30, 2006, pp. 1–5. [2] D. Grimaldi and M. Marinov, “Distributed measurement systems,” Measurement, vol. 30, no. 4, pp. 279–287, Dec. 2001. [3] P. Arpia, A. Baccigalupi, F. Cennamo, and P. Daponte, “A measurement laboratory on geographic network for remote test experiments,” IEEE Trans. Instrum. Meas., vol. 49, no. 5, pp. 992–997, Oct. 2000. [4] A. Ferrero and V. Piuri, “A simulation tool for virtual laboratory experiments in a WWW environment,” IEEE Trans. Instrum. Meas., vol. 48, no. 3, pp. 741–746, Jun. 1999. [5] D. Grimaldi, S. Rapuano, and T. Laopoulos, “State of art of the distributed measurement systems for industrial and educational purposes,” in Proc. IDAACS, Sofia, Bulgaria, Sep. 5–7, 2005, pp. 289–294. [6] G. Y. Tian, “Design and implementation of distributed measurement systems using fieldbus-based intelligent sensors,” IEEE Trans. Instrum. Meas., vol. 50, no. 5, pp. 1197–1202, Oct. 2001. [7] M. Lazzaroni, E. Pezzotta, G. Menduni, D. Bocchiola, and D. Ward, “Remote measurement and monitoring of critical washing process data directly inside the washing machine drum,” in Proc. IMTC, Baltimore, MD, May 1–4, 2000, pp. 478–482. [8] G. Beges, I. Pusnik, J. Bojkovski, and J. Drnovsek, “Testing of heating in a black test corner,” in Proc. IMTC, Baltimore, MD, May 1–4, 2000, pp. 137–142. [9] D. Grimaldi, L. Nigro, and F. Pupo, “Java-based distributed measurement systems,” IEEE Trans. Instrum. Meas., vol. 47, no. 1, pp. 100–103, Feb. 1998. [10] M. Bertocco, F. Ferraris, C. Offelli, and M. Parvis, “A client-server architecture for distributed measurement systems,” IEEE Trans. Instrum. Meas., vol. 47, no. 5, pp. 1143–1148, Oct. 1998. [11] M. Bertocco and M. Parvis, “Platform independent architecture for distributed measurement systems,” in Proc. IMTC, Baltimore, MD, May 1–4, 2000, pp. 648–651. [12] G. Horak, D. Vasic, and V. Bilas, “A framework for low data rate, highly distributed measurement systems,” in Proc. IMTC, Warsaw, Poland, May 1–3, 2007, pp. 1–4. [13] G. M. Song, A. G. Song, and W. Y. Huang, “A new distributed measurement architecture for applications of networked smart sensors,” in Proc. IMTC, Ottawa, ON, Canada, May 17–19, 2005, pp. 2131–2135.
1451
[14] P. Cesak and J. Roztocil, “Development of large software for the ADC testing,” in Proc. IMTC, Warsaw, Poland, May 1–3, 2007, pp. 1–3. [15] G. Betta, D. Capriglione, A. Pietrosanto, and P. Sommella, “A statistical approach for improving the performance of a testing methodology for measurement software,” IEEE Trans. Instrum. Meas., vol. 57, no. 6, pp. 1118–1126, Jun. 2008. [16] M. Catelani, L. Ciani, V. L. Scarano, and A. Bacioccola, “A novel approach to automated testing to increase software reliability,” in Proc. I2MTC, Victoria, BC, Canada, May 12–15, 2008, pp. 1499–1502. [17] M. Bertocco, S. Cappellazzo, A. Carullo, M. Parvis, and A. Vallan, “Virtual environment for fast development of distributed measurement applications,” IEEE Trans. Instrum. Meas., vol. 52, no. 3, pp. 681–685, Jun. 2003. [18] W. Winiecki and M. Karkowski, “A new Java-based software environment for distributed measuring systems design,” IEEE Trans. Instrum. Meas., vol. 51, no. 6, pp. 1340–1346, Dec. 2002. [19] Household Frozen Food Storage Cabinets and Food Freezers—Essential Characteristics and Test Methods, International Standard ISO 5155-1983. [20] Non-Ducted Air-Conditioners and Heat Pumps—Testing and Rating for Performance, International Standard ISO 5151-1994. [21] Household Frost Free Refrigerating Appliances—Refrigerators With or Without Low Temperature Compartment—Characteristics and Test Methods, International Standard ISO 7371-1995. [22] Washing Machine Performance Evaluation, International Standard IEC 60456, 1994. [23] G. P. Lv, Z. W. Guo, S. Xie, and W. L. Pan, “Web-based real-time monitoring system on cold chain of blood,” in Proc. I2MTC, Singapore, May 5–7, 2009, pp. 1294–1299. [24] [Online]. Available: http://osn.ouc.edu.cn/joomal/index.php/oceansense [25] N. Kakanakov, M. Shopov, and G. Spasov, “Distributed automation system based on Java and web services,” in Proc. CompSysTech, Veliko Tarnovo, Bulgaria, Jun. 15–16, 2006, pp. III-A.24-1–III-A.24-6. [26] K. K. Lau and Z. Wang, “Software component models,” IEEE Trans. Softw. Eng., vol. 33, no. 10, pp. 709–724, Oct. 2007. [27] T. Jurcak, “An instrument-independent test software framework allows both hardware and software reuse,” in Proc. IEEE AUTOTESTCON, Anaheim, CA, Sep. 22–25, 1997, pp. 177–180. [28] P. P. Chen, Z. W. Guo, and P. Zhou, “An advanced platform to develop test software for household appliances based on hybrid architecture,” in Proc. I2MTC, Singapore, May 5–7, 2009, pp. 743–748. [29] Z. W. Guo, Y. Guo, F. Hong, X. H. Yang, Y. He, Y. Feng, and Y. H. Liu, “Perpendicular intersection: Locating wireless sensors with mobile beacon,” in Proc. IEEE RTSS, Barcelona, Spain, Nov. 30– Dec. 3, 2008, pp. 93–102.
Zhongwen Guo (M’08) was born in China in 1965. He received the B.S. degree in computer science and technology from Tongji University, Shanghai, China, in 1987 and the M.S. and Ph.D. degrees from Ocean University of China, Qingdao, China. He is currently a Professor and Doctoral Advisor with the Department of Computer Science and Technology, Ocean University of China. His main research interests focus on sensor networks, distributed measurement systems, ocean monitoring, and so on.
Pengpeng Chen was born in China in 1983. He received the B.S. degree in computer science and technology from Yantai Normal College in 2005. He is currently working toward the Ph.D. degree with the Department of Computer Science and Technology, Ocean University of China, Qingdao, China, where he is researching distributed measurement systems.
Authorized licensed use limited to: University of Minnesota. Downloaded on May 19,2010 at 18:04:51 UTC from IEEE Xplore. Restrictions apply.
1452
IEEE TRANSACTIONS ON INSTRUMENTATION AND MEASUREMENT, VOL. 59, NO. 5, MAY 2010
Yuan Feng (M’08) received the B.S. degree in computer science and technology from Ocean University of China, Qingdao, China. He is currently with the Department of Computer Science and Technology, Ocean University of China. His research interests include sensor networks, distributed computing systems.
Feng Hong (M’08) received the B.S. degree in computer science from Ocean University of China, Qingdao, China, and the Ph.D. degree in computer science and engineering from Shanghai Jiaotong University, Shanghai, China. He is currently an Assistant Professor with the Department of Computer Science and Technology, Ocean University of China. His research interests include distributed computing systems, peer-to-peer computing, and sensor networks.
Yongguo Jiang was born in China in 1974. He received the M.S. degree in computer application technology in 2002 from Ocean University of China, Qingdao, China, where he is currently working toward the Ph.D. degree. He is currently a Lecturer with the Department of Computer Science and Technology, Ocean University of China. His main research interests focus on semantic sensor web and ocean information processing.
Authorized licensed use limited to: University of Minnesota. Downloaded on May 19,2010 at 18:04:51 UTC from IEEE Xplore. Restrictions apply.