In the context of web-based application development, a platform is .... 1â[We] strive to get the best possible teams for each platform to make it more likely that ...
Plat_Forms 2007: The Web Development Platform Comparison — Evaluation and Results Lutz Prechelt
[email protected] Institut für Informatik, Freie Universität Berlin Berlin, Germany http://www.inf.fu-berlin.de/inst/agse June 2007, Technical Report B-07-10
Abstract “Plat_Forms” is a competition in which top-class teams of three professional programmers competed to implement the same requirements for a web-based system within 30 hours, each team using a different technology platform (Java EE, PHP, or Perl). Plat_Forms intends to provide new insights into the real (rather than purported) pros, cons, and emergent properties of each platform. This report describes the evaluation of the solutions delivered by the participants and of the development process and presents the evaluation methodology as well as the results in great detail. It analyzes many aspects of each solution, both external (usability, functionality, reliability, robustness, etc.) and internal (size, structure, flexibility, modifiability, etc.). The many results we obtained cover a wide spectrum: First, there are results that many people would have called “obvious” or “well known”, say, that Perl solutions tend to be more compact than Java solutions. Second, there are results that contradict conventional wisdom, say, that our PHP solutions appear in some (but not all) respects to be actually at least as secure as the others. Finally, one result makes a statement we have not seen discussed previously: The amount of variation between the teams tends to be smaller for PHP than for the other platforms in a whole variety of different respects. See Section 1.8 for the best ways to get an overview of this long document.
Organizers:
Sponsors:
You may use this work under the terms of the Creative Commons Attribution Non-Commercial No Derivatives (by-nc-nd) license, see creativecommons.org/licenses/by-nc-nd/3.0/ for details.
2
Freie Universität Berlin, Institut für Informatik
Contents
Part I: Introduction
6
1
6
Introduction
1.1 1.2 1.3 1.4 1.5 1.6 1.7 1.8 2
. . . . . . . .
. . . . . . . .
. . . . . . . .
. . . . . . . .
. . . . . . . .
. . . . . . . .
. . . . . . . .
. . . . . . . .
. . . . . . . .
. . . . . . . .
. . . . . . . .
. . . . . . . .
. . . . . . . .
. . . . . . . .
. . . . . . . .
. . . . . . . .
. . . . . . . .
. . . . . . . .
. . . . . . . .
. . . . . . . .
. . . . . . . .
. . . . . . . .
. . . . . . . .
. . . . . . . .
Modes of evaluation: objective, subjective . . . . . . Modes of investigation: scenarios, checklists . . . . . Modes of result reporting: tabular, graphical, textual . Evaluation tools and artifacts . . . . . . . . . . . . .
. . . .
. . . .
. . . .
. . . .
. . . .
. . . .
. . . .
. . . .
. . . .
. . . .
. . . .
. . . .
. . . .
. . . .
. . . .
. . . .
. . . .
. . . .
. . . .
. . . .
. . . .
. . . .
Plat_Forms evaluation overview
2.1 2.2 2.3 2.4 3
On deciding between web development platforms Plat_Forms overview and goal . . . . . . . . . . Why a good platform comparison is difficult . . . How we found the teams . . . . . . . . . . . . . The task solved by the participants: PbT . . . . . Plat_Forms as an experimental design . . . . . . Related work . . . . . . . . . . . . . . . . . . . How to read this document . . . . . . . . . . . .
6 6 7 7 9 9 10 11 13
Participants, teams, and platforms
13 13 14 14 16
Part II: Results
18
4
19
Completeness of solutions
4.1
4.2
5
Data gathering approach . . . . . . . . . . . . . . 4.1.1 User interface requirements 1-108 . . . . . 4.1.2 Webservice interface requirements 109-127 Results . . . . . . . . . . . . . . . . . . . . . . . . 4.2.1 User interface requirements 1-108 . . . . . 4.2.2 Webservice interface requirements 109-127
. . . . . .
. . . . . .
. . . . . .
. . . . . .
. . . . . .
. . . . . .
. . . . . .
. . . . . .
. . . . . .
. . . . . .
. . . . . .
. . . . . .
. . . . . .
. . . . . .
. . . . . .
. . . . . .
. . . . . .
. . . . . .
. . . . . .
. . . . . .
. . . . . .
. . . . . .
. . . . . .
. . . . . . . . . .
. . . . . . . . . .
. . . . . . . . . .
. . . . . . . . . .
. . . . . . . . . .
. . . . . . . . . .
. . . . . . . . . .
. . . . . . . . . .
. . . . . . . . . .
. . . . . . . . . .
. . . . . . . . . .
. . . . . . . . . .
. . . . . . . . . .
. . . . . . . . . .
. . . . . . . . . .
. . . . . . . . . .
. . . . . . . . . .
. . . . . . . . . .
. . . . . . . . . .
. . . . . . . . . .
. . . . . . . . . .
. . . . . . . . . .
. . . . . . . . . .
Development process
5.1
5.2
Data gathering method . . . . . . . . . . . . . . . 5.1.1 Manual observation . . . . . . . . . . . . . 5.1.2 Questions to the customer . . . . . . . . . 5.1.3 Estimated and actual preview release times 5.1.4 Analysis of the version archives . . . . . . Results . . . . . . . . . . . . . . . . . . . . . . . . 5.2.1 Manual observation . . . . . . . . . . . . . 5.2.2 Questions to the customer . . . . . . . . . 5.2.3 Estimated and actual preview release times 5.2.4 Analysis of the version archives . . . . . .
19 20 20 21 21 23 25
25 26 27 27 27 28 28 32 32 33 3
Contents 6
7
Ease-of-use
39
6.1 6.2
39 39
Robustness, error handling, security
7.1
7.2 8
9
Data gathering method . . . . . . . . . . . . . . . . . . . . . . . . . . . . . . . . . . . . . . Results . . . . . . . . . . . . . . . . . . . . . . . . . . . . . . . . . . . . . . . . . . . . . . .
41
Data gathering method . . . . . . . . . . . . . . . . 7.1.1 Handling of HTML tags / cross-site scripting 7.1.2 Handling of long inputs . . . . . . . . . . . 7.1.3 Handling of international characters . . . . . 7.1.4 Handling of invalid email addresses . . . . . 7.1.5 Handling of invalid requests / SQL injection . 7.1.6 Cookies and session stealing . . . . . . . . . Results . . . . . . . . . . . . . . . . . . . . . . . . .
. . . . . . . .
. . . . . . . .
. . . . . . . .
. . . . . . . .
. . . . . . . .
. . . . . . . .
. . . . . . . .
. . . . . . . .
. . . . . . . .
. . . . . . . .
. . . . . . . .
. . . . . . . .
. . . . . . . .
. . . . . . . .
. . . . . . . .
. . . . . . . .
. . . . . . . .
. . . . . . . .
. . . . . . . .
. . . . . . . .
. . . . . . . .
. . . . . . . .
Correctness/Reliability
46
8.1 8.2
46 46
Data gathering approach . . . . . . . . . . . . . . . . . . . . . . . . . . . . . . . . . . . . . Results . . . . . . . . . . . . . . . . . . . . . . . . . . . . . . . . . . . . . . . . . . . . . . .
Performance/Scalability
48
10 Product size
49
10.1 Data gathering method . . . . . . . . . . . . . . . . . . . . . . . . . . . . . . . . . . . . . . 10.2 Results . . . . . . . . . . . . . . . . . . . . . . . . . . . . . . . . . . . . . . . . . . . . . . . 11 Structure
12 Modularity
13 Maintainability
Part III: Conclusion
60 61 63
. . . . . .
. . . . . .
. . . . . .
. . . . . .
. . . . . .
. . . . . .
. . . . . .
. . . . . .
. . . . . .
. . . . . .
. . . . . .
. . . . . .
. . . . . .
. . . . . .
. . . . . .
. . . . . .
. . . . . .
. . . . . .
. . . . . .
. . . . . .
. . . . . .
. . . . . .
. . . . . .
. . . . . .
. . . . . .
14 Participants’ platform experience
14.1 Data gathering method . . . . . . . . . . . . . 14.2 Results . . . . . . . . . . . . . . . . . . . . . . 14.2.1 Most difficult aspects of the task . . . . 14.2.2 Competitive advantages of my platform 14.2.3 Disadvantages of my platform . . . . . 14.2.4 Post-hoc effort estimate . . . . . . . .
55 55 60
12.1 Data gathering method . . . . . . . . . . . . . . . . . . . . . . . . . . . . . . . . . . . . . . 12.2 Results (or lack thereof) . . . . . . . . . . . . . . . . . . . . . . . . . . . . . . . . . . . . . .
13.1 Data gathering method . . . . . . . . . . . . . 13.1.1 Understandability . . . . . . . . . . . . 13.1.2 Modifiability . . . . . . . . . . . . . . 13.2 Results . . . . . . . . . . . . . . . . . . . . . . 13.2.1 Modifiability scenario 1 (middle initial) 13.2.2 Modifiability scenario 2 (add TTT item)
49 50 55
11.1 Data gathering method . . . . . . . . . . . . . . . . . . . . . . . . . . . . . . . . . . . . . . 11.2 Results . . . . . . . . . . . . . . . . . . . . . . . . . . . . . . . . . . . . . . . . . . . . . . .
4
41 41 42 42 43 43 43 44
63 63 63 64 64 65 67
. . . . . .
. . . . . .
. . . . . .
. . . . . .
. . . . . .
. . . . . .
. . . . . .
. . . . . .
. . . . . .
. . . . . .
. . . . . .
. . . . . .
. . . . . .
. . . . . .
. . . . . .
. . . . . .
. . . . . .
. . . . . .
. . . . . .
. . . . . .
. . . . . .
. . . . . .
. . . . . .
. . . . . .
. . . . . .
67 67 67 68 69 70
70 Freie Universität Berlin, Institut für Informatik
Contents 15 Validity considerations
72
15.1 Threats to credibility . . . . . . . . . . . . . . . . . . . . . . . . . . . . . . . . . . . . . . . 15.2 Threats to relevance . . . . . . . . . . . . . . . . . . . . . . . . . . . . . . . . . . . . . . . . 16 Summary of results
16.1 Differences between platforms . . . 16.1.1 Java-centric differences . . . 16.1.2 Perl-centric differences . . . 16.1.3 PHP-centric differences . . 16.2 Winning team within each platform 16.2.1 Java . . . . . . . . . . . . . 16.2.2 Perl . . . . . . . . . . . . . 16.2.3 PHP . . . . . . . . . . . . . 16.3 What about the non-winners? . . . .
72 73 75
. . . . . . . . .
. . . . . . . . .
. . . . . . . . .
. . . . . . . . .
. . . . . . . . .
. . . . . . . . .
. . . . . . . . .
. . . . . . . . .
. . . . . . . . .
. . . . . . . . .
. . . . . . . . .
. . . . . . . . .
. . . . . . . . .
. . . . . . . . .
. . . . . . . . .
. . . . . . . . .
. . . . . . . . .
. . . . . . . . .
. . . . . . . . .
. . . . . . . . .
. . . . . . . . .
. . . . . . . . .
. . . . . . . . .
. . . . . . . . .
. . . . . . . . .
. . . . . . . . .
. . . . . . . . .
. . . . . . . . .
. . . . . . . . .
. . . . . . . . .
. . . . . . . . .
17 Conclusion
75 75 75 76 76 76 77 77 77 79
17.1 So what?: Lessons learned . . . . . . . . . . . . . . . . . . . . . . . . . . . . . . . . . . . . 17.2 Methodological lessons learned . . . . . . . . . . . . . . . . . . . . . . . . . . . . . . . . . . 17.3 Further work . . . . . . . . . . . . . . . . . . . . . . . . . . . . . . . . . . . . . . . . . . .
79 79 81
Appendix
82
A Participant questionnaire
83
B Answers to postmortem questions 7, 8, 9
86
B.1 Q7: Most difficult aspects of the task B.1.1 Java . . . . . . . . . . . . . B.1.2 Perl . . . . . . . . . . . . . B.1.3 PHP . . . . . . . . . . . . . B.2 Q8: Platform advantages . . . . . . B.2.1 Java . . . . . . . . . . . . . B.2.2 Perl . . . . . . . . . . . . . B.2.3 PHP . . . . . . . . . . . . . B.3 Q9: Platform disadvantages . . . . . B.3.1 Java . . . . . . . . . . . . . B.3.2 Perl . . . . . . . . . . . . . B.3.3 PHP . . . . . . . . . . . . .
. . . . . . . . . . . .
. . . . . . . . . . . .
. . . . . . . . . . . .
. . . . . . . . . . . .
. . . . . . . . . . . .
. . . . . . . . . . . .
. . . . . . . . . . . .
. . . . . . . . . . . .
. . . . . . . . . . . .
. . . . . . . . . . . .
. . . . . . . . . . . .
. . . . . . . . . . . .
. . . . . . . . . . . .
. . . . . . . . . . . .
. . . . . . . . . . . .
. . . . . . . . . . . .
. . . . . . . . . . . .
. . . . . . . . . . . .
. . . . . . . . . . . .
. . . . . . . . . . . .
. . . . . . . . . . . .
. . . . . . . . . . . .
. . . . . . . . . . . .
. . . . . . . . . . . .
. . . . . . . . . . . .
. . . . . . . . . . . .
. . . . . . . . . . . .
. . . . . . . . . . . .
. . . . . . . . . . . .
. . . . . . . . . . . .
. . . . . . . . . . . .
C Screenshots
C.1 C.2 C.3 C.4 C.5
Registration dialog . . . . . . . . . . . . Trivial Temperament Test (TTT) . . . . . Search for members . . . . . . . . . . . . Memberlist and member overview graphic Member status page . . . . . . . . . . . .
Bibliography
Technical Report B-07-10, www.plat-forms.org
86 86 87 88 88 88 89 90 91 91 92 92 94
. . . . .
. . . . .
. . . . .
. . . . .
. . . . .
. . . . .
. . . . .
. . . . .
. . . . .
. . . . .
. . . . .
. . . . .
. . . . .
. . . . .
. . . . .
. . . . .
. . . . .
. . . . .
. . . . .
. . . . .
. . . . .
. . . . .
. . . . .
. . . . .
. . . . .
. . . . .
. . . . .
. . . . .
94 102 106 109 113 117
5
1 Introduction
1.1 On deciding between web development platforms Huge numbers of projects of all sizes for building web-based applications of all sorts are started each year. However, when faced with selecting the technology (hereafter called platform) to use, more than one of them may appear sensible for a given project. In the context of web-based application development, a platform is a programming language plus the set of technological pieces used in conjunction with that language, such as frameworks, libraries, tools, and auxiliary languages. Web development platforms share a number of auxiliary languages, in particular (X)HTML, CSS, and Javascript. The platforms considered in this study are Java, Perl, and PHP; see Section 1.4 for the fate of any other platform you might have expected to find here. Each such platform is backed up by a community of followers (some of them zealots) who claim ‘their’ platform to be the best. These people make a variety of statements about their own or other platforms, some serious, others exaggerated, some backed up by actual experience, others just based on wild guessing or plain ignorance. Any attempt to comprehensively list such statements would be futile — and fairly useless, as the opposite of almost any statement would also be in the list. Among the themes that appear to be debated most frequently, however, are for instance expectations like the following (with respect to Java vs. Perl vs. PHP): • • • • • •
Java-based systems run faster Perl-based systems have shorter source code Perl code is harder to read PHP code is less modular Java development is less productive Java solutions are easier to maintain in the long term
If any evidence is presented at all for such claims, it tends either to be vague, to compare apples to oranges (say, entirely different projects), or to be on a small (rather than project-level) scale, such as tiny benchmark programs. When attempting to go beyond this kind of evidence, one finds that little, if any, objective information is available that allows for direct comparison of the effective, project-level characteristics that each platform will exhibit when used. This is what Plat_Forms is attempting to change (see also Section 3 of the Plat_Forms contest announcement [18]).
1.2 Plat_Forms overview and goal Plat_Forms is an event in which a number of professional web-development teams meet in one place at one time to create an implementation for the same requirements within a fixed time frame, each team using the platform they prefer and are most highly skilled with. In the 2007 Plat_Forms event, held January 25-26, there were 9 teams representing 3 different platforms (Java, Perl, PHP, with 3 teams each). Each team had 3 members and the allotted time was 30 hours, starting at 9:00 in the morning and ending at 15:00 the next afternoon. 6
1.3 Why a good platform comparison is difficult The goal of Plat_Forms is to find out whether there are any characteristics of either the solutions produced or the development processes used for making them that are consistent across the teams of one platform, but different for the other platforms. Such characteristics could then be called platform characteristics. They may be advantages or disadvantages but could as well be just characteristics. Plat_Form attempts to evaluate each solution with respect to as many characteristics as possible, such as completeness, correctness, scalability, code size, understandability/modifiability, development process used, etc. Plat_Forms was marketed as a contest (see also Section 1 and 2 of the Plat_Forms contest announcement [18]), but it is important to understand that, at least from the scientific point of view, Plat_Forms is not primarily a contest. Rather, it aims to produce solid empirical information that allows for a largely unbiased discussion of the relative pros and cons of different platform technologies with respect to realizing modest interactive webbased applications. The contest announcement explained this — just not on the front page (but see Sections 11 and 12 in [18]). The contest format was a design choice in order to make it easier to find participants.
1.3 Why a good platform comparison is difficult There are three basic problems to be solved reasonably well before a critical reader might be willing to accept the results as real, convincing, and relevant: • Task size: A contest task that is too simple or too small may show differences between platforms, but it would be difficult to say whether these differences would still be relevant for more realistic project sizes. This is obviously a big problem — in fact, it presumably is the main reason why nobody has yet performed a similar study: It is difficult to get a large-enough number of sufficiently qualified developers to work on it for a sufficiently long time. • Team skill: If the members of one team are much more skilled and competent than the members of a different team, we obviously will compare the teams more than their platforms. This danger is even more problematic than task size. It is well-known that the individual performance differences between software developers are quite large [14], so a random selection will not ensure comparable skill. Since we can afford only three teams per platform, we should not hope that differences will average out. The solution approach chosen for Plat_Forms was to ask for the participation of very highly qualified teams only, in the expectation that those would be of comparable competence. • Task bias: One can imagine aspects or requirements in a task that are not common in everyday web development but that will obviously favor one platform over another (because only the former happens to have good support for that kind of requirement). If such aspects have substantial weight relative to the overall task size, a critical reader would consider such a task biased towards one or against some other platform, would hence not consider the comparison fair, and therefore might reject the results. As for task size, the 3-person, 30-hour format of the Plat_Forms contest leads to a size of about two personweeks. This refers to design, implementation, and some testing only; requirements engineering, integration, installation, data migration, acceptance testing, documentation, and a number of other aspects of a real project were not required. So the task size is probably comparable to a normal project of about one person-month, which is by no means large, but sure can be taken seriously. Team skill and task bias will be discussed later on in this document. In short, we were quite successful in this respect, but also encountered some problems.
1.4 How we found the teams A call for participation in Plat_Forms was first publicly announced on the heise.de newsticker [1] and as an article in iX magazine [21] in October 2006. Of those computer-related magazines that reach a predominantly Technical Report B-07-10, www.plat-forms.org
7
1 Introduction professional (rather than consumer) audience, iX is by far the largest in the German language area with a circulation of 50,000. The free Heise newsticker reaches a broader audience still, but the effective reach is difficult to estimate reliably. From these two starting points, knowledge about Plat_Forms spread in three ways: (1) The organizers contacted people they knew personally who might send a team. In particular, (2) we attempted to find a platform representative for each platform, a person who would make Plat_Forms known in the respective community and invite teams to apply for participation. Finally, (3) the news also spread by “word-of-mouth” (actually postings in various forums and blogs). The original call for participation listed as possible platforms Java EE, .NET, PHP, Python, and Ruby-onRails. This produced two queries why Smalltalk was not mentioned and an outcry from the Perl community (8 carefully worded notes of protest reached me within just 4 hours). We promptly added Perl to the list of platforms mentioned in the announcement and made it clear that the list was to be considered open-ended and any platform with a sufficient number of qualified teams that would apply could participate. The skill requirements for the teams implied by the announcement were rather high1 , so we expected that it might be difficult to find three teams per platform at all. But we also felt it would be very difficult to select the best teams from a large number of requests for admittance (our form for that purpose was only three pages long), so we were also reluctant to just make a lot of noise and raise high interest in an uncontrolled manner. Therefore, to get broader access to qualified teams, the organizers (in particular Richard Seibt and myself) attempted to obtain buy-in from highly visible platform representatives. Specifically, we contacted Sun and IBM for Java, Microsoft for .NET, Zope and Guido van Rossum for Python, 37signals for Ruby-on-Rails, and ZEND for PHP. Unfortunately, except for ZEND, all of them were either uninterested or rather hesitant and eventually did not send members onto the contest committee. In contrast, the organizer of the German Perl Workshop, Alvar Freude, volunteered for the Perl platform and Accenture nominated Matthias Berhorst for Java. ZEND sent Jürgen Langner for PHP. And this is how it went from then on: • Finding and selecting the Perl and PHP teams was done by-and-large by the Perl and PHP platform representative, respectively. We cannot say much about the details of this process, but the results speak for themselves: Team recruitment worked well there. • We had some contact with potential teams from the Python arena, but there were not sufficiently many who were qualified enough. In the end, only one formal request for participation was submitted, so we did not admit Python into the contest. • It was impossible to find Ruby-on-Rails teams (“we are too busy”). • As for .NET, the respective development community seems to have hardly noticed the contest announcement at all and apparently Microsoft did not tell them either (although we had close contact with highly suitable people there). • Java turned out to be a problem, too. Besides a team from the platform representative, Accenture, there was another from abaXX, but several candidates for the third slot did not commit to coming. When we ran out of time, Richard Seibt asked a company he knew, Innoopract, who develops RAP, a framework for displaying Eclipse applications executing on a server in the web browser2 . They were unsure both whether RAP, being still in alpha development, was mature enough and also whether it would fit well to the contest task, but then, although reluctantly, they agreed to send a team. In the end, after having talked to several dozen potential applicants, 10 teams sent a formal request for admittance to the contest. See Section 3 on page 16 for more information about the participants. 1 “[We]
strive to get the best possible teams for each platform to make it more likely that significant differences observed in the final systems can be attributed to the technology rather than the people.” 2 www.eclipse.org/rap/
8
Freie Universität Berlin, Institut für Informatik
1.5 The task solved by the participants: PbT
1.5 The task solved by the participants: PbT The teams were asked to build a system called People by Temperament (PbT). They received a 20-page requirements document [19] containing five sections as follows 1. Introduction. Described the purpose of PbT (“PbT (People by Temperament) is a simple community portal where members can find others with whom they might like to get in contact: people register to become members, take a personality test, and then search for others based on criteria such as personality types, likes/dislikes, etc. Members can then get in contact with one another if both choose to do so. The system has both an interactive user interface via HTML pages and a WSDL/SOAP-based programmatic interface”) and the requirements notation used (151 fine-grain requirements, each marked as either MUST/essential, SHOULD/mandatory, or MAY/optional and numbered conscutively) 2. 108 functional requirements on the GUI level, presented in usecase format [3]. There are six usecases: a) An Overview usecase, integrating the other five. b) User registration, with a number of less-than-common attributes, in particular GPS coordinates. c) Trivial Temperament Test (TTT), a survey of 40 binary questions (provided in an external structured text file) leading to a 4-dimensional classification of personality type. d) Search for users, based on 17 different search criteria (all combinable), some of them complicated, such as selecting a subset of the 16 possible personality types or classifying distance (in a prescribed simplified way) based on GPS coordinates. e) User list, used for representing search results, users ‘in contact’ with myself, etc. This usecase also called for generating a graphical summary of the list as a 2-d cartesian coordinate plot visualizing the users as symbols based on selectable criteria. f) User status page, displaying details about a user (with some attributes visible only in certain cases) and implementing a protocol by which users can reveal their email address to each other (’get in contact’) by sending and answering ‘requests for contact details’ (RCDs). 3. 19 functional requirements for a SOAP-based Webservice interface, described by a WSDL file (provided separately) and explanations. 4. 19 non-functional requirements regarding for instance some user interface characteristics, scalability, persistence, and programming style. 5. 5 requirements regarding rules of conduct for the contest, in particular describing packaging and delivery of the solutions. Please refer to Appendix C to see screenshots of implementations of these requirements.
1.6 Plat_Forms as an experimental design From a scientific viewpoint, Plat_Forms is an attempt to perform a controlled experiment: Vary one factor (the “independent variable”, here: the platform), keep everything else constant (“control all other variables”), and see how the various resulting project characteristics (“dependent variables”, such as size, quality, efficiency, etc.) change. This approach to observation is a fundament of the scientific method [13]. However, whenever human beings play a major role in an experiment, keeping “everything else constant” becomes difficult, as humans bring in a host of different influences many of which one cannot measure let alone control. The standard trick for achieving control nevertheless [2, 17] is to use many humans rather than Technical Report B-07-10, www.plat-forms.org
9
1 Introduction just one (so that the differences between persons balance out statistically) and to assign them to the experiment conditions randomly (“randomization”, in order to avoid self-selection effects, say, if all the brightest and most capable people favored platform X). In our case, however, randomization makes no sense whatsoever, because a platform X team would not in reality work with platform Y just because anybody says so at random, and therefore we have little interest in learning about what happens when they do. Without randomization, however, there is no control over all the many possible kinds of differences between people and teams and our experiment has therefore incomplete control. More technically speaking, Plat_Forms is a quasi-experiment [2] with one categorial independent variable (the platform) with three levels (Java, Perl, PHP), a large number of dependent variables (see the rest of this report) and incomplete control over all human-related variables. Partial control of the human-related variables is achieved by the following means: • by working with teams rather than individuals (which, among other effects, results in some averaging of capabilities), • by having 3 teams per platform rather than just one (which results in overall averaging), and • by what could be called “appropriate self-selection”: The characteristics of the people who choose to work with platform X (and thus self-select group X in our experiment) can be considered part of the characteristics of the platform itself, so at least from the point of view of somebody who would hire a team of programmers it would make no sense at all to assign teams to platforms randomly, even if it were feasible. However, Plat_Forms is a highly fragile research design: With only three data points per platform, even a modest amount of within-platform variation will quickly make it impossible to reliably detect existing platform differences. Unfortunately, such variation is highly likely. For instance for individuals doing programming tasks, it is known from [14] that the ratio of the median work times of the slower and faster halfs of a group of software developers is typically in the range 2 to 5! This may average out somewhat when we look at teams of three, but still a difference of factor 2 between the best and worst team within the same platform would be perfectly normal. Our only hope is to have a very homogeneous set of teams in the contest. This is why we were so interested in finding top-class teams: Their performance is most likely to be very similar — and also to be very high, which is important because the PbT task is quite large for the given time frame.
1.7 Related work Many informal comparisons of web development platforms or frameworks exist, most of them are not based on actually trying out the frameworks, but rather compare features and programming styles theoretically. Such comparisons can sometimes be helpful when making platform decisions, but can of course not resolve the quasi-religious platforms dispute at all. There are also a number of comparisons that involve actual programming, but they usually differ sharply from Plat_Forms with respect to one or more of the following important aspects: • Many of them involve much less controlled conditions for the production of the solutions. Authors can put in an arbitrary amount of work during the course of several weeks. • Many of them focus on only a single evaluation criterion, often either performance or the appeal of the GUI. • Some are prepared by a single author only, which raises the question whether we can assume that a similar level of platform-specific skills was applied for each contestant. 10
Freie Universität Berlin, Institut für Informatik
1.8 How to read this document Examples for such limited types of study are performance contests like the Heise Database contest [9], which compare little else than performance and typically involve unlimited preparation time, live scenarios like [10], where experts attempt to solve a small task in a few hours, typically at a conference or tradeshow and visitors can look them over the shoulder (but no in-depth evaluation is performed at all), or one-man shows like Sean Kelly’s video comparing specifically the development process for a trivial application for Zope/Plone, Django, TurboGears (all from the Python world), Ruby-on-Rails, J2EE light (using Hibernate), and full-fledged J2EE (with EJB) — which is both impressive and entertaining, but necessarily superficial and visibly biased. [5] is an comparison of two web development frameworks that missed out on Plat_Forms: Ruby-on-Rails and Python’s Django. The same web application was written by two skilled professionals for the respective languages and the resulting code briefly analysed with a perspective on which framework to choose under which conditions. None of these studies have the ambition to provide an evaluation that is scientifically sound, and few of them attempt to review most of the relevant criteria at once. To find a platform comparison of that kind at all, one has to leave the realm of web applications: [16] compared 80 implementations of the same small set of requirements created individually by 74 programmers in 7 different programming languages. It provided a detailed evaluation in a technical report [15] referring to a broad set of criteria, but the application was a fairly small string-processing batch program and it did not have to do with web development.
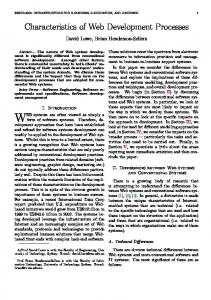
1.8 How to read this document Ideally, you should have two prerequisites: 1. The above description of the goals and format of Plat_Forms was somewhat short. To understand the background better, you should read (or at least skim) the Plat_Forms contest announcement [18]. 2. A more thorough understanding of the requirements posed to the participants is helpful for interpreting the results. Read (at least partially) the original requirements document handed to the participants [19]. You can find both of these documents, plus lots of other information, on www.plat-forms.org. Given this background, you can in principle delve right into any section of this document that you find interesting without reading the others.3 One method would be simply to look at the graphical plots and to draw your own conclusions. The caption of each plot describes how to read it; a general instruction for boxplots is given in Figure 2.1 on page 14. A little better would be to also read the text of the subsection (typically x.2) in which you find the plot, which will interpret the data, draw conclusions, and also review several plots (and possibly other analyses) together. Each such subsection will have a paragraph at the end starting with “Summing up, “, which provides the essence of the results. In a few cases of particularly diverse subsections another few such paragraphs exist earlier in the subsection. You may also want to consult the first subsection of the respective section, which describes how the data shown in the plots was derived. (In some cases, you will hardly be able to understand the plots without this information.) For a more general understanding you may want to first read the general description of the evaluation approach in Section 2 and the discussion of the study’s limitations in Section 15. Besides all these methods there is of course the obvious shortcut of just reading the summary at the end of the report (Section 16). 3 It
will either be obvious where information from previous sections is relevant (and the section will be easy to find in the table of contents) or explicit cross-references will be provided.
Technical Report B-07-10, www.plat-forms.org
11
1 Introduction Note that the document makes much use of color, therefore a gray-scale printout will be much less useful. It also provides plenty of within-document hyperlinks to remote figures and sections and to the bibliography; I therefore recommend reading it on the screen. Where platform differences are diagnosed, the concerned platform names will be highlighted with a reddish background like this and findings that favor one team over the others of the same platform (and may be grounds on which to decleare that team the winner for that platform) will highlight the team name with a greenish background like this .
12
Freie Universität Berlin, Institut für Informatik
2 Plat_Forms evaluation overview The task specification left the Plat_Forms contest participants a lot of freedom in implementing the required functionality. Furthermore, the teams use a rather diverse set of platform technologies, building blocks, and development approaches. Therefore, a reproducible and (where possible) objective evaluation of their solutions is a difficult challenge. The evaluation uses the following recurring mechanisms: Two different modes of observation (objective, subjective), two different modes of investigation (scenarios, checklists), and three different modes of result reporting (tabular, graphical, textual). They will be shortly described and discussed in the following subsections. The concepts are fairly abstract here, but both their meaning and their relevance will become clear when we discuss the individual quality criteria in subsequent sections. If you are not interested in the details of empirical evaluation methodology, you may want to skip or skim these subsections — but make sure to have a look at Figure 2.1. Section 2.4 summarizes the infrastructure (in terms of tools and data sets) we have used and/or created during the evaluation.
2.1 Modes of evaluation: objective, subjective Some criteria can be evaluated in an entirely objective manner. For instance the response time of a solution relative to a given request can be measured with high precision and reliability, and averaging can be used to smooth out the variability induced by the complex infrastructure underneath. Objective observations also tend to be highly reproducible. In contrast, other criteria are too complex to judge them in a mechanical fashion or even too complex to reduce them to a numerical summary. For example, we do not have sufficient resources for judging ease-of-use experimentally by trials with large numbers of subjects, and fully objective criteria for this purpose do not exist. Such criteria need to be judged subjectively by human beings with appropriate expert knowledge. Subjective observations tend to be less reproducible and hence also less credible. In order to increase the credibility of the subjective observations, we will usually perform them two or even three times with different observers and either report their results side-by-side or have them resolve their differences by discussion and report on both the source and amount of initial disagreement and the resulting opinion.
2.2 Modes of investigation: scenarios, checklists For many aspects, the investigation can be highly prestructured in the form of a long list of small, wellseparated, individual things to evaluate. In those cases, we will prepare (and publish in this report) a detailed list of these things and investigate each of them independently of the others. We call this mode of investigation the checklist mode; it includes direct measurement of well-defined attributes (such as length of source code in lines-of-code) and data gathering by structured questionnaires. For some aspects, however, this approach is not applicable because one cannot foresee which will be the relevant details to look at. In these cases, the investigation is prestructured by describing a more qualitative scenario of what to look at and how and which criteria to apply. We call this mode of investigation the scenario mode and it includes data gathering by open-ended questionnaires. 13
2 Plat_Forms evaluation overview
2.3 Modes of result reporting: tabular, graphical, textual Evaluation results will be reported in a structured, tabular format wherever possible. This will typically apply to all checklist-based investigations, even the subjective ones. Tabular results can be raw results in full detail or summaries containing some aggregation of the raw results. However, quantitative results will usually not actually be shown as a table. Rather, our whole analysis is performed in the spirit of exploratory data analysis [7] and we therefore always prefer presentation in graphical format as a statistical plot, as this makes it much easier to gain a complete overview, make sense of the data, and see trends. The most common type of plot will be bar charts and an extended version of the so-called box-and-whiskers plot (or boxplot for short) as shown in the example in Figure 2.1.
M
●● ● ● ●● ● ● ●● ●
1
●
● ●● ●● ● ●● ● ● ●●●●● ●●●●●●● ● ●●● ●● ● ●
2
● N=50
3
x Figure 2.1: Example boxplot. Boxplots are useful for understanding the distribution of a set of data points, in particular when two or more of such sets are to be compared. Explanation: (1) The small red circles are the individual data values, vertically scattered to avoid complete overlaps. For coarse-grained data such as small integers, we may also explicitly jitter the data horizontally as well to make overlaps less likely; this case may be indicated by the term jitter() in the axis label. If there are many data values, they are sometimes left out of the plot. (2) The yellow box designates the range of the middle half of the data, from the 25-percentile to the 75-percentile. (3) The blue ‘whiskers’ to the left and right mark the lowest and highest 10 percent of the data points (10-percentile and 90-percentile). In some cases, in particular when there are very few data points, they will be suppressed; this will be announced in the caption. In some other cases, they may extend to the minimum (0-percentile) and maximum (100-percentile) of the data; this will be announced in the caption as well. (4) The fat dot is the median (50-percentile). (5) The M marks the arithmetic mean and the dotted line around it indicates plus/minus one standard error of the mean. (6) As a rough rule-of-thumb, if two such standard error lines do not overlap, the difference in the two means is statistically significant. Note: The data shown in the example plot is randomly generated as 50 sample values of a random variable that has the sum of a uniform distribution in the range (0, 2) plus the absolute value of a standard normal distribution (U0,2 + |N0,1 |).
We will often provide plots that are fully equivalent to a tabular representation, i.e. that report the full amount of information without loss. Such plots are sometimes a little more difficult to read than simpler ones, but make representation artifacts and misleading interpretations less likely. For differences that appear relevant in these plots, we will also sometimes report results from statistical significance tests and/or confidence intervals for the size of the difference. For scenario-based investigations and also for those parts of subjective evaluations that require elaboration, we will use (exclusively or complementarily) a more free-form, textual description of our findings. The need for such textual characterizations of the results is one of the reasons why we will not prepare an overall ranking of the solutions.
2.4 Evaluation tools and artifacts To gather the data analyzed during the evaluation, we wrote a number of data extraction scripts (extraction from CVS and SVN, postprocessing profiling information, language-specific lines-of-code counting) and ran various existing tools in order to produce 12 data files (version and profiling data with about 48 000 records overall) whose content was derived fully automatically and another 9 (file classification and size data with about 2 300 records overall) whose content consisted of 4 automatically derived and 3 manually determined attributes. Another 55 data files on various topics (with about 6 000 records overall) were created manually. The derivation of all these data files will described in the first subsection the results section that uses these data. 14
Freie Universität Berlin, Institut für Informatik
2.4 Evaluation tools and artifacts To perform the actual evaluation of these data, we used the R environment [20] in version 2.4.1 plus a number of non-standard extension packages, in particular irr [4] to compute coefficients of interrater agreement and ggplot [22] to create one of the graphs. Unless otherwise noted, significance tests, p-values, and confidence intervals are based on a Student’s t-test with Welch correction for unequal variances as computed by R’s t.test procedure [20]. Depending on context, we will apply different criteria for what to consider statistically significant. In some cases, we apply the common limit of 0.05 for the p-value, in others we will be more critical and demand for instance 0.01, because we often have a large number of potential differences (many pairs of samples that can be compared) and few (if any) specific hypotheses where we would expect to find differences and where not. We therefore need to make reasonably sure we are not “fishing for significance” [8]. Unless otherwise noted, the confidence intervals cover 80% probability.
Technical Report B-07-10, www.plat-forms.org
15
3 Participants, teams, and platforms
We assigned numbers to the teams in the order in which we received their request for admittance to the contest and internally talk of team1, team2 etc. If one is mainly interested in the platforms of the teams, this numbering is quite confusing, so we will attach the platform name to the team number most of the time and talk of team1 Perl, team3 Java etc. These are the home organizations of our teams and the main pieces of technology that they used: • Team1 Perl: Etat de Genève/Optaros (www.ge.ch, www.optaros.com, but this team is not as mixed as it looks: The members work together every day for Etat de Genève.) DBIx::DataModel, Catalyst, Template Toolkit • Team2 Perl: plusW (www.plusw.de) Mason, DBI • Team3 Java: abaXX Technology (www.abaxx.com) JBoss, Hibernate, abaXX.components • Team4 Java: Accenture Technology Solutions (www.accenture.de) Tomcat, Spring, Hibernate • Team5 Perl: Revolution Systems (www.revsys.com) Gantry, Bigtop • Team6 PHP: OXID eSales (www.oxid-esales.com) Zend Framework, parts of OXID framework • Team7 PHP: Globalpark (www.globalpark.de) proprietary framework • Team8 PHP: Zend Technologies (www.zend.com) Zend Framework • Team9 Java: Innoopract Informationssysteme (www.innoopract.de) Equinox, Jetty, RAP All teams used variants of the Linux operating system and either MySQL or PostgreSQL. The Perl teams used Apache and mod_perl, the PHP teams used Apache and mod_php. Most teams employed a number of Javascript libraries. After the end of the contest, we asked each participant to fill in the short, semi-structured questionnaire as reproduced here in Appendix A, in which we requested some biographical information as well as an assessment of the task and the team’s solution. This section discusses the biographical data. Since Plat_Forms aims at comparing platforms rather than teams, it is crucial that the teams’ capabilities all be similar, as discussed above in Sections 1.3 and 1.6. So let us make sure the teams are reasonably similar across platforms and let us see how much variance exists within the platforms. Some statistics about the team members derived from the biographical questionnaire data are shown in Figures 3.1 through 3.6. See the captions for the discussion. Figure 3.1 indicates that the team members have similar age across platforms. Figure 3.2 indicates the Java participants have somewhat less experience as professional developers on average than the others. The difference is not dramatic but is something we may need to keep in mind when interpreting the results. 16
M
PHP
● 886 7 7
7 86
M
Perl
1 5● 5 1
2 2
5
1
2 Figure 3.1: Age in years of the team members. The plot symbol indicates the team number. The platforms are fairly homogeneous, except for the strikingly high variance within team2 Perl: the oldest and the two youngest contest participants are all in the same team.
M
● 4 33
Java
20
9 39 9
30
40
50
age
M
PHP
M
Perl Java
● 67 6
7 8
7 2
21 9
5
● 4 3
44
8
6
● 1 5 5
2
M
3
5
9
9
10
15
20
jitter(experience)
M
PHP
87
67
● 88
6 7 6
M
Perl
15
1
● 2
2
2
51
M
4 93 9 34 ●
Java
20
40
60
80
100
jitter(devtimePercentage)
PHP Perl Java
M
● 8 7 78
6
M
● 1 22
2
4
9
M
9 34●3 4
20
40
60
80
jitter(estCapabilityPercentile)
M
8 66 ● 8 7 7 86
PHP
● 2 1 5 1 525
Java
3 0
● 4 49
43 9
5 2● 1 2
Java
3 10
15
8
76
Perl
1
M
5
M
PHP
M
Perl
Figure 3.3: Fraction of worktime spent with technical software development activities during the previous year, in percent. For all platforms, the majority of participants spend more than two thirds of their daily worktime with technical activities. Remarkably, both of the participants with low values are below the average age; both are rather capable programmers (one is the founder of a company).
Figure 3.4: Anwers to the question “Among all professional programmers creating web applications, I consider myself among the most capable 5/10/20/40%/about average/among the least capable 40/20/10/5%.” The data shown here reflects the midpoint of the class formed by each answer category. Except for team2 Perl, which was somewhat more pessimistic about their own capabilities, the platforms are well-balanced.
7
5
1 5
Figure 3.2: Experience as a professional software developer, in years. The mean is similar for PHP (9.8) and Perl (8.7), and somewhat lower for Java (7.1). (As a side note: many people would report the results of a statistical significance test at this point (if you are interested: A two-sided ttest comparing the Java and PHP groups reports p = 0.22, hence no statistically significant difference), but this is not at all relevant: Such a test helps determine whether an observed difference might be due to chance or not, but we are not interested in that. We want to know whether there is a difference in this particular case — and it is.) Perl and to a lesser degree Java exhibit higher variance than PHP, mostly due to team2 Perl and team9 Java.
● 394
4 0
5
● 66 7
87
M
5 1
5 1
M
3 9
9 10
3 15
jitter(languagesUsed) jitter(languagesUsed + languagesTried) Figure 3.5: Number of programming languages each participant has used regularly at some point during his career (left) or has at least once tried out (right). The differences between the platform groups are rather small in both respects.
Technical Report B-07-10, www.plat-forms.org
17
3 Participants, teams, and platforms
PHP
7
M
6
88
M
Perl Java
● 6 8 76
2
2● 1 255 11
5 M
9
3 1
39
● 9
2
3
44 4
jitter(frameworksTried)
4
3 5
6
Figure 3.6: Number of different web development frameworks the participant has previously worked with. The variance is substantial, but differences between platforms are not.
Figure 3.3 indicates that the majority of participants on each team indeed perform technical work most of the time and can rightfully be called professional software developers. Only team1 Perl and team5 Perl each have one participant for whom the fraction of time regularly spent on actual development work is low. Figure 3.4 indicates that with two exceptions all participants consider their own capabilities to be above average and that those estimates are reasonably well balanced across platforms, with the exception of team2 Perl which increases both variance and mean in the Perl group. Note that previous research has found such self-assessment to produce a more useful predictor of performance than any of the biographical indicators that are commonly used for that purpose [16]. Figure 3.5 indicates the the participants had previously learned similar numbers of programming languages — this is another indicator that has formerly proven in some cases to be a comparatively good predictor of performance. The domain-specific equivalent of that is the number of web development frameworks previously learned, shown in Figure 3.6, which also exhibits good similarity across platforms. Summing up these biographical data, we find that the background of the teams appears to be similar from one platform to the other, so comparing the platforms by comparing solutions prepared by these teams appears to be fair. However, Figure 3.4 also suggests that the ambition to have only top-class participants has probably not been achieved. We should therefore expect that some of the differences that may exist between the platforms may not become visible in this evaluation; they will often be hidden by larger differences between the groups within each platform.
18
Freie Universität Berlin, Institut für Informatik
4 Completeness of solutions The most basic quality attribute of a software application is its functionality. In our case this boils down to the question: Which of the functional requirements stated in the requirements specification have been implemented at all? Given the short timeframe and the discrimination into MUST, SHOULD, and MAY requirements, we expect that most solutions will be incomplete to some degree. We would like to answer the following questions in comparison of the individual solutions and the platforms: • Compl-1: How many of the functional requirements have been implemented for the GUI? • Compl-2: Are there differences between the MUST, SHOULD, and MAY requirements? • Compl-3: Are there differences when we take into account that some requirements require more effort than others? • Compl-4: Are there differences for the functional areas (as described by the five different usecases)? • Compl-5: Are there differences for the SOAP webservice requirements? Since the webservice requirements (requirement numbers 109 through 127) have been implemented to a lower degree than the user interface requirements (requirement numbers 1 through 108) by all teams, we will evaluate these two kinds separately. The remaining requirements (nonfunctional requirements 128 through 146 and contest rules 147 through 151) we do not consider aspects of completeness; they will therefore be ignored here.
4.1 Data gathering approach The evaluation of the completeness of the solutions is investigated subjectively, based on a checklist of the individual requirements given in the task. We will present the completeness checking results in two different forms: One merely counting the requirements, the other weighing them by a rough classification of relative effort and presenting the weighted sum. In principle, a weighted sum provides a more adequate measure of completeness, but any actual set of weights is bound to be dubious, because the effort is strongly dependent on the technology used, the architecture and implementation approach chosen, the prior knowledge of the programmers, and other factors that are not fixed across the teams. We have therefore chosen (a) to present weighted and unweighted evaluations side-by-side and (b) to use a rather minimal weighing scheme composed as follows: • Compound requirements count as 0, because all of what they represent is contained in other, finer-grain requirements again and we do not want to count something twice. • Very simple requirements, such as the presence of simple individual form fields (say, a field for the user’s name), count as 1. • Medium requirements that require some non-standard program logic count as either 2 or 3. • Larger requirements (which typically require the interaction of multiple parts) count as 5. Figure 4.1 shows the individual effort weights used for each requirement. We believe that these effort values tend to underestimate the actual effort differences, so that the weighted sums remove much (though not all) of the distortion that a mere counting of completed requirements implies without introducing new distortion that might otherwise result from weighing some requirements in a way that is exaggerated for at least some platforms or frameworks. The average effort is 2.2 for the MUST requirements, 2.5 for SHOULD and 2.6 for MAY. 19
4 Completeness of solutions
effort
5 4 3 2 1 0
55
5
2 2 2 1 1 0
2
222 1111
55
3 3 2 22 2 11 1 1
0
0
20
5555 5 3 3 33 33 33 222 22 222 2 2 2 2 222222 1 0
40
5
5 5
333
33 222222222
5
3 3 22 22
33 3
33 22
3
33 33 333333 2 2
2
1
0
60
333 22
1
5
0
80
0
100
111 111 0
120
requirement number Figure 4.1: Effort weights assigned to the individual requirements for the evaluations that weigh rather than count.
4.1.1 User interface requirements 1-108
Here is the basic approach for measuring the solutions’ completeness with respect to the user interface (or GUI) requirements: Based on a checklist containing each requirement, each of two reviewers will try out a solution and subjectively assign one of the following categorial marks for each requirement: • 0: The solution does not implement this requirement. • 1: The solution implements this requirement only partially (at least 25% of it are missing) or the requirement is implemented but is very severely faulty (it fails in at least 25% of the typical usage cases). • 2: The solution implements this requirement, but in a much less valuable manner than should be expected. • 3: The solution implements this requirement roughly as well as should be expected. As the solutions were built in a mere 30 hours, the expectation is a basic, straightforward implementation. • 4: The solution implements this requirement in a much more valuable manner than should be expected. Each reviewer first reviews the solution alone and collects his marks for each requirement, plus a short justification of each. The reviewers then compare their marks and determine conflicts. For each conflict, the reviewers discuss with each other the reasons why they assigned their marks and correct one (or perhaps both) of them to resolve the conflict. The resulting marks are submitted for statistical evaluation. If no resolution can be found, a third reviewer acts as a referee (but this was never necessary). If the arguments used for arriving at the marks are expected to be relevant for other solutions as well, they are written down and re-used during subsequent conflict resolutions by the same or other reviewers for the same requirement. This procedure was executed by three reviewers (Peter Ertel, Will Hardy, and Florian Thiel), each of them reviewing six of the nine solutions. These six were assigned in a randomized manner and reviewed in a prescribed order chosen such as to minimize sequencing effects, i.e. a solution reviewed early in the sequence by one reviewer would be reviewed late in the sequence by the other, as it is plausible that the subjective criteria applied become more relaxed or more strict over time. Note that in this section we use only the discrimination between 0 marks and the others (1, 2, 3, or 4). We will use the discrimination between marks indicating “working” (2, 3, 4) and the mark indicating “broken” (1) in Section 8 when we compare the correctness of the solutions. We will use the discrimination between marks indicating “good” (4), “as expected” (3), and “bad” (2) solutions in Section 6 when we compare the ease-of-use of the solutions. 4.1.2 Webservice interface requirements 109-127
The approach for measuring the solutions’ completeness with respect to the webservice requirements is simpler. The task specification is more constraining for these requriements than for the GUI requirements, where many details of the design were left open. Therefore, the decision whether a requirement is implemented correctly involves hardly any subjectivity, and we decided that the two-reviewer procedure was not necessary, at least if we would avoid using different reviewers for different solutions. A single reviewer, Ulrich Stärk, thus wrote a webservice client and checked the webservice implementations of all nine solutions. We used roughly the same rating scheme as described above but dropped the discrimination 20
Freie Universität Berlin, Institut für Informatik
4.2 Results between “good” (4), “as expected” (3), and “bad” (2) implementations of a requirement and used mark 2 to designate implementations that were faulty in a trivial way and mark 4 not at all.
4.2 Results 4.2.1 User interface requirements 1-108
Before we actually look at the results, let us check the consistency of the judgments: How reliable (that is, repeatable) are they?
M
Pearson.r
3
1
2
● 9 6 54 8 7 M
agreement
1 0.2
0.4
0.6
● 3 26 7 549 8 0.8
fraction Figure 4.2: Measures of agreement between the two reviewers (one data point per solution reviewed): Pearson correlation coefficient (which is reasonable because our marks are ordered) and straightforward percentage of identical marks. The digit plotted is the team number; the boxplot whiskers are suppressed. For computing these data, we define a nonagreement or conflict as follows: Two marks for the same requirement are considered in conflict if they are different, with two exceptions: one is 2 and the other is 3, or one is 3 and the other is 4. The statistics shown in the graph therefore handle 2s and 4s of one reviewer like 3s if (and only if) they meet a 3 of the other reviewer.
Figure 4.2 quantifies the amount of agreement among the two reviewers of each solution. Considering the fact that many aspects of the various solutions were structured in drastically different ways (because the specification left a lot of room for different design decisions), we see that both measures of agreement have fairly high values; the majority of teams had reviewer agreement of 80% or better and only the solutions of team3 Java and team1 Perl were substantially more problematic. However, the reviewers discussed their conflicting opinions thoroughly (a few discussions even extended over multiple sessions) and we are confident that we now have a judgement of completeness that is highly consistent and fair across the teams. For completeness, Figure 4.3 shows the details behind the data shown in the summary plot 4.2: The individual disagreements between the two reviewers of each solution for each of the GUI requirements. The gaps in the data reflect cases in which one of the reviewers felt unable to decide on a mark and went into the unification process without a fixed judgement. Figure 4.4 shows the amount of functionality relating to the user interface requirements that the teams have delivered. We can make the following observations: 1. Whether we weigh the requirements by effort or just count them does hardly make a difference at all. 2. The performance of the three PHP teams is remarkably similar. The variance among the Perl teams is also fairly small. 3. The performance among the Java teams is wildly different. It is so uneven that it makes hardly any sense to compare them to anything else as a group. 4. Team3 Java produced by far the most complete solution overall; impressively more complete than any of the others. 5. Team9 Java produced by far the least complete solution overall, with only about half as much implemented functionality than the second-least complete solution. The reason is apparently the lack of maturity of the RAP framework that this team used (see the team’s statements about this in Section 14.2.3 and Appendix B). Technical Report B-07-10, www.plat-forms.org
21
4 Completeness of solutions
0 1 0 1 3 2 33 000000 1 00000000 1 2 0000 00 1 2 000000000000000000000000 1 0 1 2 00000000000000000000 1 3 00 0000 000000000 0 0 0 0 3 33 33 333333 00 3 00 333 0 3 0000 3333333333 000000 2 000 3 00000000 0 3 3333333 00000000 333 0 33 0 3333 0 33333333 0 1 0 22 2 1 0 0 0 0 0 0 0 11 1 22 2 22 333 33 0 3 22 3333 3333 0 0 3 1 33 000000 3 000 3 000000000 3 33 2 2 3333 33 0000000 333 00 3 0 333 0 3333333 2 0 0 1 0 0 00 0 11 0 1 1111 2 0 333 3 000000000 3 00 00 33333 00000000000000000 22 3333 1 3333333 0 0 3 0 3 0 3333 33 2 33333 2 3 2 3 000 3 4 3333 3 33 2 1 1 0
team number and disagreement
000
8
6
01
0
0 0
3
0 0 1 0 00 1 1 1 1 0 3 33 33333333 11 33 00 0 0 00 33 33 0 2 3 0 3 1 11 000000 3 000 3 000000000 3 00 0 00 000 00000000000000000 1 3 0 3 000 0000000 3
4
2
0 2 2 222 33 2 0000 0 0 2 2 1 00 3 0 0000000000000000000000000000000000000000000000000000000000000000000 000 0 2 00 3 0 3 333 3 0 2 0 0 0 0 3 0 33333 0 333333 3 333 3 3 3 3 3 2 3 1 3 33333333333333333333333333 0 2 3 2 3333 3 3 22222222222 3 333 2 33333333 2 3 2 33 2 3 0 3 0 0000 0 11 0 0 0 0 0 0 0 0 0000 1 1 1 11 11 1 2 2 2 1 3 33 33 3333333 3333 0 3 00 3333 0 0 000000 000 00000000 3 0 2 3 3 0 00000000 3 0 3 00 0 000000000000000000 0 01 0 0 22 33333 0 3333 3 3
22 1 33 2 2 00 0 0 3 00 333333333
20
0000 0 0 0 0 0 00000
00000000
40
0
00 3 0 3 0 0 0000000000000 00 0 0000000 1 1 0 0000 00 0 0 00 0
60
80
100
requirement number Figure 4.3: Disagreements between reviewers regarding the implementation of each GUI requirement. The horizontal axis enumerates the 108 requirements. On the vertical axis, there is one line per team. Requirements for which the reviewers were in agreement have a symbol plotted exactly on that line. Symbols above the line indicate that reviewer 1 gave a mark higher than reviewer 2, and symbols below the line indicate the reverse; the elevation is proportional to the difference between the two marks. The plot symbol (and color) indicates the lower of the two marks.
100 200
100
50
0
0 Java 9 Perl 1 Perl 2 Perl 5 PHP 6 PHP 7 PHP 8
20
Java 9 Perl 1 Perl 2 Perl 5 PHP 6 PHP 7 PHP 8
40
MUST SHOULD MAY
Java 3 Java 4
MUST SHOULD MAY
weight
150
60
Java 3 Java 4
count
80
Figure 4.4: Completeness of solutions in terms of the UI-related requirements implemented that are working correctly (grades 2,3,4). LEFT: Number of requirements. RIGHT: Ditto, weighed by effort.
22
Freie Universität Berlin, Institut für Informatik
4.2 Results 6. Team4 Java exhibits the second-least complete solution overall, with less than two thirds as much functionality as the next bigger one (of team5 Perl). The explanation of this difference is bad luck: team4 Java had severe difficulties with their technical infrastructure, see Section 16.3. 7. There is a consistent platform difference between PHP and Perl : According to the Welch-corrected normal-theory confidence interval for the mean difference in the number of UI requirements implemented, PHP teams will implement between 15 and 28 requirements more than Perl teams in 80% of the cases. Despite the small number of teams, this difference is even statistically significant (p = 0.02).
0 5 10 15
statuspage
0 5 10 20
memberlist
MUST SHOULD MAY
0 5 10 20
count
search
0 2 4 6 8
ttt
PHP 8
PHP 7
Perl 5
PHP 6
Perl 2
Perl 1
Java 9
Java 4
Java 3
0 5 10 20
registration
Figure 4.5: Number of correctly implemented UI-related requirements as shown above, but now differentiated by functional area (usecase). The bottom-to-top order (registration, ttt, search, memberlist, statuspage) was the order in which the usecases appeared in the requirements document. Note that the SHOULD requirements were also considered mandatory (just not ‘essential’ as the MUST requirements) and only the MAY requirements were explicitly optional.
Figure 4.5 differentiates these numbers by functional area: • With the exception of the less complete solutions 4 and 9, all solutions have by-and-large complete implementations of the basic usecases registration and temperament test (TTT). • Only team3 Java , team1 Perl , and team6 PHP have invested in the (difficult) search functionality significantly. • Compared to the other platforms, the PHP teams are remarkably consistent in their good coverage of the statuspage requirements. Summing up, we find 1. a remarkable consistence in the amount of functionality realized among the PHP teams, 2. a remarkable inconsistence in the amount of functionality realized among the Java teams, 3. and more functionality implemented by the PHP teams than by the Perl teams. 4.2.2 Webservice interface requirements 109-127
Figure 4.6 is the webservice equivalent of Figure 4.4 and shows the amount of functionality implemented in the non-UI area. Technical Report B-07-10, www.plat-forms.org
23
4 Completeness of solutions
10 20 8
PHP 7
PHP 6
Perl 5
Perl 1
0 PHP 7
0 PHP 6
5
Perl 5
2
Perl 1
MUST
10
Java 3
weight
MUST 4
Java 3
count
15 6
Figure 4.6: Completeness of solutions in terms of the webservice-related requirements implemented that are working correctly. All webservice requirements were MUST requirements. LEFT: Number of requirements. RIGHT: Ditto, weighed by effort.
• Only five of the teams have managed to deliver anything at all in this area and for three of those it is very little. • Team7 PHP has managed clearly the best coverage of the webservice requirements. • Team3 Java is the best on the Java platform. • The only consistent platform difference to be found here lies in the absence of substantial functionality in all three Perl solutions. This can be explained with the low level of WSDL support on the Perl platform, see also the Perl teams’ statements about this in Section 14.2.1 and Appendix B. Proponents of Perl would possibly consider the SOAP/WSDL-specific formulation of the webservice requirements to be an anti-Perl bias, so we will not dwell on this result.
24
Freie Universität Berlin, Institut für Informatik
5 Development process
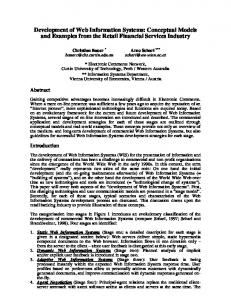
All nine teams worked together in a single room more than 400 square meters in size (Room “St. Petersburg” of the Congress Center Nürnberg). A few participants left the room for lunch or sometimes for breaks and all of them left it for at least a few hours during the night; the contest hotel was about two kilometers (30 minutes walking distance) away. The room featured a warm and cold buffet, which was the primary source of food and drink throughout the contest for most of the participants. Figure 5 shows the layout of the room and where each team was seated, and Figure 5.2 gives an idea what that looked like in reality. Teams chose the tables in first-come-first-served order of arrival and all of them were satisfied with what was left.
Figure 5.1: Approximate layout of the contest room. Numbers indicate teams. The arrows near the right wall indicate the viewing angle of the photographs shown in Figure 5.2.
Figure 5.2: View of the contest room at 21:18 of day 1.
All teams where happy with the arrangements and by-and-large considered the working conditions to be good (with a few exceptions such as too-simple chairs). The atmosphere during the contest was the calm-butconcentrated air of a set of professional programmers working undisturbed.
5.1 Data gathering method Data gathering for development process used two sources: manual observation during the contest and analysis of the source code version archive submitted by each team. 25
5 Development process 5.1.1 Manual observation
Three observers (Peter Ertel, Florian Thiel, Will Hardy) took turns logging the activities of the participants. Every 15 minutes one of them would make a tour of the teams (using the same route each time), recording one activity indicator for each team member (using a pen and clipboard) and taking one or two photographs of each team (see Figure 5.3 for examples). The activity indicators represent what the person was doing in the exact moment the indicator was determined. The following 17+1 different activity indicator (“status”) codes were used:
Figure 5.3: Examples of the photographs taken of each team every 15 minutes. LEFT: Team3 Java at 9:29 of day 1. RIGHT: Team3 Java at 18:29 of day 1. We took 982 photos of this kind and used about a dozen of them for resolving one particular inconsistency we found in the manually recorded data, where one of the three observers had confused two of the members of one team for a number of rounds.
• T: appears to be thinking (or scribbling on paper etc.) • RS: reads the specification (task description, on paper or as PDF) • D: uses development environment (IDE, Editor, shell, graphics program etc.; marked as D2 (or D3) if done together with a 2nd (or 2nd and 3rd) team colleague • E: uses email client • BP: uses a web browser, presumably on the prototype (marked BP2 or BP3 if done cooperatively by two or three people) • BO: uses a web browser on some other page (marked BO2 if done cooperatively by two people; BO3 never occurs) • CO: uses the computer HW/SW in some other way • TT: talks to someone from same team • TO: talks to someone other (e.g. the customer) • PF: pauses to consume food or drink • PP: pauses in some other way, but is present • PA: pauses and is absent (not in the room, but we checked neighboring rooms for possible T, RS, TT, TO) • (blank): missing data For the analysis below, we have grouped these codes in two different ways, an activity-centered grouping (“statuskind”): • • • • • • 26
browse: BO, BO2, BP, BP2, BP3 develop: D, D2, D3 think: RS, T pause: PA, PF, PP talk: TT, TO other: E, CO, (blank) Freie Universität Berlin, Institut für Informatik
5.1 Data gathering method and a grouping centered on communication and cooperation (“commstatus”): • • • •
communicating: BO2, BP2, BP3, D2, D3, E, TT, TO alone: BO, BP, CO, D, RS, T pause: PA, PF, PP other: (blank)
Recording started at 0.5 hours into the contest and ended at 29.75 hours into the contest. We missed recording the round at 16.25 hours (1:15 in the morning) and inserted the data from 16.5 hours in its place — which is fairly accurate because most participants had already left for the night by that time, so both codes will quite correctly be PA in most cases. We took a recording break from 20.5 hours (5:30 in the morning), when the last participant left the contest room, until 22.0 hours (7:00 in the morning) and recorded all PA codes for that time. 5 participants were already back at 22.0 hours, so we have missed a few activities and misclassified them as PA. No further data is missing. With respect to these data, we ask the following questions: • Are certain kinds of activities much more frequent (or more rare) for some of the platforms than for others? • Are there markedly different trends regarding the time at which these activities occur? 5.1.2 Questions to the customer
All of the teams approached the customer (i.e. me) with a question one or more times during the contest. I recorded a protocol of these questions which will also be reviewed below. 5.1.3 Estimated and actual preview release times
After about three hours into the contest I walked around and asked each team for an estimate when they would provide the first public preview version of their solution (which would be announced in the public contest blog and be accessible worldwide, so the team could receive feedback from external users via comments in the blog). The answers will be reviewed below together with the actual times at which the announcement of the preview appeared in the contest blog. 5.1.4 Analysis of the version archives
With respect to the product-related aspects of the development process, the check-in activity data recorded in the version control system can potentially provide much more fine-grained and insightful information than the manual observations we were able to make. Here are some of the aspects one would like to compare across platforms with respect to the use of the version control system: 1. 2. 3. 4. 5.
Number of check-in records overall Distribution of check-ins over time Distribution of check-ins over team members How often are different files checked in overall? Granularity of check-ins: (a) number of files checked-in at once, (b) size and nature of the deltas
We had hoped to gain a lot of insight from the respective analysis of the version archive data, but it turned out to be much less useful than expected. Here are some of the circumstances that made useful interpretation difficult: Technical Report B-07-10, www.plat-forms.org
27
5 Development process • Three different versioning systems were used: Perforce (team8 PHP), CVS (team3 Java, team7 PHP), and Subversion (all others). As each of these systems has a different basic versioning architecture and provides different information about check-in events, reconciling these data for unbiased direct comparison is difficult. • In contrast to some other research that focuses entirely on the analysis of version archives, this aspect is only a tiny part of the whole in our case. Consequently, we could not spend as much time for the extraction and cleaning-up of the version data as other researchers could. We wrote data extraction scripts in Python (using the pysvn and extracttools libraries) for Subversion and CVS and produced the extracts for those archives fully automatically by running these scripts. We asked team8 PHP to provide a comparable extract from their Perforce repository based on the Perforce’s SQL querying interface. As a result, we have information about the size of the version deltas only for CVS, but not for Subversion and Perforce. We can therefore not analyze aspect 5b from above. • Only team4 Java, team5 Perl, and team9 Java started into the contest with an empty version repository. All others prepared the repository with a large number of files some time before the contest, while these three did this only at the beginning of the contest. It is not immediately clear what a sensible comparison of such data sets should look like. • Two teams had set up their repository in such a way that the user actually performing the check-in was not visible in the archive data. Rather, all check-ins looked as if they were performed by user plusw for team2 Perl and by user subversion for team6 PHP. We can therefore only partially analyze aspect 3 from above. • A curious mishap occurred in the data of team4 Java: That team’s VMware-based Subversion server (running on a notebook computer) did apparently not readjust its operating system clock after the notebook had been in hibernate status during the night. As a result, all check-in timestamps of day 2 indicated impossible times in the middle of the night (where the server had been safely locked away in the contest room with a night-watchwoman) and we had to adjust those timestamps manually based on the difference between the last time in the data and the last actual check-in time the team reported when we queried them, 7:45 hours.
5.2 Results 5.2.1 Manual observation
Figure 5.4 does not suggest any consistent and salient differences between the platforms with respect to the overall frequency of any one particular activity type. A few large differences exist. For instance the count of BO is much larger in the Perl teams (mean 20) than in the Java teams (mean 7), for whatever that may tell us. The sum of the D2+D3 counts is much larger in PHP (mean 24) than in Perl (mean 9), which would indicate a higher level of direct development cooperation (in the sense of pair programming). However, neither of these differences is statistically significant, their p-values being 0.053 and 0.07, respectively — given the large number of possible differences and the lack of specific hypotheses where to expect them, we need to apply much lower bounds before considering something significant in order to make purely accidental findings less likely. For subsequent analyses, in order to simplify the interpretation of the data, we will aggregate the activity types into groups (commstatus and statuskind, as described above). Figure 5.5 bundles the activity types into 6 groups and then separates the data into 5 sequential phases of the contest. With respect to the phases, the results indicate roughly what one might have expected in terms of overall trends: The start phase has the biggest fraction of thinking, the day1 phase is dominated by development, night and, to a lesser degree, morning are heavy on pauses, and the last few hours are again dominated by 28
Freie Universität Berlin, Institut für Informatik
5.2 Results
PHP 6
PHP 7
PHP 8
Perl 1
Perl 2
Perl 5
150 100 50 0
count
150 100 50 0
Java 3
Java 4
Java 9
150 100 50
BO BP BP2 CO D D2 PA PF RS T TT TO E PP BO2 D3 BP3
BO BP BP2 CO D D2 PA PF RS T TT TO E PP BO2 D3 BP3
BO BP BP2 CO D D2 PA PF RS T TT TO E PP BO2 D3 BP3
0
Figure 5.4: Overview of the total frequency of different types of activity. Each item counted here represents one snapshot (at 15-minute intervals) of one person. A small number of activitiy types dominates the data, in particular D (development), PA (pauses and is absent), and TT (talks to a team member).
Java
Perl
PHP
count
400
end morning 2 night day 1 start
300 200 100
think
talk
pause
other
develop
browse
think
talk
pause
other
develop
browse
think
talk
pause
other
develop
browse
0
Figure 5.5: Frequency of different kinds of activities per platform for five major phases of the contest: start (9:00-13:00 hours), day1 (13:00-20:00 hours), night (20:00-6:00 hours), morning2 (6:00-12:00 hours), end (12:00-15:00 hours).
Technical Report B-07-10, www.plat-forms.org
29
5 Development process development. There appear to be no systematic differences between the platforms, but again the smaller bars are too difficult to interpret to be sure. think 30
talk 20 10
PHP 7
PHP 8
PHP 7
PHP 8
Perl 5
PHP 6 PHP 6
Perl 2
Perl 1
Java 9
Java 4
Java 3
0 PHP 8
PHP 7
Perl 5
PHP 6
Perl 2
develop
other
end morning 2 night day 1 start
Perl 5
Perl 2
Perl 1
Java 9
Java 4
Java 3
0 PHP 8
PHP 7
PHP 6
Perl 5
Perl 2
Perl 1
Java 9
Java 4
Java 3
PHP 8
PHP 7
PHP 6
Perl 5
Perl 2
Perl 1
Java 9
Java 4
Java 3
0
50
5
10
100 150
0 10 20 30 40 50
browse
Perl 1
Java 9
Java 4
Java 3
PHP 8
PHP 7
Perl 5
PHP 6
Perl 2
Perl 1
Java 9
Java 4
Java 3
0
50
100
0 10 20 30 40 50
150
pause
Figure 5.6: Frequency of different kinds of activities per team for five major phases of the contest: start (9:00-13:00 hours), day1 (13:00-20:00 hours), night (20:00-6:00 hours), morning2 (6:00-12:00 hours), end (12:00-15:00 hours). This is the same data as before, just with more detail (per team rather than per platform) and ordered differently.
Figure 5.6 shows the same data in more detail: separately for each team. It groups them by statuskind and uses different scales for each, so that even the smaller bars can be compared easily. We find a few spectacular differences (say, that team9 Java has paused three times as much as team1 Perl, or that team8 PHP has talked almost three times as much as team7 PHP, or that team9 Java was hardly ever observed to use a web browser), but the within-platform consistency is generally not high enough to diagnose systematic platform differences. There is one exception: a two-sided t-test finds a significant difference in the amount of talking between the Java and the Perl teams (p = 0.03); however, as team9 Java is special in many respects, not just its amount of pause, it is hard to say if this result actually means anything. The activity group with the highest consistency across teams is ‘develop’ — within-platform as well as across-platform. Comparing the individual sections of the bars (i.e. individual phases) rather than the whole bars also uncovers no systematic platform differences. Java
Perl
PHP
count
600
end morning 2 night day 1 start
400 200 0 alone communicating pause
alone communicating pause
alone communicating pause
Figure 5.7: As in Figure 5.5, but for the cooperation-related classification of activities: Frequency of different kinds of activities per team for five major phases of the contest, namely start (9:00-13:00 hours), day1 (13:00-20:00 hours), night (20:00-6:00 hours), morning2 (6:00-12:00 hours), end (12:00-15:00 hours).
Figures 5.7 and 5.8 correspond to the previous ones, but use the cooperation-centered (rather than the activitycentered) grouping of activity types. Here we use only three activity categories: not working at all (“pause”), working alone (“alone”), and working together with others or talking to them (“communicating”). In Figure 5.7 one gets the impression the Perl teams have moved some of the weight from the ‘pause’ bar to the ‘night’ section of the ‘alone’ bar. But again we need the decomposed view for clarity. 30
Freie Universität Berlin, Institut für Informatik
communicating
end morning 2 night day 1 start
PHP 8
PHP 7
Perl 5
PHP 6
Perl 2
Perl 1
Java 9
Java 4
Java 3
PHP 8
PHP 7
Perl 5
PHP 6
Perl 2
Perl 1
Java 9
Java 4
Java 3
0
50
100
20 40 60 80 0 PHP 8
PHP 7
Perl 5
PHP 6
Perl 2
Perl 1
Java 9
Java 4
Java 3
pause
150
alone
0 50 100150200250
x
5.2 Results
Figure 5.8: As in Figure 5.6, but for the cooperation-related classification of activities: Frequency of different kinds of activities per team for five major phases of the contest, namely start (9:00-13:00 hours), day1 (13:00-20:00 hours), night (20:00-6:00 hours), morning2 (6:00-12:00 hours), end (12:00-15:00 hours).
Figure 5.8 highlights a few teams. For instance we find that the pause-to-alone-during-the-night move in the Perl platform is due to team1 Perl and that team8 PHP ’s cooperative behavior is quite extraordinary overall, not just with respect to talking (as we had seen before). However, it is also obvious that there are no systematic trends that differ from one platform to another.
●
●
●
●
●
●
●
●
●
●
●
●
●●
●
●
●
●
●
●
●
●
●
●
●
●
●
●
●
●
●
●
●●
●
●
●
●
●
●
●
●
●
●
●●
●
●
●
●
●
●
●
●
●
●
0
●
●●
●
●●
●
●
●
●
●
●
●
●
●
●
●
●
●
●
●
●
●●
●
●●
●
●
●
●
●●
●
●●●●
●
●
●
●
●
●
●●
●
●
●●
●●
●
●
●●●
●
●
●
●
●
●
●●
●
●
●
●
●
●
●
●
●
●●
●
●
●
●
5
●
●●●●
●
●
●
●●
●
●
●●
other
●
●
●
●
●
●
●●
●
●
●
●
●
●
●
●●
10
pause
●
●
●
●
●
●
15
●●
●
●
●
●
●
develop ●
browse
●●
●●
●●●
●
20
think
●●
●
●●
●●
statuskind talk
●
●
●
●
●
●
●
●
●
●
●
●
●
●
●
●
●
●
●
●
●
●
●
●
●
●
alone
●
●
●
●
●
communicating
●●●
●
●
●
pause
●●●
●
●
commstatus
●
●
●
●
●
●
●
●●
●
●
●
PHP
●
●
●
●●●
●
●
Perl
●
●
●
●
●
●
●●
●
●
●
●
●
●
●
●
●●
●●
●
●
●●
●
●
●
●
●
●
●●
●
●
●
●
●
Java
tm33 tm32 tm31 tm23 tm22 tm21 tm13 tm12 tm11 tm33 tm32 tm31 tm23 tm22 tm21 tm13 tm12 tm11 tm33 tm32 tm31 tm23 tm22 tm21 tm13 tm12 tm11
25
●●●
30
Figure 5.9: Full view of activities: Time runs from left to right, each line represents one team member. For example, tm13 is always member 3 of his team (i.e. the second digit is the within-team member number – which means nothing at all), but belongs to team1 Perl in the Perl group, team3 Java in the Java group, and team6 PHP in the PHP group, as those are the lowest numbered teams (i.e. the first digit is the within-platform team number). There is one symbol per 15-minute interval for each person, with different symbols and colors representing different kinds of activities.
Figure 5.9 finally shows the raw data in almost complete detail, the only remaining aggregation being that of 17 activity types into 6 statuskinds. Each and every entry in our manually gathered process data is now represented by a separate symbol and we can look at the process performed by each individual team member. A lot could be said about this visualization but the most obvious platform-specific trend is the fact that there is none. Rather, there is quite a bit of individual behavioral style differences visible within most teams, making it appear even more futile to search for consistent platform-specific differences. Summing up, we could find no differences in the development processes as recorded by our manually collected data that were sufficiently large and consistent to attribute them to the platforms as such. Technical Report B-07-10, www.plat-forms.org
31
5 Development process 5.2.2 Questions to the customer
Team members approached the customer between once (team9 Java) and 13 times (team6 PHP). The questions regarded clarifications of the requirements, errors/inconsistencies in the requirements documents (there were 3 such errors, concerning requirements 24, 37, and 79), whether possible extensions of the requirements were wanted, and the procedural/organizational issues. Two further questions were based on not understanding or misunderstanding a requirement.
number of questions
20
15
procedure misunderstanding extension error clarification
10
5
Figure 5.10: How often team members from each platform inquired at the customer, separated by the topic or reason of the inquiry. The number of inquiries is not large enough to find interesting structure in a bar plot by teams or in a density plot per team running over the course of the 30 hours. The subsecting lines indicate the individual teams.
PHP
Perl
Java
0
Figure 5.10 shows the distribution of question types over the platforms. The numbers of questions are too small to make visualization per team useful. We see that overall the PHP teams asked the largest number of questions, in particular most procedural questions, the only misunderstandings, and the most queries regarding the errors present in the requirements document. The number of requirements clarifications requested is roughly the same for all three platforms. Such a difference might be expected (at least in comparison to Java) by people who believe that using a dynamic language tends to imply using more agile development attitudes [6], but the observations provide no clear-cut evidence in this respect. It is unclear whether these numbers indicate platform differences or not. 5.2.3 Estimated and actual preview release times Table 5.1: Times (measured in hours since contest start) when the teams announced their first public preview version in order to receive feedback. Estimates were made at about hour 3.5. All of the teams that released one preview also released a second one later, team1 Perl even a third.
team Java 3 Java 4 Java 9 Perl 1 Perl 2 Perl 5 PHP 6 PHP 7 PHP 8
estimated 11.0 8.0 9.0 7.0 7.0 never 5.5 9.0 9.0
actual 24.1 never never 9.4 13.7 never 6.0 never never
Table 5.1 clearly shows that most teams by far missed their own expectations regarding when they would have a first preview version of their application ready for inspection by outside users. The only team that came close was team6 PHP , who also had given the most ambitious estimate. Several teams eventually released no preview at all. 32
Freie Universität Berlin, Institut für Informatik
5.2 Results There are no consistent platform differences.
5.2.4 Analysis of the version archives
If version archives are used in a fine-grained fashion (which is common practice today, in particular in rapiddevelopment mode in a small team), they contain a lot of information about the development style: How many pieces of the software are begun early, how many late? When? How many people work on a piece? How often is a piece checked in? When is a piece “finished”? Such questions can be answered with good accuracy from version data and if substantial differences in development style exist between platforms, they will indicate them quite clearly.
●
PHP 8
M
N=1416
PHP 8
M
●
PHP 7
N=660
PHP 7
N=660
N=2824
PHP 6
N=2824
●M N=2153
Perl 5
●
PHP 6 Perl 5
M
Perl 2
●
M
Perl 1
N=746
● N=344 M
● N=204
Java 9
●
Java 4
●
Java 3 −100
M
M
−50
N=1416
0
hour
M
M
●
N=2153
●
Perl 2
N=746
Perl 1
●
N=344
Java 9
M
N=204
N=537
Java 4
N=5937
Java 3
● ●
M
N=537 N=5937
0
10
20
30
hour
Figure 5.11: LEFT: Distribution of all check-in activities over time per team. The whiskers indicate minimum and maximum. The minimum for team1 Perl is at -235 hours (or 10 days before the contest) and the minimum for team6 PHP is at -1052 hours (or 44 days before the contest). Hours 0 and 30 are the start and end of the contest. Activity at negative hours thus indicates preparatory check-ins performed before the contest. RIGHT: Just like before, but zoomed in to just the time range of the actual contest (0-30 hours).
Figure 5.11 shows that all teams except three exhibit check-in activity before — sometimes long before — the start of the contest (called hour 0.0); most pronounced for team3 Java, team6 PHP and team8 PHP, where more than three quarters of all file check-ins occur before the contest even started. The remaining teams (team4 Java, team5 Perl, and team9 Java) exhibit pronounced check-in activity early in the contest instead. We clearly need to compensate for these differences in our analysis somehow or we will get wildly distorted results. Note the fairly different total numbers of check-ins (indicated by N=...): One team from each platform has a total of more than 2100, whereas three other teams have less than 600. Note also that team9 Java stops checking files in already at 26.7 hours. Nothing of all this, however, suggests any systematic differences between the platforms. In order to remove the huge yet uninteresting early-check-in differences between the teams, we will now ignore all check-in events before hour 4.0 of the contest. Figure 5.12 shows the result. Look at the left part first. The first thing that attracts attention is the much shorter box of team2 Perl; they have concentrated their checkin activity more strongly near the middle of the contest than the other teams. Note the different numbers of underlying data points, from 410 for team3 Java down to 133 for team9 Java. Except for team9 Java, all teams have performed between 9 and 16 check-ins per hour during those 26 hours; team9 Java has only 4. But overall there is not much of interest to see in this graphic. The version on the right side is much more informative. It shows the exact same data, but includes smoothedout density plots that provide more detail about the changes of check-in frequency over time. All teams except team5 Perl show two peaks of activity, one on day 1 and another on day 2. But for team1 Perl and team6 PHP, the low during the night is much weaker than for the rest. Also, the position and width of the day 1 peak is Technical Report B-07-10, www.plat-forms.org
33
5 Development process
M
●
PHP 8
M
●
PHP 7
M
●
PHP 6
M
Perl 5
●
M
●
Perl 2
M
●
Perl 1
M
●
Java 9 Java 4
●
Java 3
M
● 0
M
N=290
PHP 8
N=264
PHP 7
N=276
PHP 6
N=395
Perl 5
N=371
Perl 2
N=256
Perl 1
N=133
Java 9
N=245 N=410
10
20
M
●
N=264
M
●
N=276 M
●
M
●
● ●
Java 3
M
● 0
N=256
M
●
N=395 N=371
M
Java 4
30
N=290 M
●
N=133 M
N=245 N=410
10
20
hour
30
hour
Figure 5.12: LEFT: Like before, but excluding all data up to contest hour 4 in order to suppress all preparatory checkins as well as the massive check-ins early in the contest and to look at the steady state thereafter only. The whiskers indicate minimum and maximum. RIGHT: As on the left, but also showing the density of check-in activity (as computed by a normal-distribution density estimator with R’s default bandwidth [20]). The height of the curve indicates the relative strength of check-in activity at that time.
different for the teams. In particular, team4 Java starts its check-in activity later than the others, which points to more extensive up-front design work (which indeed we saw happen during the live observation). Overall, however, we do again not find any hints as to consistent platform differences. Since the special behavior of team2 Perl appears to be an artifact of our hour-4-cutoff (some of their early check-ins were somewhat late), we move on to a different filtering method for looking at the check-in data.
M
●
PHP 8 PHP 7
●
PHP 6
M
M
● M
●
Perl 5
Perl 1
●
Java 9
10
M
N=55
●M
N=99
Perl 1
N=105
Java 9
N=79
Java 4
M
● 0
●
PHP 6
Perl 2
M
Java 3
PHP 7
N=141
Perl 5
●
Java 4
N=229 N=121
M
N=245 20
hour
M
●
PHP 8
M
●
Perl 2
N=168
30
N=168
M
N=229
●
N=141 M
●
N=121 M
N=55
●M
N=99
● M
●
N=105 M
●
N=79
M
●
Java 3 0
10
N=245 20
30
hour
Figure 5.13: LEFT: Like before, but including only files created manually (which by definition cannot be checked in before hour 0) in order to suppress all “uninteresting” check-ins. But no rule without exception: There is one file for team6 PHP that was checked in before contest begin, but where the degree of reuse was so small that we classified it as manually written. The whiskers indicate minimum and maximum. RIGHT: As on the left, but also showing the density of check-in activity (as computed by a normal-distribution density estimator with R’s default bandwidth [20]). The height of the curve indicates the relative strength of check-in activity at that time.
Figure 5.13 shows the check-in times for only those files that were written manually (class “M”), rather than reused as-is (“R”), or derived from reused files by modification (“RM”). The classification process is described in Section 10.1. This avoids all distortion stemming from potentially large numbers of reused files that are never modified (which previously required the cutoff before hour 4). Note that the resulting view is also not entirely neutral, as some teams have more “RM” check-in activity than others, but at least we can avoid the rather artificial cutoff of the early contest hours. 34
Freie Universität Berlin, Institut für Informatik
5.2 Results We find a rather different picture than before. Team6 PHP has an extremely uniform check-in activity throughout the contest. Except for a somewhat larger dip during the night, a similar statement also holds for team1 Perl and team5 Perl. However, there are no consistent platform differences. Next question: How do the different members participate in the check-ins within each team? 250
count
200
150
3 2 1
100
50
PHP 8
PHP 7
PHP 6
Perl 5
Perl 2
Perl 1
Java 9
Java 4
Java 3
0
Figure 5.14: Number of check-ins of manually written files per unique author. The authors are numbered 1, 2, 3 within each team, but this number is not correlated with the team member number of Figure 5.9 and not related from one team to another. Team4 Java, team5 Perl, and team7 PHP have a tiny number of check-ins (3, 2, and 1, respectively) that were performed from a fourth account. These were added to the author3 bar in this plot. In team2 Perl and team6 PHP, all members use the same version management account for performing check-ins, so their data is meaningless.
Figure 5.14 shows the distribution of the check-ins of the manually written files over the team members. As mentioned above, the data are meaningless for team2 Perl and team6 PHP, because all check-ins were performed through a quasi-anonymous account. Team3 Java, team4 Java, and team7 PHP have a dominant member accounting for half or more of all of that team’s check-ins. The other teams exhibit a more even distribution. There is no indication of a systematic platform difference in this respect.
100 80 60
3 2 1
40 20
PHP 8
PHP 7
PHP 6
Perl 5
Perl 2
Perl 1
Java 9
Java 4
0 Java 3
percent of manual files with N authors
Next question: How many check-ins occur per file?
Figure 5.15: How many authors checked in each file during the contest, shown as a fraction of the manually written files in percent. In team2 Perl and team6 PHP, all members use the same version management account for performing check-ins, so their data is meaningless.
Figure 5.15 shows how many of the manually written files were always checked in by the same person (i.e. have only one author) or by any two different persons or by all three possible different persons of that team. As before, the data are meaningless for team2 Perl and team6 PHP. For four of the remaining teams (team3 Java, team9 Java, team7 PHP and team8 PHP), 40 or more percent of all files were created cooperatively. In contrast, for team5 Perl and team4 Java this is true for less than 20 percent of the files. It is conceivable that a platform difference between Perl and PHP exists, but due to the missing information for team2 Perl and team6 PHP, we cannot know. The number of check-ins for each unique filename is shown in Figure 5.16. For the check-ins before hour 4, we make the odd observation that team3 Java performed all of their preparatory check-ins twice (once on the trunk and once as a branch). For the contest proper, we find a tendency that, compared to the other platforms, Technical Report B-07-10, www.plat-forms.org
35
5 Development process
PHP 8
●M
N=747
PHP 8
PHP 7
M
N=356
PHP 7
●
PHP 6
●
Perl 5
M
Perl 2
M
●
M
PHP 6
●
N=1734
Perl 5
●
●M
N=285
Perl 2
●M
Perl 1
M ●
N=74
Perl 1
●
Java 9
M
●
Java 4
M
●
N=290 M
●
Java 3
N=2816
0
5
10
15
20
25
number of check−ins of each file until hour 4
N=70 M
●
N=1282
N=60
N=113
●M
N=51
M
N=87 N=189
M
N=68
M
Java 9
●
Java 4
M
N=67
●
●
Java 3 0
N=172 M
N=180 5
10
15
20
25
number of check−ins after hour 4 of each file
Figure 5.16: Number of check-ins per file. Each point represents the number of check-ins for one fully qualified filename. LEFT: ignoring all check-ins and filenames after hour 4 of the contest. RIGHT: ignoring all check-ins before hour 4 of the contest. The data are jittered in both x and y direction for better visibility. One value of 92 at team5 Perl is cut off from the figure.
PHP has a larger fraction of files that are checked in more than twice. Less pronouncedly, this also appears to be true for PHP compared to Java. Let us look at it numerically. We will naively apply the t-test, even though its assumptions are violated wildly: The data is not at all distributed symmetrically, there is a sharp (and most densely populated) lower bound at 1, and there are a few outliers with very large values. All this makes the t-test very insensitive — which is just fine for us, because we are looking for rather conservative results. And in fact, despite this conservative estimate, the test reports large and highly significant differences. With an 80% confidence interval, the mean number of check-ins per file is lower by 0.7 to 1.5 for a Java team compared to a Perl team, and by 1.3 to 2.0 compared to a PHP team. The mean for Java is 1.9, so this is a fairly dramatic difference. The difference between Perl and PHP is not significant.
●M
PHP 8
N=44
●
PHP 7
M
N=42
●M
PHP 6
●
Perl 5
N=22
M
●
Perl 2
N=18
M
N=9
●M
Perl 1
N=20
●M
Java 9
N=42
M
●
Java 4
N=54 M
●
Java 3 0
5
N=42 10
15
20
25
number of check−ins of each manually written file
Figure 5.17: Number of check-ins per manually written file. Each point represents the number of check-ins for one fully qualified filename. The data are jittered in both x and y direction for better visibility.
Figure 5.17 looks at the same difference again, now only counting check-ins of manually created files. The absolute numbers are larger, but the trend is similar: With an 80% confidence interval, the mean number of check-ins per file is lower by 1.3 to 3.3 for a Java team compared to a Perl team, and by 1.4 to 2.7 compared to a PHP team. The mean for Java is 3.1, so this is again a big difference. The difference between Perl and PHP is not significant. So have we finally found a consistent platform difference (set aside the question what it would mean)? Hard to say. On the one hand, as we have seen in Section 4, we should exclude team4 Java and team9 Java from this comparison: The amount of functionality that these two teams have implemented is so much smaller than for the other teams that it is natural to assume that on average for each file they created the necessity to modify 36
Freie Universität Berlin, Institut für Informatik
5.2 Results it recurred less often than for the other teams — adding functionality often requires modifying files already present. But when we exclude these two teams’ data (note that we still have 44 data points from team3 Java in each comparison), the difference between Java and Perl or Java and PHP disappears. On the other hand, excluding them altogether may be misleading. How about just applying a discount on the number of check-ins per file when the amount of functionality implemented overall becomes larger? We will assume that for every 25% additional functionality added to an application, each file needs to be checked-in one time more often; that is, we will divide the number of check-ins by 0.01 log1.25 of the number of requirements implemented as counted in Section 4 (UI and webservice requirements together). Note that we do not have evidence that this calculation is indeed adequate, but it is a plausible approximation.
●M
PHP 8
N=44
●M
PHP 7
N=42 M
●
PHP 6
●
Perl 5
●
Perl 2 Perl 1
●
Java 9
M
●
N=18
M
N=22
M
N=9
M
N=20 N=42
●M
Java 4
N=54 M
●
Java 3
N=42
20
40
60
80
num. check−ins adjusted by functionality implemented
Figure 5.18: Number of check-ins per manually written file as shown in Figure 5.17, but adjusted according to the amount of functionality implemented by that team. The adjustment is a division by log1.25 (R) where R is the number of functional requirements successfully implemented, that is, the sum of that team’s bars from Figure 4.4 plus Figure 4.6. (The resulting value was then multiplied by 100 to bring it to a “nicer” number range.)
The resulting situation is shown in Figure 5.18. With 80% confidence, the adjusted Java teams’ mean of 19 is lower by 6 to 18 compared to Perl (p = 0.01) and by 5 to 11 compared to PHP (p = 0.003). So we conclude that a manually written file in a Java project does indeed tend to be checked-in fewer times overall than one in a PHP project and probably also one in a Perl project. Note that the number of files involved is larger in Java than in PHP and in particular in Perl, so a part of this difference may be due to file granularity differences rather than real development process differences.
●M
PHP 8 PHP 7
●
M
PHP 6
●
M M
●
Perl 5
N=44
M
●
Perl 2
●
Perl 1
●
Java 9
M
●
Java 4
●
Java 3 0
M
M
N=42
PHP 7
N=18
PHP 6
N=22
Perl 5
N=9
Perl 2
N=20
Perl 1
N=42
Java 9
N=54
M
N=42 10
20
30
hour of first check−in of each manually written file
M
PHP 8
●
N=44 M
M M
●
N=18
●
N=22 M
M M
●
Java 4
N=9 N=20
●
N=42 N=54
Java 3 10
●
●
M M
0
N=42
●
20
●
N=42 30
hour of last check−in of each manually written file
Figure 5.19: Time of first (LEFT plot) and last (RIGHT plot) check-in per manually written file. Each point represents all check-ins for one fully qualified filename. The whiskers indicate minimum and maximum.
Now let us consider the earliest and latest check-in time of each file and look at the corresponding distribution per team. These data are shown in Figure 5.19. The earliest check-in times (on the left) highlight a curious clear platform difference: All three Perl teams exhibit a fairly constant rate of introducing new files throughout the contest, with a rather modest decline for team1 Perl and team5 Perl and almost none for team2 Perl. In contrast, Technical Report B-07-10, www.plat-forms.org
37
5 Development process for all other teams, the curve drops to the lower half of the plot before hour 15, even for team4 Java which starts producing files rather later than the rest. The right half of the figure presents us with a staggering variety of different behaviors with clearly no consistent platform differences. Two teams show salient behavior, though: The curve of team7 PHP is an almost exact mirror image of the “first check-in” curve and just as extreme while the curve of team4 Java is remarkably similar to their own “first check-in” curve which suggests a highly regulated and formalized development style. Summing up, we find the following platform difference based on the version archive data: • Both the Perl teams and the PHP teams have on average (over that teams’ files) performed a larger number of check-ins of each of their individual manually created files than the Java teams. • The Perl teams performed first check-ins of manually created files at a more constant rate during the whole contest than the other teams did.
38
Freie Universität Berlin, Institut für Informatik
6 Ease-of-use
Ease-of-use (or usability) describes how simple or difficult it is to operate an application. This involves understanding and learning how to interact with it, the effort of an interaction, and the error-proneness inherent in its organization. In our case, as the functional requirements were fixed, ease-of-use refers to characteristics of the user interface only, not the functionality thus realized.
6.1 Data gathering method A quantitative assessment of usability usually involves mass usability testing with actual end users — a process far too expensive for our purposes. Note that while a quantitative assessment would be very relevant for our study, it is uncommon in normal software development practice, where usually we are more interested in finding out where we should improve a software product, rather than in quantifying how bad it currently is. In such cases, one usually performs only a qualitative assessment, either empirically (based on usability testing with actual users) or based on general guidelines as described for instance in Heuristic Usability Analysis [11]. Unfortunately, qualitative assessment is much less useful when trying to compare nine different solutions, as one quickly gets lost in the details of the individual descriptions. Due to the fine-grained nature of the explicit requirements in our case, however, we have a third possibility: We may just count the number of requirements whose implementation reviewers considered to be substantially better or substantially worse than the range of solutions one would usually expect to see for it. We collected this information along with the completeness checking as described in Section 4.1: it is in the difference of the marks “good” (4), “as expected” (3), and “bad” (2).
6.2 Results Figure 6.1 shows the proportion of requirements with particularly good or bad implementations relative to the normal ones. We observe the following: • Particularly well implemented requirements (grade 4) are too rare for any meaningful comparison. • The overall fraction of badly implemented requirements is substantial — presumably owing to the rather severe time pressure in the contest. • Team6 PHP provides the best quality overall. • Once again, the variation among the PHP teams is lower than for the Perl and for the Java teams. • The Java solutions tend to have a higher percentage of ‘bad’ implementations than the others. The 80% confidence interval for the difference ranges from 7 to 31 percentage points when comparing to Perl, and from 12 to 36 when comparing to PHP. Note that the interval is too wide for strict statistical significance (p = 0.08 and p = 0.05, respectively). Summing up, we found that the Java solutions tend towards lower ease-of-use (as measured by our rough ‘badly implemented’ proxy criterion) than both Perl and PHP solutions. 39
100
80
80
PHP 8
PHP 7
PHP 6
Perl 5
Perl 2
PHP 8
PHP 7
PHP 6
Perl 5
Perl 2
0 Perl 1
0 Java 9
20
Perl 1
40
20
Java 4
4 3 2
Java 9
40
60
Java 4
4 3 2
Java 3
60
percentage
100
Java 3
count
6 Ease-of-use
Figure 6.1: User interface quality of the correctly working functionality. Each vertical unit represents one requirement that was implemented by the respective team and that by-and-large worked correctly (LEFT figure) or one percent of these requirements (RIGHT figure). The lower part of each bar are the implementations whose quality was far below the expectations (grade 2), the middle part are the normal ones (grade 3), and the upper part are those with quality far above expectations (grade 4).
40
Freie Universität Berlin, Institut für Informatik
7 Robustness, error handling, security
Strictly speaking, robustness refers to the degree to which an application copes “well” with situations not covered by the specification. More common usage of the term means the quality of the detection and handling of unwanted situations, in particular invalid user inputs (error checking, error handling), also including cases that are discussed explicity in the specification. Security refers to an application’s capability to withstand purposeful attempts of users at making the application perform actions not normally possible or allowed. Individual gaps in that capability are called security holes or security issues. Error checking and error handling are closely connected to security, as many security holes are due to lack of proper error checking and/or error handling.
7.1 Data gathering method Thorough evaluation of the robustness, let alone security, of a non-trivial application is a task so large and so difficult that it exceeds even the resources of large companies or user communities. There are two complementary basic approaches: • Black-box evaluation is based on testing and considers the observable behavior of the system. Its difficulty is related to the complexity of the requirements implemented in the system. • White-box evaluation is based on source code analysis and considers the internal structure of the system. Its difficulty is related to both the complexity of the requirements and the technological complexity of the implementation of the system. Both approaches require high effort when attempting a thorough evaluation of a non-trivial system. However, when complex underlying technology is being used as it is in our case, white-box evaluation requires very deep and complete knowledge of this technology in order to ensure the validity of the results. Since the nine Plat_Forms solutions use a very broad set of technological elements, we do not feel qualified to perform a credibly reliable white-box evaluation of robustness and choose a black-box, testing-based approach instead. We also drop the idea of performing comprehensive robustness testing; instead, we will investigate a small set of fixed scenarios only. We base them all on the user registration dialog, because this is the most completely implemented (and presumably most mature) part of the solutions. Specifically, we check the handling of HTML tags in the input, of quotes in text and number fields, of non-western 8-bit ISO characters, of non-8-bit Unicode characters, of very long inputs, of sessions when cookies are turned off, and of invalid email addresses. We classify each reaction of an application as being either correct (good), acceptable (not-so-good), broken (bad), or security risk (very bad). 7.1.1 Handling of HTML tags / cross-site scripting
When registering one user, we use as the name something that contains a valid pair of HTML tags, namely Hugo , 41
7 Robustness, error handling, security and for another user something that contains invalid HTML markup, namely
Hugo ; we then retrieve the name via the statuspage or some other place in the application where it is displayed. Depending on its implementation, an application will usually handle this input in one of the following ways: 1. Store the data as is and escape the HTML metacharacters upon output. In this case, when the name is displayed, it will look exactly as it did in the input field (verbatim reproduction). This is the most flexible way in which an application can react — it can even accommodate people whose name happens to include HTML metacharacters (which is not entirely out of the question; just think of an ampersand). It is classified as correct. 2. Reject inputs containing HTML metacharacters and insist on purely alphabetical or alphanumerical input. This would be classified as acceptable, but none of the applications chose this approach. 3. Quietly remove the HTML tags from the input. In that case, both of our inputs would come back out of the application simply as Hugo. This will be classified as acceptable. However, this approach may be sensitive to individual ampersand or angle bracket characters, which we do then test separately. If we find any failures, the handling will be classified as broken. 4. Do nothing special at all. This will result in output using boldface in the valid HTML case described above (unless the CSS style sheet prescribes some other kind of formatting), which in this particular case could be considered acceptable. However, the invalid HTML tags will most likely ruin the layout of the whole page on which the name is displayed, which would be classified as broken. Note further that such behavior opens a gaping security hole by giving a user a simple method for inserting arbitrary Javascript onto the application’s pages (client-side cross-site-scripting, XSS) and should thus be considered a rather severe problem. Therefore, it will be classified as security risk. 7.1.2 Handling of long inputs
When registering a user, we paste a very long string into the name (or lastname) field of the registration dialog. The string is 100 000 characters long and contains a sequence of ‘a’ characters with a single space after 50 000 letters. We then retrieve the name and see what it looks like. We have seen the following reactions of the applications: 1. The input is cut off after a fixed number of characters, the application does not show an error or warning message (classified as acceptable). 2. The input is rejected as invalid with a not-so-helpful error message and the registration dialog continues (classified as acceptable). 3. The application shows a rather technical error message and the registration dialog breaks off (classified as broken). 7.1.3 Handling of international characters
When registering a user, we paste (via the clipboard) two chinese ideograms (encoded as 16-bit Unicode characters) into the firstname HTML input field and 10 greek letters (also encoded as 16-bit Unicode characters) into the lastname field — or the life motto field if there is only a fullname field. While the greek characters can in principle be stored and displayed in an 8-bit character encoding environment (if the appropriate encoding is used, typically ISO-8859-7), the chinese characters require Unicode to be used for display and correct 16-bit handling for storage. We then retrieve the name and see what it looks like. We have seen only two different reactions of the applications: 1. The characters are handled correctly. 2. An SQL exception occurs and the input is not stored, which we classify as broken. 42
Freie Universität Berlin, Institut für Informatik
7.1 Data gathering method 7.1.4 Handling of invalid email addresses
We successively register five users, using a different invalid email address for each of them: robustness (has no at sign), robustness@nothing (has no top level domain), robustness@com (has no second-level domain),
[email protected] (has a non-existent top level domain),
[email protected] (has a non-registered domain). Ideally, the application would reject all five of these. We consider the behavior correct, if the application rejects at least the first three, and broken otherwise. All applications reject either all five, or exactly the first three, or none at all. 7.1.5 Handling of invalid requests / SQL injection
When registering a user, we supply odd values in as many input fields as possible. We do not only use the HTML user interface to do this, but also generate HTTP requests directly, so that we can even abuse fields that normally receive their value from a dropdown list, radio button, etc. The issue about strange inputs is that for instance embedded quotes can interfer with SQL processing when the SQL code is written in a naive manner. Receiving a string where only a number is expected is even more likely to produce problems. Both of these kinds of weaknesses can possibly be used to make the system execute SQL code supplied by a user (“SQL injection”), which is a dangerous attack and huge security issue. Note that it is difficult to track down whether actual SQL injection is really possible (in particular when you need to be fair in a comparison and thus need to make very sure in which cases it is not and in which cases it is just harder), so we do not do this. We record any failures to process our inputs appropriately as broken only, i.e., when an exception is raised that stems directly from the SQL processing rather than the application logic. We record a solution as correct if it processes acceptable inputs correctly and rejects inacceptable inputs with an error message produced under proper control of the application. Note that in this approach, an application flagged as broken may actually be acceptable (in particular: secure), but it is impossible to be sure from the outside so we take a conservative approach. 7.1.6 Cookies and session stealing
We turned off cookies in the browser, attempted to log into an existing PbT account and looked how the application handled session tracking. There are three possible results: 1. The application may reject the login (with or without a proper error message), which we consider acceptable. 2. The application may fail/crash in some way, which we consider broken. 3. The application may perform the login and track the session via URL rewriting, i.e. all links subsequently generated by the application and pointing to the application are extended by an additional parameter sessionID or so that carries a unique string identifying the session on the server. This we consider acceptable. On the one hand, URL rewriting poses a security risk: The browser always sends the URL of the current page to the server in the HTTP request’s Referrer field so that if the application contains an external link, the respective third-party server gains access to the sessionID and is able to use the session as long as it exists without needing access to the login information. This is known as session stealing or session hijacking. On the other hand, being able to run an application with cookies turned off will be considered beneficial by some users. Furthermore, URLs including a sessionID can also be used for voluntary session handover, say, for passing a current session to a friend by just including the URL in an email. Altogether, there are situations when it may be considered more valuable to allow login even if cookies are switched off than to avoid this security risk — and PbT may be one of them. For this reason, we consider the possibility of session stealing a conscious decision and do not count it as a security risk. Technical Report B-07-10, www.plat-forms.org
43
7 Robustness, error handling, security
7.2 Results
PHP 8
lay
200
3
rej
PHP 7
lay
65k
3
rej
128
5
url
2x5k
0
exc
err
3
exc
rej
exc
rej
PHP 6 Perl 5
lay
Perl 2
err
Perl 1
96
0
Java 9
msg
0
nil
0
url
len
err
len
3
exc
url
int'l.
email
SQL
cookie
Java 3
long
Java 4
Figure 7.1: Summary of the robustness test results for all 9 teams. Green color means correct, yellow means acceptable, light red means broken, and bright red means security risk. White areas indicate results that could not be evaluated because some required functionality is missing in the respective implementation. Note that some of the broken entries may actually have security risks, too, but we did not test that thoroughly enough to be sure. The abbreviations in the cells are explained in the discussion.
The results of all the various robustness tests are summarized in Figure 7.1. We see that several of the applications have one or more weaknesses in terms of robustness and error checking — with the notable exception of team6 PHP : • Cross-site scripting (column in the figure): An entry ‘lay’ means the page layout was destroyed due to the closing tags supplied. Only the Java solutions all (at least as far as they can be checked) handle HTML tags in the input correctly1 . One team for Perl and two teams for PHP fail to do this, which poses a security risk. • Long inputs (column long): Numerical entries indicate the length after which the inputs were truncated; ‘msg’ means the application properly rejects input with an error message; ‘err’ means the application improperly fails with a non-user-level error message. Most applications cut off the input after a certain number of characters (ranging from 96 to 65536); team5 Perl cuts off firstname and lastname separately. Team2 Perl fails in an uncontrolled fashion, team3 Java wraps a similar technical (SQL-related) error message and includes it properly in the dialog, and team9 Java rejects the input with a misleading userlevel error message (“Please enter your full name”). • International characters (column int’l.): ‘len’ indicates that an SQL error message was displayed explaining that the allowed length of a database field had been exceeded. Only for PHP all three solutions are fully robust against our particular input containing international characters. Two solutions fail: team2 Perl and team3 Java, but note that the errors provoked in these cases refer to an input that is too long — an HTML-escaped chinese ideogram is 8 bytes long. • Email address validation (column email): The number indicates how many of our five invalid email addresses were rejected. Only for PHP are all three solutions robust against invalid email addresses. Team6 PHP even checks whether the domain given in the email address really exists; no other team does this. Team3 Java is the only team to perform email address validity checking for Java, team2 Perl is the only one for Perl. • SQL injection (column SQL): ‘exc’ indicates that some kind of SQL exception occured and the request data were not handled correctly. Only for PHP are all three solutions robust against invalid direct HTTP 1 Note
that in the screenshots in Appendix C team3 Java can be seen to perform double HTML-escaping. However, this does not happen with HTML tags but rather only with Unicode characters (because they are sent in an escaped 8-bit ISO encoding and are then not unpacked by the server because the respective option in the framework is not turned on).
44
Freie Universität Berlin, Institut für Informatik
7.2 Results requests. In contrast, all three Perl teams’ SQL handling and also one from Java are vulnerable to invalid HTTP requests in some way. Note that flagging these systems as broken is a compromise: On the one hand, the error message may be a symptom of a vulnerability that poses a security risk and the cell should actually be bright red. On the other hand, the application may be quite secure, the reaction could be classified as a system-level error message occurring when the system is used outside its specification, and the cell should be colored yellow (“acceptable”). Please refer to the discussion of black-box versus white-box evaluation in the introduction of Section 7.1 and the discussion for SQL injection in Section 7.1.5 for details. From what we saw in the source codes, it is our impression that the registration of all applications is probably secure (because user inputs are introduced into SQL processing only in the form of bind parameters, not by direct textual inclusion), but some of the search functionality possibly is not. • Session stealing (column cookie): ‘url’ means the application performs URL rewriting for including session IDs; ‘nil’ indicates the application produces no output whatsoever when cookies are turned off; ‘rej’ means the application does not allow log-in without cookies; ‘err’ means it fails with an SQL error message. The solutions of team1 Perl, team2 Perl, team5 Perl, team7 PHP, team8 PHP, and team9 Java all did not allow login without cookies. However, team5 Perl’s solution showed a security-related error message that is completely incomprehensible to users who do not happen to be advanced Perl programmers (“Can’t call method ‘id’ on unblessed reference”), and team9 Java’s solution displayed nothing at all any more, not even a login screen; they should both be considered broken. The solutions of team3 Java, team4 Java, and team6 PHP rewrote URLs to include sessionIDs when cookies were turned off and allowed a third party to use such a URL and thus steal the session. PHP is the only platform with no broken implementation. The SQL injection result is probably the most surprising. PHP, the platform that is usually considered the most notorious for its security problems, fails in the first of our security-related robustness checks — but is the only one to come clean out of the other. Summing up, the robustness checks suggest a number of platform differences. Only Java always handled HTML tags in the input correctly; only PHP always handled international characters correctly, always validated email addresses sufficiently, and always was robust against our simple manipulated HTTP requests.
Technical Report B-07-10, www.plat-forms.org
45
8 Correctness/Reliability
8.1 Data gathering approach The effort required for developing and executing a full-fledged detailed defect test for all nine solutions is not viable. Furthermore, even if it was, it would not be easy to avoid bias in the testing strategy, given the rather different structures of user interfaces the teams have chosen for their solutions. We do therefore not perform detailed testing and ignore subtle defects entirely. Rather, we collect only those defects that are big enough to show up in simple basic usage of the solutions and that we have therefore found during the completeness testing as described in Section 4.1. This approach to gathering correctness information means to count the requirements for which a solution received a grade of 1 (“incorrect”). Note that this value is a reasonable characterization of correctness, but not necessarily one of reliability: Some deficiencies will show up much more frequently than others and some will have much worse influence on the usefulness of the solution than others. We have considered defining a weighting scheme to reflect this but found it impossible to do it in a fair manner: The damage weight of a grade 1 for a particular requirement often depends on the nature of the failure and would thus have to be team-specific. Given the rather different UI approaches chosen by the teams, we felt unable to ensure our neutrality in chosing a weight and so chose to ignore reliability and usefulness issues and fall back to judging correctness only.
8.2 Results
20 40
PHP 8
PHP 7
Perl 5
PHP 6
Perl 2
Perl 1
Java 9
Java 4
PHP 8
PHP 7
Perl 5
PHP 6
0 Perl 2
0 Perl 1
10
Java 9
5
Java 4
MUST SHOULD MAY
20
Java 3
10
weight
30
MUST SHOULD MAY
Java 3
count
15
Figure 8.1: Number (LEFT figure) or weighted number (RIGHT figure) of UI requirements whose implementation received a grade of 1 (“incorrect”) during completeness testing, meaning the implementation malfunctions massively (i.e., in a quarter of all cases or more).
Figure 8.1 shows the amount of incorrectness in absolute terms, independent of the (rather variable) amount of functionality that worked correctly. We observe the following: 46
8.2 Results • For this data, it does make a substantial difference whether we weigh or not. Some teams have more defects than others but most are in simpler requirements so that some count differences disappear after weighting. • Team1 Perl has by far the largest number of incorrectly implemented requirements. 12 of them pertain to the search usecase — note that most teams implemented much less of this usecase (see Figure 4.5) and so did not even have the opportunity to make similar mistakes. From the source code, it appears that all 12 of these are due to just one incorrect routine whose task it is to create the SQL query. There are two versions of that routine in the source code: the first one is commented out and the other bears the comment “OK , NO TIME TO FIX, LET’S TAKE BRUTE FORCE”. • Team8 PHP has excellent correctness with just one single mistake in the search usecase, only one fourth as many defects as the runner-up. Team4 Java’s defect weight is also quite small (but should be viewed relative to the lower amount of functionality implemented) and team2 Perl is best on the Perl platform (because team5 Perl’s problems more often concern MUST requirements). • All of the remaining solutions have a roughly similar amount of weighted defects. • All of team9 Java’s 5 defects are in the TTT usecase. Comparing the correctness of the webservice implementations is not useful because of the generally low fraction of requirements that were implemented at all. Summing up, we do not find any consistent platform differences here.
Technical Report B-07-10, www.plat-forms.org
47
9 Performance/Scalability
Scalability refers to the degree to which a system (here: a complete software configuration on given hardware) can cope with large amounts of data and/or high request load without producing unacceptably long response times or even failures. As web applications are potentially used by large numbers of users at the same time, good scalability tends to be important for them. The common approach for measuring scalability for web applications is http-based load testing. A special load testing tool sends large numbers of requests in a well-defined way and measures the response times (and possibly server-side load metrics as well). Setting up such load tests, however, is a rather laborious and cumbersome task: First, sending the same requests over and over again produces misleading results if the system-under-test uses caching, but anything else requires that the load testing script is capable of producing an arbitrary volume of realistic and valid input data automatically. Second, the intended navigation may involve URLs that are generated dynamically according to rules that are not always obvious. Furthermore, as the Plat_Forms solutions all have different user interfaces, we would need to set up not just one, but nine such tests. In order to escape this difficulty, the task contained requirements that specified a webservice interface based on SOAP/WSDL that should look exactly identical for all solutions. We had hoped to use this interface for the load testing and thus avoid having to go via the many different HTML interfaces. Unfortunately, too few of the teams implemented the SOAP interface for a comparison to make sense. The same problem also inflicts the alternative solution of going the hard way and implementing load tests for nine different HTML GUIs: The part of the functionality most relevant for the load test, namely the search for members, is implemented to a sufficient degree by only 2 of the nine teams (team3 Java and team1 Perl). Summing up, it is unfortunately not feasible to perform load testing for the given solutions, so we have to leave the question of scalability-related platform differences unanswered for the time being.
48
10 Product size
The length of a software system’s source code is known to be a key determinant not only of the effort for initially implementing the system, but also for the effort for understanding, modifying, and debugging it during maintenance. As the requirements were fixed, we will use the size of the system’s source code (in a broad sense, see below) as our measure of product size. In a previous study comparing programming languages [16, 15] which compared solutions to a task with fixed requirements built with unlimited time, the length of the source text (source code) implementing a fixed set of requirements turned out to be a key feature of the study results, as it was on average a rather good explanation of the effort required. We do therefore expect that it is valuable to measure the size of the Plat_Forms solutions adequately. We would like to answer the following questions with respect to size in comparison of the individual solutions and the platforms: • • • •
Size-1: Size-2: Size-3: Size-4:
How big are the solutions overall? How much of that is hand-written and how much is reused or generated? How is the size distributed over pieces of different kinds (such as code, templates, data)? How does size relate to the amount of functionality that is implemented?
10.1 Data gathering method The size measurement is based on the files contained in the source code distribution package that each team submitted at the end of the contest. The instructions for what should go into that package said “This distribution should contain all files needed to recreate an instance of your PbT service except those that already existed before the contest and were not modified.”. Still, some teams included much more material in the package than others. To compensate for that, we have excluded large-scale reused material (usually frameworks or reusable components) from the package contents before starting the analysis. For instance, team4 Java included the whole Tomcat application server in their source package and several teams included substantial Javascriptrelated libraries or components such as the FCKEditor WYSIWYG HTML editor. Quite sensibly in spite of our instructions, most teams also included individual files that are reused or groups thereof. We have left these files in, as they could be considered part of the core of the product rather than separate components; the discrimination is inherently fuzzy, though. Even after this initial alignment, however, measuring the size of the Plat_Forms solutions adequately is far from trivial, as not all code is created equal. First, there are binary files such as images, for which it is entirely unclear how to handle them adequately. In our case, most of these were probably not created during the contest at all, so we chose to ignore them completely. Ideally, we may want to discriminate between (1) different syntactical kinds of source text (such as HTML, XML, Java, Perl, PHP, WSDL, plain text, etc., typically simply by filename suffix), (2) different roles of files: template (indicated as templ), data or configuration (doc), program (prog), auxiliary (aux, such as build scripts), and documentation (doc), and (3) the following different origins of the individual source text files: • G: source text generated fully automatically by some tool 49
10 Product size • • • •
R: source text reused as is (that is, whole files reused without modification) GM: source text generated by some tool and then modified by hand RM: source text reused with some modifications M: source text written manually
But not only is this discrimination inherently somewhat fuzzy (as generation and reuse with subsequent modification are both difficult to delineate from hand-editing), it is also quite difficult to operationalize it. We have, however, attempted to classify each source file by relying on the following information: • build automation files (such as Makefiles, ant files etc.) that indicate which files are generated; • copyright and author information in the first few lines of a file that often indicate files that are reused; • large files or whole subtrees of files that realize functionality which is obviously much more powerful than what was required for the task and that therefore indicate files that are reused; • version management records that indicate modifications to files or complete lack of such records. The classification process was initially performed by one reviewer, who would mark all files whose classification appeared unclear even after applying the above (which pertained to 5, 0, 27, 15, 3, 1, 1, 2, 0 files for teams 1, 2, 3, 4, 5, 6, 7, 8, 9, respectively). These cases were then carefully discussed with a second reviewer and classified based on the strongest argument that could be made for a particular class. Despite this procedure, we expected that we had misclassified a small number of files and so we now asked each team to nominate a member for reviewing the file classification in case we had overlooked or misrepresented something. We quickly validated any changes requested and then incorporated them into our dataset. Teams 1, 2, 3, 5, 6, 7, 8 participated in this procedure while team 4 Java and team9 Java did not. We refrain from any attempt to quantify the extent of manual modification; we assign one of the five categories mentioned above to each file and report size results by category. When measuring an individual source file, we measure size by lines-of-code (LOC). To do so, we discriminate each physical line as being either an empty line (ELOC, containing nothing but possibly whitespace), a comment line (CLOC, containing nothing but comment), or a statement line (SLOC, all others). If an SLOC additionally contains a comment, it is counted again as a commented statement line CSLOC (the CSLOC are thus a subset of the SLOC).
10.2 Results
PHP Perl Java
M
7 8●
● 1 2
PHP
6 M
Perl
5 M
● 4
9 0
10
20
30
40
3 50
60
Java
8 7●
● 12
M
6 M
5 M
9 4● 0
3 10
20
30
40
srcSize verSize Figure 10.1: Size of two ZIP (or tgz) files delivered by each team, in Megabytes. The whiskers are suppressed. LEFT: The source code distribution file. RIGHT: The version archive.
Figure 10.1 shows the size of the source-related deliverables of each team. Sizes vary over a rather wide range, but no consistent trends that depend on platform are visible. Note that the large size of team4 Java’s source distribution is not reflected in the version archive, an indication of large-scale unmodified reuse (in fact, they packaged the complete Apache Tomcat application server in their source archive). A closer investigation of the deliverables shows that such reuse is also present in the solution of team3 Java, but they decided to check the reused parts into their version archive as well. 50
Freie Universität Berlin, Institut für Informatik
10.2 Results For these reasons, the archive sizes do not describe the size of the actual product, so let us have a look at the actual contents of the archives ignoring all non-source elements.
templ prog doc data bin aux
1000
500
number of files total
number of files total
1500 150
templ prog doc data bin aux
100
50
PHP 8
PHP 7
Perl 5
PHP 6
Perl 2
Perl 1
Java 9
Java 4
Java 3
PHP 8
PHP 7
Perl 5
PHP 6
Perl 2
Perl 1
Java 9
Java 4
Java 3
0
Figure 10.2: LEFT: Number of files by role of file. RIGHT: Ditto, but showing the lower part of the vertical scale only.
Figure 10.2 shows impressively that the team3 Java package dwarfs all of the others in terms of the number of files it contains. This is due to a rather large set of pieces (many of them graphical elements such as icons, etc.) that together form a large reusable application template (called the “vanilla portal”) coming with team3 Java’s framework. Team3 Java’s source archive does also provide the largest number of different file types (as described by filename suffixes), namely 39,1 compared to as few as 4 (team7 PHP) to 17 (team4 Java) for the other teams.
RM R M GM G
1000
500
number of files total
number of files total
1500 150
RM R M GM G
100
50
PHP 8
PHP 7
PHP 6
Perl 5
Perl 2
Perl 1
Java 9
Java 4
Java 3
PHP 8
PHP 7
PHP 6
Perl 5
Perl 2
Perl 1
Java 9
Java 4
Java 3
0
Figure 10.3: LEFT: Number of files by origin of file. RIGHT: Ditto, but showing the lower part of the vertical scale only.
Figure 10.3 provides evidence regarding how the files came to be: • Team9 Java and team1 Perl are the only ones never to modify a reused file. This can be considered good style. • Only one of the PHP teams uses generated files (team6 PHP, and it uses only four of them), while all of the Java and Perl teams have a substantial number of these. 1 Hard
to believe? Here they are: (none) bat bom classpath cmd conf css cvsignore dat dtd gif html ico iml ipr iws jacl java jpg js jsp ndx pal png project properties root sh sql tld txt url wmp wsdd wsdl xcf xmi xml xsl. About three of them are indeed not really suffixes, but rather names of invisible files (the name part in front of the suffix is empty).
Technical Report B-07-10, www.plat-forms.org
51
10 Product size
PHP 8
PHP 7
Perl 5
PHP 6
Java 3
PHP 8
PHP 7
Perl 5
PHP 6
Perl 2
Perl 1
Java 9
Java 4
0
50
Perl 2
100
100
Perl 1
200
RM R M GM G
Java 9
RM R M GM G
150
Java 4
300
number of prog and templ files
400
Java 3
number of prog and templ files
• Each of the Perl teams modifed one or more generated files (one file for team2 Perl, many more for the other teams), while there was hardly anything of this nature for Java (only one file for team3 Java) and PHP (only three files for team6 PHP). Manually modifying generated files tends to be a cumbersome or even problematic practice.
Figure 10.4: LEFT: Number of files by origin of file for the ‘program’ and ‘template’ files only. RIGHT: Ditto, but showing the lower part of the vertical scale only; the same scale as in Figure 10.3 above.
PHP 8
PHP 7
PHP 6
Perl 5
Perl 2
PHP 8
PHP 7
PHP 6
Perl 5
Perl 2
Perl 1
Java 9
Java 4
0
2000
Perl 1
20000
4000
Java 9
40000
RM R M GM G
6000
Java 4
RM R M GM G
8000
Java 3
60000
total SLOC (data,doc,prog,templ)
80000
Java 3
total SLOC (data,doc,prog,templ)
Figure 10.4 shows the same data filtered to include only the ‘program’ and ‘template’ files but removing files in any other role. The resulting observations are the same as before.
Figure 10.5: LEFT: Totals of file size (in SLOC) by file origin. RIGHT: Ditto, but showing the lower part of the vertical scale only.
Figure 10.5 switches the perspective from number of files to lines-of-code (LOC). We note that the generated files of team3 Java and team1 Perl are rather large, likewise the files reused by team1 Perl. The PHP solutions are once again very similar to each other in their composition and have by far the highest fraction of manually created lines. Figure 10.6 shows that this does not change when one counts only the ‘program’ and ‘template’ files rather than all textual files. Figure 10.7 considers only the manually written files. We find the following: • The number of different file suffixes ranges from 2 (team7 PHP) to 6 (team8 PHP). 52
Freie Universität Berlin, Institut für Informatik
10.2 Results
30000
RM R M GM G
20000
10000
total SLOC (prog,templ)
total SLOC (prog,templ)
40000 8000
RM R M GM G
6000
4000
2000
PHP 8
PHP 7
Perl 5
PHP 6
Perl 2
Perl 1
Java 9
Java 4
Java 3
PHP 8
PHP 7
Perl 5
PHP 6
Perl 2
Perl 1
Java 9
Java 4
Java 3
0
40
templ prog doc data
30 20 10
3000
templ prog doc data
2000
1000
PHP 8
PHP 7
PHP 6
Perl 5
Perl 2
Perl 1
Java 9
Java 4
Java 3
PHP 8
PHP 7
PHP 6
Perl 5
Perl 2
Perl 1
Java 9
0 Java 4
0
total SLOC (manual files)
50
Java 3
number of files created manually
Figure 10.6: LEFT: Totals of file size (in SLOC) by file origin for the ‘program’ and ‘template’ files only. RIGHT: Ditto, but showing the lower part of the vertical scale only.
Figure 10.7: Manually created files. LEFT: Number of files. RIGHT: Totals of file size (in SLOC).
• The statistical evidence is a little weak, but it appears that Perl solutions tend towards a higher fraction of template files (in our case 50%) than do PHP solutions (30%, lower by 6 to 36 percentage points with 80 percent confidence) and Java solutions (22%, lower by 6 to 50 percentage points with 80 percent confidence). • There are hardly any template files in the solution of team9 Java. This is due to the nature of the server-side Eclipse architecture used, which is very different from those of all the other teams — a problem for the comparison in some respects. • The Perl solutions consist of fewer manually created files than the Java solutions (the difference is 20 to 34 files with 80% confidence) and tend to consist of fewer than the PHP solutions (the difference is -1 to 32 files). • The Perl solutions have fewer lines-of-code than the PHP solutions (the difference is 487 to 2035 SLOC with 80% confidence) and tend to have fewer than the Java solutions (the difference is 332 to 2511 SLOC). • Team4 Java is the only one to write a pure documentation file. The left part of Figure 10.8 normalizes the file size by the amount of functionality implemented by each team. There is a tendency that Perl solutions and PHP solutions require fewer manual lines of code (averages: 27 and 34) per requirement than Java (average: 92), but the variance is too high to detect a consistent trend. The most compact solutions on each platform, relative to their functionality, are those of team3 Java , team1 Perl and team6 PHP . Technical Report B-07-10, www.plat-forms.org
53
3000
7 8
2000
9 4 5
6 2 1
0
50
3
1000
templ prog doc data
100
total SLOC of manually written files
150
PHP 8
PHP 7
Perl 5
PHP 6
Perl 2
Perl 1
Java 9
Java 4
0 Java 3
total SLOC per impl. req. (manual files)
4000
10 Product size
0
20
40
60
80
100
number of implemented requirements Figure 10.8: LEFT: Totals of file size (in SLOC) of manually created files divided by the number of functional requirements successfully implemented, that is, the sum of that team’s bars from Figure 4.4 plus Figure 4.6. RIGHT: Linear regression of the same data, showing how total size in SLOC depends on number of requirements. Each digit represents one team, using a different color for each platform.
The right part of the figure provides an alternative view: a linear regression of size in SLOC by number of implemented requirements, now allowing for a constant offset, a sort of base size for a minimal application. We see that two of the Perl solutions require much fewer lines of code than predicted by the regression, while two of the Java solutions require many more than predicted. Once again, the PHP solutions exhibit less variability than those of the other two platforms. Summing up, we find that the Perl solutions were the smallest ones, both in absolute terms and relative to their functionality, and that they were also the most template-driven ones.
54
Freie Universität Berlin, Institut für Informatik
11 Structure
The term structure can mean a lot of things with respect to a Plat_Forms solution. The most interesting meaning would refer to the software design (elements and their relationships) or to recurring characteristics within that design. Unfortunately, a repeatable yet meaningful assessment of individual designs is very difficult. The software metrics research community has spent several decades on this topic without any really satisfactory results. Even a subjective, and possibly non-repeatable assessment is difficult: An adequate understanding of the design of a solution requires not just in-depth knowledge of the particular platform in general, but also a good understanding of the particular framework(s) used. And even if we had such understanding, it would be difficult to formulate the results in a manner that does not require similar knowledge on the part of the reader, which would obviously be a rather silly assumption to make. With a sigh, we do therefore refrain from assessing the design semantically and withdraw to a number of rather simple syntactic analyses instead; we console ourselves with the observation that at least such simple measures have a clear meaning. We ask the following questions: • • • • •
Structure-1: Structure-2: Structure-3: Structure-4: Structure-5:
How big are the individual files of each solution? How much commenting and empty lines do they contain? How many files are typically bundled into a group (directory)? How deeply are the directories nested? How long are the filenames?
11.1 Data gathering method These results are based on the data described in Chapter 10. We use the lines-of-code (LOC) information described there, derive the directory structure by splitting each full pathname into its directory part and basename part, and compute the depth of a directory in the structure (by counting the number of “/” characters in the path) and the length (in characters) of the basename.
11.2 Results Let us first review the distribution of file sizes (in LOC). Figure 11.1 shows that the size of a file does hardly depend on its origin for large numbers of files for any of the teams. In particular, there are only few very large automatically generated files (“G”). There are no consistent platform differences. Figure 11.2 portrays the file size distributions for the core of the applications: The manually written program and template files. The template files tend to be fairly consistent in their size (around 40 lines) across all teams except team5 Perl and team6 PHP where the sizes and their variation are both somewhat larger. The variation in the size of the program files is larger, but many of them are rather small, several groups have a median size of less than 30 statements. As an interesting side note, the whole contest has produced only four manually written files larger than 300 statements; a nice indication of how powerful the platforms are. 55
11 Structure
200
400
R PHP 8
●M
PHP 7
M
PHP 6
RM N=8
M
●
N=11 ●
M
N=15 M
●
N=5 ●
N=18 M
● M
●
N=29 ● M
● ●
Java 4
M
N=20
N=7
M
Java 9
N=2
M
Perl 1
Java 3
800
N=9 ● M
Perl 5 Perl 2
600
N=3 N=38 ●M
●
●
M
N=18 M
●
N=403
N=4
G
GM
M M
●
PHP 8
●
PHP 7 M
●
PHP 6 Perl 5
M
●
Perl 2
M ●
Perl 1
M
●
N=36
N=17
M
N=11 ●
N=14
N=1 ●M
N=18
M ●
N=10 M
●
●
N=2
M
N=15 ●
N=42
M
M
N=17
M
N=41
N=16 ●
Java 9
●
Java 4
M
Java 3
N=38
M
● M
●
M
●
N=11 200
400
600
N=48 M
●
N=1
N=36
800
200
400
600
800
SLOC Figure 11.1: Sizes of program and template files by origin of file.
0
100
200
prog PHP 8 PHP 7 PHP 6
Perl 1 Java 9 Java 4 Java 3
N=26
●
M
●● ●● ● ●● ● ●● ● ●●● ●● ● ● ●● ● ●
● ●
●
● ●
M
● ●● ● ● ●● ●
●
● ●● ● ● ● ●●
● ● ●
N=6
● M
● ● ● ●
N=9
● ●
M
N=6
●
● M
● ● ●●●●● ● ● ● ● ● ●● ● ● ● ● ● ● ●
●
●
N=40
●● ●
M
● ● ●●●●● ● ●● ● ● ●
0
N=25
● ●
●● ● ● ● ●● ● ●● ● ●●
N=31
M
100
●● ● ●● ●
200
●
●
300
M
● ● ● ● ● ●
●
N=27
●
N=12
●●
M
● ●● ● ●● ●●
● M
N=11 ●
●
M
Perl 5 Perl 2
●●
● ●
● ●●
400
templ
M
● ●●● ● ● ● ● ●
300
●
●● ●
●
●●
●●
N=6
● ●
M
●
● ● ●
M
● ●● ●● ●● ●
●●
N=8 N=9
●
M
● ●● ● ●● ●
N=11
●
M
● ●
N=11 N=1
M
● ● ●● ● ●● ●
N=23
M
● ● ● ●● ● ●●
●
N=9
400
SLOC (manual prog and templ files only) Figure 11.2: Sizes of manually written program and template files.
56
Freie Universität Berlin, Institut für Informatik
11.2 Results Overall however, this plot does also not reveal any consistent platform difference. So let us move on to look at the density of comments and empty lines.
PHP 8 PHP 7 PHP 6 Perl 5 Perl 2 Perl 1
M
● ●● ●● ●● ●● ●
● ●● ●●● ● ●● ● ●● ●● ● ●
N=32
M
●● ●● ●● ●●●● ●
● ●
N=15
●
M
● ●
N=12 M
● ● ● ●
●●
N=14
●
●
M
● ● ● ●
N=7 M
Java 9
● ● ●● ● ●● ● ●● ●●●●● ●● ●●● ● ● ●●●● ●
Java 4
● ●
Java 3
N=19
●
●
M
N=31 ●
M
●● ● ● ● ●● ●● ●● ●● ●●
N=37 ●
●
M
● ●●●● ● ● ● ● ● ●●● ● ●
N=27
●
0.0
0.5
1.0
1.5
2.0
(CLOC+CSLOC)/SLOC (manual prog and templ files of 30+ LOC only)
Figure 11.3: Distribution of the number of comment lines (CLOC or CSLOC) per statement line (SLOC) for manually written program and template files. Since very small files could heavily distort this picture, files with an overall length (including empty lines) of 30 lines or less are excluded.
Figure 11.3 shows comment density per file. Most teams tend to comment rather little, with a median of 1 line or less of comment per 10 statements. Notable exceptions are team6 PHP and team9 Java , which tend to comment a lot more — and, unlike team4 Java, do it consistently. Team2 Perl likes the extremes and comments either not at all or very heavily; team1 Perl hardly uses comments at all. Consistent differences between the platforms, however, do not appear to exist in this respect.
PHP 8 PHP 7 PHP 6 Perl 5
●●●
M
● ● ●●●● ● ● ●●
● ●● ● ●●
●
●●
● ●
●● ●●
●●
●
● ●
● ●● ●●● ●●
M
●
●●● ●
●
●
N=15
●
●●●● ● ● ● ● ● ●●●●
● ● ●
●
N=18
M
●
Perl 1
●●
Java 9
●
● ●
●
●● ●
●
N=14
●●
M
●
● ●
●
N=7
●
● ● ●● ●●● ●● ●
● ●
●● ● ● ●
●
● ●
M
● ● ●● ● ● ● ●●● ● ●●●
●● ●●
N=31
●
M
●
● ●● ● ●●●
●●●
●● ●● ●●
M
Java 3
●
0.0
● ●● ● ●●●● ● ●● ● ●● ● ● ●● ● ●● ● 0.1
0.2
N=22 N=32
●
M
Perl 2
Java 4
M
● ● ●●●● ●● ● ● ●
● ●
● ●
0.3
●
●
0.4
ELOC/LOC (manual files of 30+ LOC only)
N=39 ● N=32 0.5
Figure 11.4: Distribution of the number of empty lines (ELOC) per overall line (LOC) for manually written files. Since very small files could heavily distort this picture, files with an overall length (including empty lines) of 30 lines or less are excluded.
Figure 11.4 shows the distribution of the amount of empty lines found in each file (as a fraction of the overall length). We look at this out of sheer curiosity, with no particular expectation. Except for team1 Perl, which uses fewer empty lines, every fifth line is empty on average in the files of each team, with a good deal of within-team variability from file to file. Once again, however, consistent inter-platform differences could not be found. So we next tackle the third question: file grouping granularity. Figure 11.5 shows the distribution of the number of files residing in the same directory. This analysis is useful if one assumes that the directory structure reflects some kind of grouping or packaging, which we will do here. Most striking here is the quantity of very small directories. Look at the left part of the figure and focus on the left edge of the boxes: For seven of the nine teams at least one quarter of all directories contains only one or Technical Report B-07-10, www.plat-forms.org
57
11 Structure
M ●
PHP 8
M
●
PHP 7
●
PHP 6
M M
Perl 5
●
Perl 1
●
M
●
Perl 2
PHP 7
N=24
Perl 2
M ● M
N=69
Java 4
0
N=240
5
10
●
N=12
Perl 1
N=7 M
●
N=9 N=8
● ●
M
N=10
M
N=22
M
●
N=14
0
number of files in a directory
N=4
●
Java 3
15
N=4
M
Perl 5
Java 9
N=13 M
●
PHP 6
N=21 M
●M
N=13
N=23
●
Java 3
N=10
M
●M
Java 4
PHP 8
M
●
Java 9
N=20
5
10
15
number of manual files in a directory
Figure 11.5: Number of files per directory. Each data point represents one directory. LEFT: all files, but not counting subdirectories or the files in those subdirectories. RIGHT: Ditto, but considering the manually written files only (note that this does not only ignore some directories completely, but also some files in directories that are still represented).
two files. Not any single directory contains more than 15 files. However, consistent platform differences are not to be found. Maybe there is an interesting difference in the nesting of the directories?
PHP 8 PHP 7
●
M
M
●
M
●
PHP 6
M
●
Perl 5
M
●
Perl 2 M
Perl 1 Java 9
●
● M
Java 4
●
4
●M
N=10
PHP 7
M
●
N=75
N=13
PHP 6
M
●
N=61
N=12
Perl 5
N=24
Perl 2
6
8
Java 9
N=69
Java 4
N=240
Java 3
10
depth of directory in directory tree
12
N=80
M
●
N=88 M
●
N=83
M
●
Perl 1
N=21
●
M
2
PHP 8
N=23
M
Java 3
N=20
N=92 M
●
N=85 M
●
N=196
M
●
2
4
6
N=1539 8
10
12
depth of file in directory tree
Figure 11.6: Depth of each directory (LEFT) or file (RIGHT) in the directory tree of the team’s source distribution.
Figure 11.6 shows the distribution of the nesting depth of a file or a directory within the directory tree. We first observe that these distributions tend to be rather compact; quite many of the whiskers do not extend beyond the box. Second, when looking at the box widths and the location of the means and medians, we find that once again PHP shows less variability than the other two platforms do. Finally, considering the right box edges, we find that Java tends to clearly deeper directory structures than the other platforms. Figure 11.7 shows the distribution of the total length of the filenames, after stripping off the directory part, but including any separator characters, suffixes, etc. The data show that the Perl teams tend to use rather shorter file names than the others. With 80% confidence, their names are shorter by 3.1 to 3.9 characters compared to Java, and by 3.2 to 4.5 characters compared to PHP. When we consider the manually written files only, the differences are even larger, being 4.6 to 6.5 compared to Java and 4.9 to 7.0 compared to PHP. Only a part of this difference is due to different filetype suffixes for the programming language files, typically “pl” for Perl, “php” for PHP, and “java” for Java.
58
Freie Universität Berlin, Institut für Informatik
11.2 Results
●M
PHP 8
N=80
●
PHP 7 PHP 6
●
Perl 5
●M
Perl 2
M
M
M
● M
●
Perl 1
M
●
Java 9
●
Java 4
●M
Java 3 0
10
N=75
PHP 7
N=61
PHP 6
N=88
Perl 5
N=83
Perl 2
N=92
Perl 1
20
30
length of file name (all files)
N=44 M
●
N=42
M
●
N=17
●M
N=22
M
●
●
N=18
M
N=17 M
Java 9
●
N=42
N=196
Java 4
M
N=54
N=1539
Java 3
●M
N=42
N=85 M
●M
PHP 8
●
0
10
20
30
length of file name (manual files)
Figure 11.7: Length of the individual filenames (in characters, basename without the directory part only). LEFT: all files. RIGHT: manually written files only.
Technical Report B-07-10, www.plat-forms.org
59
12 Modularity
Modularity describes the degree to which a given software system is cut into what appears to be an appropriate number of pieces (such as modules) in what appears to be an appropriate fashion (namely such that the system becomes easy to understand and easy to modify). Some aspects of modularity can the quantified (for instance a number of notions of coupling), but such metrics are partially language-dependent (making them difficult to use in our context) and do not capture the whole of the problem. In our context, one aspect of modularity of particular interest is the nature and granularity of the coupling (specifically: call-based coupling) between the infrastructure (the web development framework and its libraries) and the application itself. In particular, control flow from the infrastructure into the application (inversion of control) tends to be hard to understand and debug, so it may be advantageous if a platform does not produce too many different kinds of such points in a given application. Too-fine coupling granularity within the application may also make it more difficult to understand.
12.1 Data gathering method From the point of view of program understanding, call-based coupling should be defined with respect to the static structure of the call dependencies in the program code. Unfortunately, static analyses of caller-callee relationships can become problematic, if dynamic features of a language are used (say, the method dispatching of object-oriented languages as in all three of our languages, dynamic definition of code as in Perl or PHP, or reflection as in Java). Furthermore, it is difficult to find analysis tools for all three languages that use the same criteria for their analysis. We do therefore resort to dynamic analysis of caller-callee relationships: We apply a runtime profiling tool to log all caller-callee pairs that occur during a number of requests processed by an application, perform an equivalent session with each application, and compare the results. This approach requires the following preparations: • For each platform, find a runtime profiler that captures all calls (rather than only sampling the current one at regular intervals). • Install it into the given environment prepared by a team. • Define the requests to be performed in the model session. • Write a postprocessor for each platform that brings all profilers’ output into a canonical structure and format. • Write a classifier for each solution that decides for each caller or callee whether it is part of the infrastructure (platform) or part of the application (solution). We started our investigation on the Perl platform. We used the Devel::DProf CPAN module as the runtime profiler, the Apache::DProf module for proper embedding into the Apache environment, the dprofpp script for processing the profiler’s raw result data into readable form, and our own script perl-dprofpp-extract.pl for converting the dprofpp output into the canonical form we wanted to have for the evaluation. The classifier for deciding which subroutines were to be considered infrastructure then relied on the existence of a fixed mapping relating the fully qualified subroutine names found in the profile (say, PlatForms::Controller::Style::style) 60
12.2 Results (or lack thereof) to the file names found in the source code distribution (say, PlatForms/lib/PlatForms/Controller/Style.pm) in order to detect subroutine names from the application. For reasons described below, we did not perform a similar analysis for the PHP and Java solutions.
12.2 Results (or lack thereof) The data obtained by the procedure described above exhibited two problems: • The dprofpp profile postprocessor from Devel::DProf produced a large number of warnings of the kind “PlatForms::View::CSS::process has 1 unstacked calls in outer”. Given the constraints in evaluation resources that we had, we were not able to track down what exactly that meant and how much of a data quality problem it represented. We did, however, find it extremely irritating that both positive and negative numbers existed and that some of the numbers given in these warnings were quite large (we had five negative values in the data of team2 Perl and team5 Perl that were in the range -374 to -815 and three positive values in the range 377 to 1497 for the same two teams). This undermined our trust in the validity of the data obtained, in particular given the fact that all three solutions produced many such messages. See also Figure 12.1. • The profile measured for the solution of team5 Perl did not contain even one single call to or from a subroutine identified as part of the application. According to the data, the whole scenario had exclusively exercised the infrastructure, which is certainly untrue, as the application had worked just fine. We asked team5 Perl for help and although the one who answered was (by sheer coincidence) the author of Apache::DProf, even they had no idea what was going wrong.
M
●
Perl 5
N=35
M
●
Perl 2
N=80
M
●
Perl 1
−10
0
N=348 10
number of profiler warnings
Figure 12.1: Distribution of the number N in the Perl dprofpp profile evaluation warnings of the form “subroutineX has N unstacked calls in outer”. 0,2,2 large positive values and 0,1,4 large negative values are cut off for teams 1,2,5.
Together, these two problems prompted us to drop our ambition at characterizing modularity by dynamic call profiles; we did not even attempt a similar analysis for PHP and Java because we felt the data would not be worth the large effort required for obtaining it. Nevertheless even these two-and-a-half profiles allow for some observations: • The granularity of the solution of team1 Perl is much finer than for team2 Perl (and presumably team5 Perl). This is true both dynamically and statically. The dynamic profile of team1 Perl contains some 30 000 entries overall, ten times more than those of the other teams. See also Figure 12.2. In terms of the numbers of unique subroutines, team2 Perl and team5 Perl are quite similar but team1 Perl has nine times as many unique callers (818 overall), six times as many unique callees (1112 overall), eight times as many unique caller/callee pairs (2718 overall), and three times as many unique leafs in the call tree (295 overall). • Looking at the frequency of the four different kinds of caller/callee pairs, we find that calls from platform to platform vastly dominate the overall number in all cases, followed by calls from application to platform, as one would expect when a complex and powerful library is being used. As explained above, we need to ignore team5 Perl for the other three classes. • The number of within-application calls is small in both team1 Perl and team2 Perl. Technical Report B-07-10, www.plat-forms.org
61
12 Modularity
30000 1000 25000 800
pf−>pf pf−>app app−>pf app−>app
15000
count
count
20000
10000
pf−>pf pf−>app app−>pf app−>app
600
400
5000
200
0 Perl 1
Perl 2
Perl 5
Perl 1
Perl 2
Perl 5
Figure 12.2: Number of calls between subroutines of the two kinds ‘belongs to the platform’ (pf) and ‘belongs to the application’ (app). The data for team5 Perl is incomplete. For instance pf->app means that a platform subroutine calls an application subroutine. LEFT: Overall number of calls. RIGHT: Same plot, but showing only the region up to 1200.
• The hallmark of frameworks, namely calls that involve inversion of control and go from platform to application, however, are surprisingly rare for team2 Perl (11 overall, that is only 5% as many as the other way round) and much larger (more like what one might expect) for team1 Perl. • The much finer granularity of team1 Perl’s solution is found again when looking at the depth of the calls in the call tree (see Figure 12.3): the mode (most common depth) is at about 2 for team2 Perl and 5 for team1 Perl. The deepest 10% of all calls are at level 8 or more for team2 Perl and at level 29 or more for team1 Perl.
●
Perl 5
N=814
●
Perl 2
N=2066
●
Perl 1
0
N=30333 10
20
30
depth of call in call tree
40
50
Figure 12.3: Frequency of different depths of calls in the call tree. The data for team5 Perl is incomplete, hence the values shown may be too low.
Summing up, there are big differences among the solutions even within this first platform, which makes it still more unlikely to find meaningful differences across platforms, thus further confirming our position not to pursue this analysis further.
62
Freie Universität Berlin, Institut für Informatik
13 Maintainability
One of the most important quality attributes of software products that are meant to be used and evolved for a long time is their maintainability: The ease (and lack of risk) with which one can perform the corrections (to remove defects), adaptions (to compensate for changes in the environment) and modifications (to accommodate changing requirements, in particular additional ones) that will be required over time. There are many different ways to decompose maintainability into smaller aspects. A coarse one, which we will use here, may split maintainability into just two components: • understandability: characterized by the effort for understanding the software in its current form; • modifiability: characterized by the effort for designing, performing, and testing a change.
13.1 Data gathering method 13.1.1 Understandability
It appears there are two potential ways how to evaluate understandability: by judgement or by experiment. Evaluation by judgement would mean developing criteria from which one can grade understandability in a somewhat objective, reproducible fashion. While such criteria are conceivable for a fixed language, platform, and design style, we cannot imagine what they should look like to work for solutions as diverse as the ones we have in Plat_Forms. Evaluation by experiment would mean taking a large number of programmers sufficiently knowledgable about all three platforms, assigning them to the solutions at random (thus controlling for their different capabilities), giving them all the same set of program understanding tasks, and measuring the average effort and quality of their answers. Since the variability of programmer performance is known to be quite large [14], one would need perhaps a dozen of programmers for each solution before one can expect to see the understandability differences, if they exist, clearly. Learning effects would distort the results if a programmer worked on understanding more than one solution, so each person can work on only one; and we are talking about needing more than 100 programmers, each one skilled in Java and PHP and Perl. This kind of effort is beyond our reach. Summing up, evaluating understandability in a valid manner appears infeasible for us, so we drop the ambition entirely and leave the question of understandability-related platform differences unanswered. Sorry. 13.1.2 Modifiability
For modifiability, the situation is only a little easier. A general, quantitative assessment of modifiability would be just as difficult as for understandability. However, if we consider a small number of fixed modification scenarios only, we can simply describe (in textual form) the changes needed and thus give the reader sufficient room for his or her own judgement. We define the scenarios first (see below) and then use a procedure with two reviewers per solution. Each one will first develop an understanding of how to make each change and write down some notes, then write a concise description, and finally discuss the description with the other reviewer (who prepared himself in the same way). 63
13 Maintainability If the two found different ways of making the change, the simpler, “better” way will make it into the unified description. The description reports what changes are required in which files. We then asked each team to nominate a member for reviewing the description, in case we had overlooked or misrepresented something. If this reviewer requested changes, we validated and incorporated them into the description. Teams 1, 2, 3, 5, 6, 7, 8 participated in this procedure, while team4 Java and team9 Java did not. Over the 14 feedbacks received, the teams reported only 3 real mistakes in our draft descriptions (two changes we missed plus one combination of a missed and a superfluous one), plus a number of suggestions for cosmetic changes. Note that we will only design the changes, not actually implement and test them, because the heterogeneous infrastructure and configuration of the solution systems makes the latter prohibitively difficult. These are the scenarios investigated: 1. Add another text field in the registration for representing the user’s middle initial and handle this data throughout the user data model. What changes are required to the GUI form, program logic, user data structure, database? 2. Add an additional item to the TTT (1 question, 2 answers with dimension codes): What changes are required to add the question to the set of questions and to make sure the presentation as well as the computation of the TTT result remains valid? 3. Add the capability to separately store any number of email addresses for one user: What changes are required to adapt the registration form and member status page GUI (for input we will use a simple text area, 1 text line per email address), to show all addresses as a tabular list on the member status page, to show the first of these addresses on the member list page, to extend the logic for processing all of these, to modify the user data structure, and to modify the database schema and database access? When we delved into the solutions, it quickly became clear that the third scenario was infeasible for us to be described in solid quality. Since there was no role model of such a 1:n relationship anywhere in the data model for the default requirements, the depth of understanding of each individual framework required for designing an appropriate solution was far beyond what we could muster in the given time frame. We therefore, with a sigh, decided to drop scenario 3 and only investigate the other two. We assume that the modifications are made at development time and do not consider how to make changes during production (that is, including database migration, possibly even at run time).
13.2 Results We will provide a short, textual description of the changes needed separately for each team, first for scenario 1 (introducing a middle initial field), then for scenario 2 (adding an item to the TTT).
13.2.1 Modifiability scenario 1 (middle initial)
Team3 Java: The Member.java data class contains a fullname property only and thus needs no change. Consequently, the database schema also remains constant. Access via firstname and lastname is implemented by splitting and merging in the GUI class UserModel.java. This construction is unnecessarily complicated and highly unreliable; it becomes even more fragile upon the introduction of the middleInitial field. Add the new field to the templates userdata.jsp and userdetails.jsp. Add label to User_en.properties (supports internationalization). Team4 Java: This solution includes infrastructure for automated tests, increasing the number of modifications required. Add middleInitial field (plus getter and setter) to User.java data class and handle it in methods 64
Freie Universität Berlin, Institut für Informatik
13.2 Results hashCode, toString, and equals. Make similar changes again in UserTest.java. Add a column to the database. Add object-relational mapping for middleInitial in orm.xml. Add input field in firstStep.jsp. Team9 Java: Add middleInitial field and getter/setter to User.java and getter/setter to its interface IUser.java. Add setMiddleInitial with string trimming logic in RegistrationDialog.java and call user.setMiddleInitial there. Include middleInitial where fullname is shown in private class TreeLabelProvider in file ViewContact.java and again in another such private class in ViewSearch.java. Add a middleInitial table header and TableColumn object in ViewSearch.java. Add middleInitial field to ViewStatus.java and make a large number of small changes to the layout logic there. Team1 Perl: Add database column in PbT.sql. Add middleInitial in altogether four places in the template files register.tt2, home.tt2, and list.tt2. Team2 Perl: Add middleInitial column to database. Add middleInitial to model attributes in DB/Users.pm (or call s2c.pl to do it automatically) and modify the name method in that file. Add it to the list in procedure User_Register in WebApp/User.pm and to the form in template register.html. Add form label to database table lexicon. Team5 Perl: Add middleInitial field to the pbt.bigtop file, which specifies data declarations and database mappings and generates all of the necessary infrastructure files. Simple changes are required in the templates home.tt, home_edit.tt, and main.tt. Team6 PHP: Add middleInitial database column in database.sql. Add a field in pfCore.php and handle it in procedure _convertUserToMemberInfo. Add a call to unset for middleInitial in a conditional in order to hide member details for strangers. Add UTF-8 conversion call in submitMemberinfo in file soap/index.php. Add part definition for middleInitial and add it to submitMemberInfo in PbT.wsdl. Add html table header and variable access to inc_searchlist.tpl. Add middleInitial to printing of fullname in templates inc_user.tpl, index.tpl, status.tpl, and user.tpl. The latter is used for both registration and later editing.
Team7 PHP: Add middleInitial database column in class_db_nurse.inc.php and at two spots in class_model_register.inc.php. Set local attribute of userdata array in class_memberinfo.inc.php. Set array value in function submitMemberInfo in class_pbt_webservice.inc.php. Add middleInitial object to a form object in class_view_register.inc.php. Add field to templates memberlist.tpl, sendedrcd.tpl, and _metanavi.tpl; add it in two spots in statuspage.tpl. Team8 PHP: Add a database column. Add attribute to user object in UserModel.php. Add attribute in files User.php, Register.php, and Search.php. Add field in template register.phtml. Concatenate middleInitial into fullname in Web.php. Add a field in soap.php. Summing up, the number of changes are smallest in the Perl solutions; for team1 Perl and team5 Perl they are also very straightforward. Also, some of the change spots appear to be more difficult to find in the Java and PHP cases. The nature of the changes is quite unique for each of the Java solutions. 13.2.2 Modifiability scenario 2 (add TTT item)
For understanding this scenario, one should know that the original 40 questions of the TTT were specified as a structured, easy-to-parse text file. Each item consisted of three lines (followed by one empty line). For instance question 4 looks as follows: A small project J:should be planned as well as a big one P:allows to jump right in The first line is the question, lines two and three contain the two answering possibilities, each preceeded by the code representing the result of the question to be counted for the overall test. Refer to the screenshots in Appendix C.2 to see how this is presented to the user. Team3 Java: Add the question and answers as three entries to TttQuestion_en.properties. ttt-test.jsp contains a tag that lists each question number (“1,2,3,4,” etc.); add 41 to this list. Modify upper limit of loop to 42 in TttQuestionController.java. Technical Report B-07-10, www.plat-forms.org
65
13 Maintainability Team4 Java: Add the new question, its answers, and its answer codes to ttt-questions.properties, giving 5 new properties overall. However, the property file appears to be generated automatically at build time from the original text file. Modify the upper limit of a loop in Answers.java from 40 to 41. Ditto in AnswerAction.java. Team9 Java: Add the question to the original question file ttt-questions.txt. (Note that team9 Java’s solution does not actually compute any TTT results.) Team1 Perl: Add the question to the original question file ttt-questions.txt. Team2 Perl: Questions are stored in the database, but neither the source file ttt-questions.txt nor the conversion script used by the team is part of the source distribution. This is presumably just a mistake in the packaging of the source distribution, but it means that one has to add the additional question to the db manually. This is not trivial since it involves adding connected values to two tables. No further changes are required, unless one adds too many questions, because a fixed number of chunks pages is used for presenting the questions to the user. Team5 Perl: Add the question to the original question file ttt-questions.txt. Team6 PHP: Add new question and its answers as a dictionary entry inside an array in TttController.php and change 40 to 41 in _boundingCheck function (which appears to be redundant). Team7 PHP: Add the question to the original question file ttt-questions.txt. Team8 PHP: Add the question to the original question file ttt-questions.txt. With respect to team5 Perl, it should be mentioned that not only is the build-time change as simple as it can be, their solution even provides a Web GUI that allows editing the set of existing questions and answers at run-time! One can not only add questions, but also change their wording, answer classification, and question ordering. During the morning of day 1 of the contest, Team1 Perl, team3 Java, and team4 Java queried the customer whether they should allow for modification of the TTT questions at run time and received a “No, thanks.” answer. Summing up, we find that both of the “conventional” Java solutions (disregarding the very different team9 Java) use heavyweight approaches that provide full internationalization support but make adding a question to the TTT difficult and error-prone. In contrast, two thirds of the Perl and PHP solutions take a rather pragmatic approach and directly interpret the given structured text-file instead, which makes internationalization a little less straightforward (one would need to add a text-file-selecting dispatcher), but provides the simplest extension procedure conceivable. Internationalization was not asked for in the requirements document, so we prefer the approach implemented by team1 Perl , team5 Perl , team7 PHP , and team8 PHP . Team9 Java took the same approach, but did not follow it through.
66
Freie Universität Berlin, Institut für Informatik
14 Participants’ platform experience
14.1 Data gathering method As part of the postmortem questionnaire (see Appendix A), we asked each participant what they thought were the biggest advantages and disadvantages of their platform compared to others for the given task and also which aspects they considered most difficult about the task as such. The answers were requested as bullet list text. The questions were phrased as follows: • 7. I think the following 2 to 5 aspects of PbT were the most difficult ones (list each aspect and describe in one sentence why) • 8. I suspect the following 2 to 5 aspects of PbT were those where my platform provided the biggest competitive advantage compared to other platforms, as far as I know (list each aspect and describe in one sentence why) • 9. I think the following 2 to 5 aspects of PbT were those where my platform provided the weakest support (list each aspect and indicate what was missing) We also asked for a post-hoc guess what they would have estimated beforehands (after reviewing the requirements document) would be the effort required for the task. We use these two sources of information to try to characterize how the participants perceived their platform with respect to the given task. For the effort estimate, we present two quantitative graphical summaries. For the questionnaire answers, we somewhat abstract from the individual answers (because hardly any two of them are ever identical) in order to form semantic categories and present those, grouped by platform and indicating how many answers from which teams refered to this item (possibly more than one per person if the answers were narrower than the item). Some answers were counted in more than one category. The categorization, and assignment was performed by one reviewer (prechelt) only and the categories are not always perfectly delineated against one another (in particular for the advantages question), so the results should be considered somewhat fuzzy. Please refer to the raw answers as printed in Appendix B if necessary.
14.2 Results 14.2.1 Most difficult aspects of the task
Java (the numbers before each item indicate the number of mentions by members of Java team 3, 4, or 9, respectively): • (1, 3, 2): The graphical plot required in member lists, because of lack of knowledge or lack of support. • (1, 1, 2): The webservice interface, because of the complexity of the environment, time pressure, or lack of experience. • (2, 1, 0): The complex search capabilities, because of difficult expressions for likes/dislikes, GPS coordinates. • (1, 0, 1): Performance requirements, because they would require performance testing. • (1, 0, 0): Coping with the time pressure, because the requirements were too large. 67
14 Participants’ platform experience Perl (the numbers before each item indicate the number of mentions by members of Perl team 1, 2, or 5, respectively): • (3, 3, 3): The webservice interface, because of the complexity of SOAP and in particular WSDL handling. One member of team5 Perl remarked: “We should have given up on this aspect of the task instead of dedicating 1/3 of our effort on it.” • (3, 2, 1): The complex search capabilities, because they required more manual database programming and more refined database knowledge than common. • (1, 0, 2): Coping with the time pressure regarding setting the right priorities and “managing fatigue”. • (1, 1, 0): The graphical plot required in member lists. PHP (the numbers before each item indicate the number of mentions by members of PHP team 6, 7, or 8, respectively): • (3, 3, 3): The complex search capabilities, because the efficiency requirements were hard to meet and querying by GPS coordinate difference was difficult. • (3, 4, 2): Performance requirements, because they were just very hard. • (1, 2, 2): Coping with the time pressure regarding planning, hectical work patterns, difficult performance optimization, and the declining speed of development. • (0, 1, 1): The graphical plot required in member lists, because they were difficult with large numbers of points and some requirements were not solved in the libraries. • (0, 0, 2): The webservice interface, because someone had implemented some functionality in the wrong place in the remaining application and someone had never before returned an image in a SOAP reply. • (1, 0, 0): Security. One member of team6 PHP remarked: “We could fully hack all other teams’ applications”. Summing up, teams from all platforms agree that the search was difficult. The Perl teams are almost frustrated with the webservice requirements. The PHP teams show by far the most concern with the performance requirements and report the fewest problems with the webservice. 14.2.2 Competitive advantages of my platform
Java (the numbers before each item indicate the number of mentions by members of Java team 3, 4, or 9, respectively): • (4, 1, 2): Good support for standard tasks such as templating, form data handling, validation, results chunking, and page flow. • (4, 1, 0): Good set of reusable libraries and components. • (0, 2, 3): Powerful, sound, extensible architecture. • (2, 1, 0): Good support for webservices. • (0, 1, 1): Flexibility and expressiveness of the language. • (0, 1, 0): High scalability. • (0, 1, 0): Good database support by object-relational mapping. • (0, 0, 1): Fast and well-supported development cycle regarding IDE tools. Perl (the numbers before each item indicate the number of mentions by members of Perl team 1, 2, or 5, respectively): • (3, 3, 3): Good database support such as automated persistence, object-relational mapping, yet flexible database access. • (2, 5, 0): Good support for standard tasks such as templating, form data handling, validation. 68
Freie Universität Berlin, Institut für Informatik
14.2 Results • (3, 1, 0): Good set of reusable libraries and components. • (1, 0, 2): Fast and well-supported development cycle regarding language framework, tools, and environment. • (1, 0, 2): Flexibility and expressiveness of the language. • (0, 1, 2): Powerful, sound, extensible architecture. PHP (the numbers before each item indicate the number of mentions by members of PHP team 6, 7, or 8, respectively): • (2, 3, 3): Fast and well-supported development cycle regarding language framework, tools, and environment. Two members of team7 PHP mentioned they had worked “almost from scratch” (and thus “were completely open”) and that they could use “possibly time-saving workarounds by using unclean ways of programming (using global variables etc.)”. One member of team6 PHP formulated the latter aspect as “php provides a possibility to choose the implementation strategy: quick and dirty OR structured and clean”. One member of team8 PHP called an advantage “Rapid Prototyping (you can just start writing your application)” and another mentioned “no configuration in separate config-file needed.”. • (1, 2, 2): Good support for standard tasks such as templating, form data handling, validation, results chunking, and page flow. • (3, 0, 1): Flexibility and expressiveness of the language. Team6 PHP: “PHP is more flexible [than] others”, “it is very easy to extend php”. • (1, 0, 2): Good support for webservices. Team6 PHP: “...at least compared to Perl”, • (0, 1, 1): Good set of reusable libraries and components. • (1, 0, 1): Powerful, sound, extensible architecture, regarding extensibility of PHP base functionality and the model-view-controller structure. The actual lists of answers read amazingly different from one platform to another. It is obvious, however, that for this question an answer that is rare or missing for some specfic platform or team does not indicate the absence of a corresponding strength.1 Rather, it presumably just indicates a mindset with a different focus. It is quite interesting that the teams of different platforms are most proud of rather different things: good support for standard tasks (Java), database support (Perl), or the overall development style (PHP). It is unclear, however, how to summarize these findings.
14.2.3 Disadvantages of my platform
Unsurprisingly, the answers to this question overlap a lot with those regarding the most difficult aspect of the task. The categories, however, were chosen to match with those used for categorizing the advantages. Java (the numbers before each item indicate the number of mentions by members of Java team 3, 4, or 9, respectively): • (0, 0, 4): Incomplete support for standard tasks. Team9 Java: The RAP framework is still under heavy development and is somewhat incomplete and immature. • (1, 1, 0): Cumbersome development cycle. Team3 Java: Fixed URLs /soap and /wsdl required additional work. Team4 Java: long compile and deployment cycles. • (1, 0, 1): Less-than-optimal support for webservices. Team3 Java: No built-in support for session handling with timeout. Team9 Java: “RAP is geared towards the UI, there are no built-in facilities for web services. Due to the underlying technology, registering additional servlets might still introduce some problems, especially when they need access to session management.” 1 In
particular, since the answers of some teams were more wordy than others, which tended to produce more hits to the semantic categories.
Technical Report B-07-10, www.plat-forms.org
69
14 Participants’ platform experience • (0, 1, 0): Architectural issues. Team4 Java: “higher complexity due to high scalability, reusability and maintainability”. • (1, 0, 0): Database issues. Team3 Java: Hibernate ORM tool got in the way for member search. • (0, 0, 1): Performance issues. Team9 Java: Long startup time (but quick response times afterwards). Perl (the numbers before each item indicate the number of mentions by members of Perl team 1, 2, or 5, respectively): • (3, 4, 3): Less-than-optimal support for webservices. Team1 Perl: missing WSDL support, Perl is more geared towards REST or XMLRPC. One member of team2 Perl mentioned “SOAP is ok, but WSDL is bad.” • (1, 0, 0): Database issues. Team1 Perl: No support for subqueries or MATCH AGAINST. PHP (the numbers before each item indicate the number of mentions by members of PHP team 6, 7, or 8, respectively): • (1, 1, 1): Security issues. Team6 PHP: “many beginner programmers who are not fully aware of security solutions use php”. Team7 PHP: “Allows dirty implementation / possibile security issues”. Team8 PHP: “I know that there are XSS problems, but the next version of our template engine – a part of our internal Framework distribution – will fix that by escaping all strings by default” • (0, 1, 1): Incomplete support for standard tasks. Team7 PHP: “better standard modules like filters for input parameters, etc. could be possible”. Team8 PHP: no standard look-and-feel; “HTML-Form-Abstraction — Only semi-automatic Value/Type checking”. • (2, 0, 0): Language issues. Team6 PHP: “Multibyte support, will be changed with php6”, “object overloading is missing, [and also] real references (pointer)”. • (0, 0, 2): Database issues. Team8 PHP: “No support in the DB nor in the Framework for GIS”, “ORM — Too much Handcoding needed”. • (0, 1, 1): Performance issues. Team7 PHP: “decreasing performance of MySQL when number of members exceeds about 100 000”. Team8 PHP: “a C++ program could have been faster ;)”. • (0, 1, 0): Less-than-optimal support for webservices. Team7 PHP: “WSDL2PHP is missing”. • (0, 1, 0): Less-than-optimal libraries or components. Team7 PHP: no diagram library in our framework One member of team6 PHP wrote “I don’t believe that there is anything in this project where [any] other language could have done better”. Summing up, all teams appear to be quite happy with their platforms with just two exceptions: All three Perl teams suffered from non-existing WSDL support and team9 Java was plagued, as expected, by the general unfinishedness of their RAP framework. 14.2.4 Post-hoc effort estimate
The results of the participants’ effort estimate are shown in Figure 14.1. For the interpretation, one should be aware that we asked for the estimate at a time when the participants had already worked on the task and hence knew much more about its difficulties than during a normal project estimate. While the estimates for the implementation of only the essential requirements are not very different (though somewhat larger for the Java platform), the estimates for a full project (including proper webdesign, implementation of also the MAY requirements, and a quality assurance phase) differ quite a bit: The Java participants estimate a much higher effort, the median being larger by about 50% compared to Perl or PHP. This difference stems from larger estimates for each of the four estimation components, in particular the quality assurance effort. The difference of the means is even statistically significant between Java and Perl (p = 0.005), the Java estimates being larger by 9 to 21 days (with 80% confidence). 70
Freie Universität Berlin, Institut für Informatik
14.2 Results
PHP Perl Java
M
7 7 6 8 ● 7 8
6
M
222 55 1 1 51 ●
Perl
M
4
9 3 4 943● 10
PHP
3
9
20
30
Java
M
6 78 7 8● 8 67
6
M
5 1 151●
2 25 2 M
3● 44 9
4 20
3 3 40
9 60
estEffortProgramming estEffort (webdesign+allprog+QA) Figure 14.1: Each participant’s post-hoc estimate for the effort (in person days) needed for a full professional implementation of PbT. LEFT: Design and implementation of MUST and SHOULD requirements only. RIGHT: Overall (including also webdesign, MAY requirements, and quality assurance).
Technical Report B-07-10, www.plat-forms.org
71
15 Validity considerations
An empirical investigation like the present one should primarily aim for two qualities: Credibility and relevance [12]. Credibility means that the readers, even critical ones, will be willing to believe the results reported are true and real in the sense that they have been caused by the factor under consideration only (here: differences innate in the platforms) and not by additional ones that disturb the results. Relevance means that the results inform the readers about things they care about, that are relevant to what they are trying to do or to understand, rather than things of merely academic interest, if any. This section discusses what might be wrong with the credibility and the relevance of the present study.
15.1 Threats to credibility Most potential problems with credibility come under the heading of what scientists call “internal validity”: Given the task as performed, do observed differences really come from platform differences or are there other, “uncontrolled” sources of variation? Here are the most important threats to internal validity in the present quasi-experiment: • Teams’ platform selection bias: The teams were not assigned to the platforms at random, as would be required for a true controlled experiment; we have a quasi-experiment with self-selected assignment of teams to platforms only, so it may be that more competent teams tend to prefer certain platforms and that this has influenced the results. For the given study, this is actually not a threat to credibility at all: For practical purposes, if there is a trend that better teams prefer certain platforms, then this should be considered a positive aspect of those platforms. • Team selection bias: The teams of different platforms may not be equally representative of typical teams on those platforms. If we have platform A teams all from the top 5% of the world’s platform A teams, but platform B teams all from the lower half of the world’s platform B teams, this would certainly be a problem. While we do not have achieved the ambition to have only top-5% teams, it appears that with two exceptions, the teams were sufficiently even to allow for a useful comparison of their platforms. The two exceptions are team4 Java and team9 Java, whose characteristics are discussed in a number of places elsewhere in this document. • Different amounts of external help: 1. It would theoretically be possible that some teams have received substantial amounts of unobserved help from the outside (say, two more colleagues working on some pieces remotely and sending in contributions via email). 2. Less importantly, helpful feedback openly provided by volunteers in the Live Contest Blog about the prototype solutions may have been more available for some teams than for others. For all we know, we believe that effect 1 has not happened and effect 2 is negligible. • Data gathering bias: Many of our data collection procedures, as described in the first subsection of each results subsection, involve manual steps and are hence prone to errors, even data collected automatically can be erroneous if the collection tool does not work perfectly. Unless such data errors occur on a 72
15.2 Threats to relevance massive scale, they tend to be unproblematic as long as they are randomly distributed over the various teams and platforms. However, if they cluster on a certain team or platform, they may produce a bias in the results. We certainly expect to have a number of errors in our data, but due to the care we have taken in compiling it, we also expect that these errors are fairly distributed over the teams and acceptably rare. We are reasonably confident that the quality of our data is adequate for the relatively coarse comparisons and discussions that we make. We do not recommend using it for highly detailed analyses. • Data evaluation errors: Finally, it is conceivable that we have made clerical mistakes during the data tagging and evaluation, such as confusing results of platforms A with those of B, etc. As we have worked very carefully and in a highly structured way, including quite a number of redundancy checks, we are confident that his is not an issue. Beyond these threats to internal validity, there are other threats to the credibility of the study: • Task bias: Some aspects of the task posed may be considered to be biased in favor of one platform or against another. The only instance of this we know about is the Webservice requirements: Members of team1 Perl and team5 Perl complained that SOAP was considered rather un-Perl-ish (“We do SOAP only at gunpoint.”). Whether one wants to consider this to damage the credibility of the comparison is a matter of standpoint. If you consider choosing SOAP (as opposed to some other http-based RPC mechanism) to be an implementation detail, then prescribing SOAP is certainly a bias against platforms with weak SOAP support (such as Perl) and in favor of platforms with strong SOAP support (such as Java). On the other hand, if you consider WSDL and SOAP to be the most widely interoperable mechanism for general future unplanned systems integration (and hence a possibly essential feature of an application), the respective requirements are quite normal and platforms with weaker SOAP support are just correspondingly weaker platforms. • Bad luck: There may have been events that have influenced the results substantially but that a reader may not want to consider as originating from relevant platform characteristics and would therefore rather not see reflected in the results. For instance one member of team8 PHP was ill on day 1 of the contest, a member of team5 Perl mentioned in his postmortem questionnaire that they had intermittent server configuration difficulties, etc. We cannot know about all instances of such potentially excusable problems and cannot do anything but ignore them all. We do not believe they make a substantial difference. Summing up, Plat_Forms is by no means a perfect study, but we believe that we were sufficiently careful in its analysis and in particular in the drawing of conclusions that the results are highly credible. The price to pay is that we have fewer and less spectacular results than many would have liked.
15.2 Threats to relevance Besides the question whether the results are credible as they stand, there is the question whether you care about them: Does the study reflect something you would expect to encounter in the real world as well? Put differently: Do the results really matter? There are three primary threats to the results’ relevance: • Uncommon requirements specification: The requirements specification process was much cleaner and neater in the contest than it is in most real projects: (1) The requirements specification prescribed hardly anything with respect to the visual and interaction style of the user interface. (2) Other than that, the requirements specification was unusually clear and unambiguous. (3) When it was necessary to query the “customer” for resolving remaining issues, that customer always spoke with a single voice of complete authority and was instantly available at almost any time. It is conceivable that differences between platforms may come out differently if the requirements process is scruffier, but we do not believe it to make a big difference to the differences. Technical Report B-07-10, www.plat-forms.org
73
15 Validity considerations • Unnatural work conditions: While the contest attempted to reflect a project format (work in a team, fixed deadline), the highly compressed time frame of the project was unusual. In particular, the 30-hour format may lure participants into overtaxing their resources during the night and then having their final work suffer the second day. Several teams indicated they performed less testing and less refactoring than they usually would. Whether these factors influence the differences seen between platforms, we cannot say. • Small project size: Even if the task given to the participants was mighty large for a 30-hour slot, it was still small compared to most professional web application development projects. This puts platforms that excel in controlling larger amounts of complexity at a disadvantage and probably represents the biggest weakness of the study overall: We simply cannot evaluate the common claim of the Java community that large-scale Java development is easier to control than large-scale development in a dynamic language. • Specific task characteristic: While the task posed is somewhat representative of a fairly large class of web applications (namely community websites), it can obviously not represent everything and we simply do not know what different platform differences might be present for entirely different kinds of application. There is nothing that the study (or in fact any study) can do about this. However, even within the class of community web applications, there are certain common requirements that were missing from our task. For instance upon registration it was neither required to validate the email address by having the user click a registration confirmation link sent via email nor was it required to validate the intelligence of the agent performing the registration via a Captcha or similar mechanism. This denies platforms with particularly good support for such features the recognition of that advantage. Summing up, we believe the comparison results from Plat_Forms to be relevant for most small-scale and midscale web development projects whose requirements are at least roughly similar to those of the PbT task. We cannot judge the relevance for large-scale projects.
74
Freie Universität Berlin, Institut für Informatik
16 Summary of results
One is easily overwhelmed by the mass of individual results and observations discussed above. So what is the best platform after all? We firmly believe that there is no such thing as the one best platform. When designing a platform, a great number of parameters needs to be traded off against one another and compromises have to be made. At the same time, each platform is driven by highly talented and devoted designers and protagonists. Therefore, different platforms will always exhibit different strengths and weaknesses. It is the purpose of Plat_Forms to locate and describe such platform characteristics and so the first subsection will collect and summarize the platform difference items that were marked in red in the previous sections. But Plat_Forms was also a contest and so the second subsection will collect and summarize the within-platform team difference items that were marked in green in the previous sections and nominate a Plat_Forms 2007 winner team for each platform.
16.1 Differences between platforms 16.1.1 Java-centric differences
• Java was the only platform for which all three solutions handle HTML tags in text field input so as to avoid client-side cross-site-scripting (XSS) security issues (see Section 7). • The amount of functionality implemented by the Java teams is much less uniform than for the others (see Figures 4.4 and 4.5). Also, the nature of the changes required for adding a user profile data field into the application was more dissimilar among the Java solutions than among the solutions of the other platforms (see Section 13.2.1). • Java team members were less often observed to perform activities of type ‘talking’ than were Perl team members (see Figure 5.6). • The design approach chosen for representing the content of the TTT questionnaire in the application tended to be more heavyweight in the Java solutions than in the others (see Section 13.2.2). Also, the directory structure of the Java solutions is more deeply nested overall than the others (see Figure 11.6). • The post-hoc effort estimate for a full professional implementation of the given requirements was higher with the Java teams than with the others, in particular the Perl teams (see Figure 14.1). • A manually written (as opposed to reused) file tended to be checked-in fewer times in a Java project than in a Perl and in particular a PHP project (see Figure 5.18 and also the ones before and the discussion about them). 16.1.2 Perl-centric differences
• The Perl solutions are smaller than the Java and the PHP solutions (see Figure 10.7) and the filenames used are shorter (see Figure 11.7). 75
16 Summary of results • The number of changes required for adding a user profile data field into the application was smallest for Perl (see Section 13.2.1). • Only the Perl solutions are consistent in not having any substantial implementation of the webservice requirements (see Figure 4.6). In the postmortem questionnaire, the Perl teams also reported the highest level of frustration with the webservice requirements (due to lack of WSDL support for Perl, see Sections 14.2.1 and 14.2.3). • The Perl teams created new files at a more constant pace than the other teams (see Figure 5.19). • Perl was the only platform for which all three solutions’ SQL handling did not resist even a simple form of manipulated HTTP requests (see Figure 7.1). 16.1.3 PHP-centric differences
• The amount of functionality implemented by the PHP teams is larger than that of the Perl teams (see Figure 4.4). • The amount of functionality implemented by the three different PHP teams is more uniform than it is for the other platforms (see Figures 4.4 and 4.5). • A similar statement holds for several other criteria as well: The PHP teams are more similar to one another in those respects than are the teams from the other platforms. See for instance the fraction of implementations that have low quality from the user’s point of view (Figure 6.1), the size and composition of the source distribution (visible in Figures 10.3 to 10.6, regarding various subsets and views), the number of lines of code required on average for implementing one of the requirements (Figure 10.8), or the depth of the solutions’ directory structure (see Figure 11.6). • PHP was the only platform for which all three solutions’ SQL handling properly resisted our manipulated HTTP requests (see Figure 7.1). • PHP was the only platform for which all three solutions performed sufficient validation of email address input during registration and for which all three solutions could fully handle international characters (see Figure 7.1). • In contrast to all of the Java and Perl teams, we found almost no automatically generated files in the PHP teams’ source distributions (see Figure 10.3). • According to the answers in the postmortem questionnaires, the PHP teams have apparently spent more attention and effort on the scalability requirements than the other teams (see Section 14.2.1).
16.2 Winning team within each platform 16.2.1 Java
Team3 Java produced by far the most complete solution on the UI level (see Figure 4.4). It is the only Java team to realize webservice requirements at all (see Figure 4.6) and to realize search to a substantial degree (see Figure 4.5). Its solution is the most compact relative to its functionality (see Figure 10.8). The application has weaknesses when handling international character inputs or manipulated HTTP requests (see Section 7, in particular Figure 7.1). Team4 Java is the only one that wrote a pure documentation file (see Figure 10.7), but the solution is very incomplete (see Figure 4.5). 76
Freie Universität Berlin, Institut für Informatik
16.3 What about the non-winners? Team9 Java has always avoided modifying a reused file (see Figure 10.3) and has the highest density of comments in their source code (see Figure 11.3), but only basic functionality is present (see Figure 4.5). The winner for Java is clearly team3 Java.
16.2.2 Perl
Team1 Perl is the only Perl team to realize a substantial subset of the search functionality (see Figure 4.5). It has always avoided modifying a reused file (see Figure 10.3) and allows a very straightforward solution for both modification scenarios (see Section 13.2), but has the largest number of defects (see Figure 8.1, note the discussion). The solution’s source code is very compact (see Figure 10.8). Team2 Perl has the smallest number of defects (see Figure 8.1), the solution’s source code is very compact (see Figure 10.8), and they are the only Perl team checking email address validity (see Figure 7.1). On the other hand, they are also the only Perl team with no webservice implementation whatsoever (see Figure 4.6), the only one to fail with very long inputs (see Section 7, in particular Figure 7.1), and the only one not to handle international characters successfully (ditto). Team5 Perl allows a very straightforward solution for both modification scenarios (see Section 13.2), but has implemented fewer of the UI requirements than the other two (see Figure 4.4) and is the only Perl team highly susceptible to client-side cross-site-scripting (see Section 7, in particular Figure 7.1) and the only one to fail when cookies are turned off in the browser (ditto). It is not obvious who should be the winner here, but for the reasons discussed in Section 8, we feel that team1’s larger number of defects weighs less heavily than the robustness problems exposed for team2 Perl and team5 Perl. We do therefore declare team1 Perl the winner on the Perl platform for its comparative lack of weaknesses.
16.2.3 PHP
Team6 PHP is the only PHP team to realize a substantial subset of the search functionality (see Figure 4.5). It has provided the most accurate preview release time estimate (see Table 5.1). Its solution has the best ease-ofuse results (see Figure 6.1), the highest density of comments in the source code (see Figure 11.3), is the most compact relative to its functionality (see Figure 10.8), and — most importantly — it is the only one across all platforms to pass all robustness checks without failure (see Figure 7.1). Team7 PHP has superior coverage of the webservice requirements (see Figure 4.6) and allows the simplest possible solution for modification scenario 2 (see Section 13.2.2). On the other hand, their solution is vulnerable to client-side cross-site-scripting (see Section 7). Team8 PHP exhibits the most cooperative/communicative working style (see Figure 5.8), has the smallest number of defects (see Figure 8.1), and allows the simplest possible solution for modification scenario 2 (see Section 13.2.2). On the other hand, their solution is vulnerable to client-side cross-site-scripting (see Section 7). Given the severity of the security issues with team7 PHP and team8 PHP, we declare team6 PHP the winner for the PHP platform.
16.3 What about the non-winners? So one team on each platform was best. What about the others? It should be obvious from the above that the difference in performance of the Perl teams and even more so of the PHP teams was small. It is largely a matter of priorities which team to elect as the platform winner. All of them did an excellent job. What about Java? Technical Report B-07-10, www.plat-forms.org
77
16 Summary of results We have discussed the special situation of team9 Java several times: They participated in the contest only reluctantly (and only because we pressed them because all our other Java candidates had withdrawn), because (a) they felt that the Eclipse UI model supported by their framework RAP might not be well suited to the task they would have to solve in the contest, and (b) they knew that RAP was still quite immature. By the time of the contest in January 2007, RAP had not even seen its first beta relase (“Milestone release” in Eclipse lingo); Version 1.0 is scheduled to appear only in September 2007. That leaves only team4 Java. There are two reasons why the amount of functionality in their solution was so much lower than for the other teams. First, the VMware server installation the team had brought to the contest turned out not to work correctly and they struggled with that for almost a full day before they could finally get it up and running satisfactorily. This meant an enormous loss of contest time that could not be made up later. Second, most other teams used a development style somewhere in the middle between productionquality development on the one hand and rapid prototyping on the other. In contrast, team4 Java’s development style was heavily inclined towards full production-quality development, with an up-front design phase (see the discussion of Figure 5.12), fine-grained modularization (Figure 10.7), separate documentation (ditto), and even manually written automated regression tests (see Section 13.2.1). The mere fact that these nine companies have ventured to participate in Plat_Forms elevates them over their competition — many other companies (including several industry giants) shied away.
78
Freie Universität Berlin, Institut für Informatik
17 Conclusion
If you are a reader only looking for the results, you are in the wrong place. You want to read the previous section instead. For all others, this section contains a review of Plat_Forms on a meta-level: What have we learned about the nature of the results to be found in such a study? What have we learned about how to (or not to) design and carry out such a contest and study? What should be done next?
17.1 So what?: Lessons learned When refering to the results of the Plat_Forms study (as opposed to contest), that is, the set of platform differences found, please keep in mind we have just reported the facts observed for these particular nine solutions. Neither does the presence of a platform difference guarantee you will always get it in a similar fashion in other situations, nor does the absence of a difference mean you will never observe it somewhere else. See the discussion in Section 15 for details. Note that we do explicitly not attempt to weigh and interpret the differences in this report and rather let them speak for themselves That said, we have found differences of the following kinds: • “Obvious ones” that support common prejudice about the platforms involved, say, that Java solutions tend to be particularly large and Perl solutions particularly small. • Surprising ones that contradict common prejudice about the platforms involved, say, the uniformly good robustness and security of the PHP solutions in many (though not all!) respects. These results are the real gems found in Plat_Forms and will hopefully help to raise the future quality of the platforms-related discourse. These results also show that the “obvious” results were not really obvious at all; they could have been different, too. • New ones that refer to characteristics that are not a focus of the common platform discussions, in particular the high degree of within-platform uniformity in many respects for PHP. They are possibly even more important than the surprising results because they may direct more attention to issues that are relevant and can be exploited for progress in the field but are mostly overlooked so far. • Strange ones for which we do not know what they mean, if anything at all, such as the Java check-in frequency difference. Finally, when it comes to platform comparisons, there are of course more issues of interest than those discussed in the above findings, but we could not investigate them all. For instance, our attempts at measuring scalability (see Section 9) and reporting some aspects of modularity (see Section 12) did not work out, so we cannot report any differences in these respects. Other important aspects, such as a holistic comparison of the solution designs, we have not even attempted to investigate, because we feel they are too difficult. In short: there may be many more interesting differences waiting to be characterized.
17.2 Methodological lessons learned As is commonly the case when one does something for the first time (in particular something that nobody else has done either), one learns a lot about how to do and how not to do it, risks involved, what is important and 79
17 Conclusion what is not, what to expect, etc. Here are some of our insights: from the first round of Plat_Forms: • 30-hour time frame: When we announced Plat_Forms, many people reacted quite strongly on the 30hour time limit. They apparently considered it to mean a mandatory 30-hour-long stretch of continuous development, while we had just meant to say we did not want to keep the teams from following their own pace and style with respect to work times. Having seen it happen at the contest site, we do now think it would be better to actually prescribe a break of 8 or perhaps even 10 hours during the night. We had the impression that some teams were lured into overtaxing their strength by the 30-hour formulation and that it may actually have hurt more than it helped. • Quality of teams: It was an ambition of Plat_Forms to have only top-class teams, roughly from among the best 5% of such teams available on the market. The idea was that only in this case would the variability that was due to the people be so low that the variability that was due to the platform would become clearly visible. This goal may have been unrealistic from the start and we have clearly not met it: While the teams were obviously competent, they were by-and-large still in the “normal” rather than “superhuman” range. For what it’s worth as an indicator: three members (from team1 Perl, team2 Perl, and team9 Java) had only one or two years professional experience (see Figure 3.2) and eight members (from team1 Perl, team2 Perl, team4 Java, team9 Java, and team7 PHP) estimated themselves to be not even among the top 20% of professional developers in terms of their capabilities (see Figure 3.4). It appears that this fact has reduced the number and clarity of platform differences found, but not kept us from finding some differences — at least with respect to Perl and PHP; it looks problematic for Java. • Size of task: As a consequence of the lack of superhuman teams, the PbT task was too large for the given time frame. Much of the analysis and comparison would have been easier had the completeness of the solutions been higher. • Webservice requirements: Our main reason for including these requirements in the task was basically to provide ourselves with an affordable method for load testing (see the discussion in Section 9). This did not work out at all; something we should have expected: It should have been obvious that the teams would first concentrate on the “visible” functionality at the user interface level and that, as the task size was ambitious, many would not be able to complete all or some of the webservice — and that making all webservice requirements MUST requirements (as we did) might not help. It did not. Unfortunately, this insight does not show how to escape from this problem. Presumably one has to go the hard way and plan for performing the load testing via the HTML user interface — may the Javascript gods be gentle. • Dropout risk: Only while we waited for the remaining teams to arrive in the afternoon of Januar 24 did we fully realize what a crazy risk we were taking by having only three teams per platform. If only one of them did not arrive, we would hardly be able to say much about that platform at all. Fortunately, we had apparently found teams with a good attitude and they all appeared as planned. Since scaling the contest to four teams per platform is a major cost problem (see the next lesson), this issue needs to be handled with utmost care in future contests. • Data analysis effort: Even though we had only three platforms in the contest this time (where six had been planned), we were almost overwhelmed by the amount and complexity of work to be done for the evaluation. Much of it, such as the completeness checks, were just enormous amounts of busywork. Others, such as the correct classification of file origin, were downright difficult. Still others, such as our attempt at runtime profiling, held suprising technical difficulties. Although we have spent a fair amount of resources on the evaluation, we are far away from having done all we would have liked to. Many of our analyses are much more superficial than one would like, because of the additional complexity introduced by the heterogeneity of our raw material. As an example, consider the evaluation of the version archives. Although there were only three different versioning systems used, a far lower amount of variability than in many other places in the evaluation, we were not able to analyze on the level of number of lines added/deleted per revision, because such data was easily available only for CVS. It would have been possible, but very laborious, to get the same data for Subversion and Perforce as well. 80
Freie Universität Berlin, Institut für Informatik
17.3 Further work • Server and network setup: As a minor note, while our technical setup at the conference site worked quite flawlessly, one of its aspects turned out to be problematic later: Each team had a full subnet with 256 IP addresses (firewalled against the subnets of the other teams) for their development machines plus server (typically about 4 of these IPs would be used) and we told them not only the address of that subnetwork, but also that we would assign IP 80 within it to their webserver and map it to the externally visible name teamX.plat-forms.org. When we later ran the team’s webserver virtual machines at home, though, we wanted to use dynamic IP addresses. It turned out that some teams had hardcoded the IP somewhere, which made setting up the machines at home more difficult.
17.3 Further work It is true for most good scientific studies to have more open questions afterwards than before — and Plat_Forms is no exception. A lot remains to be done better or more thoroughly than we could do it this time and a lot remains to be done at all: • All major platforms: Although we had hoped to also have teams for .NET, Python, and Ruby in the contest, there were not enough teams that applied for participation from these platforms; our outreach was simply not good enough this time. If the results of Plat_Forms receive sufficient attention, it should be much easier next time. On the downside, as described above, the effort for evaluation will be correspondingly higher and it might become difficult to finance such a larger study. • Larger number of teams that apply: More attention would also be important for a second reason. If far more than three teams apply per platform, the chances of more uniform team capabilities increase among the three selected for the contest. As discussed above, such uniformity should reduce the variability in the within-platform results and improve our chances of detecting platform differences. • Refined notion of “platform”: As the example of team9 Java shows, our current definition of what constitutes a platform may be inappropriate. We currently make the underlying programming language the defining characteristic. This can be inappropriate if the frameworks on top of that language are extremely different (as for instance team9 Java’s RAP in comparison to Spring) or if multiple languages are mixed (as it happens in the .net and sometimes also the Java case, not to speak of the continually increasing importance of JavaScript); possibly also for other reasons. However, refining the notion of platform would mean more platforms and it is unclear how to adapt the architecture of Plat_Forms — simply scaling to 20 or even 40 platforms is certainly not an option, at least not in the short run. • More complete evaluation: Our current evaluation has not considered a number of important characteristics, in particular scalability/efficiency and solution design structure. It would be important to include at least the former next time. We would therefore like to repeat Plat_Forms with more platforms, more teams, and a more complete evaluation. In case you are interested in participating as a team or in supporting this event financially, please drop me a note with no obligation.
Technical Report B-07-10, www.plat-forms.org
81
17 Conclusion
Acknowledgements When the term “we” is used in this report, it refers to varying subsets of the following people and organizations (plus myself): Gaylord Aulke (then of 100 days) asked whether an empirical language comparison could be done for web development platforms and provided the contact to Jürgen Langner (of Zend Technologies) who put me in contact with Richard Seibt (of LBCN) and Eduard Heilmayr (and later Jürgen Seeger, both of Heise) who had the necessary contacts to make it all possible. The sponsors Zend Technologies, Accenture Technology Solutions, and Optaros provided the necessary financial support, and LF.net provided the Perl teams with server infrastructure. The platform representatives Jürgen Langner (Zend) for PHP and Alvar Freude (German Perl Workshop) for Perl acquired the respective teams. Marion Kunz (of Heise) efficiently and reliably handled the organizational details at the contest site and Carsten Schäuble and Philipp Schmidt set up and ran a perfect network there against all odds. Peter Ertel, Will Hardy, and Florian Thiel did the activity logging at the contest. They and Ulrich Stärk performed the bulk work during the evaluation and contributed many good ideas and approaches. 27 patient, clever, willful, and disciplined participants turned up at the contest despite heavy snow, did not faint when they saw the requirements, somehow managed through the night, and even delivered solutions. They also provided further input and feedback during the evaluation and preparation of this report. Will Hardy, Sebastian Jekutsch, Christopher Oezbek, Ulrich Stärk, and Florian Thiel commented on drafts of this report. Gesine Milde did proofreading. Thank you all for making this first-of-its-kind event possible!
Figure 17.1: Plat_Forms still life
82
Freie Universität Berlin, Institut für Informatik
A Participant questionnaire
These are the contents of the questionnaire that we asked the participants to fill in after the end of the contest. It was handed out as a 3-page RTF file. P LAT _F ORMS 2007 P OSTMORTEM Q UESTIONNAIRE Please fill this in by 2007-02-02 and email it to
[email protected]. Each team member should fill in a questionnaire independently. This questionnaire (12 questions, will take about 40-80 minutes) provides essential information for the scientific evaluation. We will attach your platform and sometimes your team name to this information, but never your personal name. Fill in by writing into the double square brackets [[ like this ]] in “insert” mode. My home organization is [[ ]]. 1. I am [[ ]] years old and have [[ ]] years of experience as a professional software developer. My formal education is [[ ]]. In the past 12 months, I have spent approximately [[ ]] percent of my work time with technical software development activities (as opposed to project management, non-software-related activities, etc.). 2. Among all professional programmers creating web applications, I consider myself [[ ]] among the most capable 5% [[ ]] among the most capable 10% [[ ]] among the most capable 20% [[ ]] among the most capable 40% [[ ]] about average [[ ]] among the least capable 40% [[ ]] among the least capable 20% [[ ]] among the least capable 10% [[ ]] among the least capable 5% 3. I am regularly using or have used during some time in the past the following programming languages (list their names, separated by commas, in roughly the order in which you started using them): [[ ]] 4. I have also at some point tried out (i.e. have written at least one program of at least 50 lines) the following programming languages (list their names, separated by commas, in roughly the order in which you tried them): [[ ]] 5. I am regularly using or have used during some time in the past the following frameworks/platforms for writing web applications (list only those that would be considered the centerpiece of a web application, separated by commas, in roughly the order in which you started using them): [[ ]] 6. Had I been given the exact same requirements document in my normal work and asked for a full-fledged professional implementation, I would have estimated the effort as follows:
83
A Participant questionnaire [[ ]] person days for web design [[ ]] person days for programming (design/impl.; MUST & SHOULD req’s) [[ ]] person days for programming (MAY requirements) [[ ]] person days for thorough quality assurance and documentation 7. I think the following 2 to 5 aspects of PbT were the most difficult ones (list each aspect and describe in one sentence why): [[ ]] [[ ]] [[ ]] [[ ]] [[ ]] 8. I suspect the following 2 to 5 aspects of PbT were those where my platform provided the biggest competitive advantage compared to other platforms, as far as I know (list each aspect and describe in one sentence why): [[ ]] [[ ]] [[ ]] [[ ]] [[ ]] 9. I think the following 2 to 5 aspects of PbT were those where my platform provided the weakest support (list each aspect and indicate what was missing): [[ ]] [[ ]] [[ ]] [[ ]] [[ ]] 10. These are the files that someone who is well familiar with my platform should first read in order to understand my team’s PbT implementation (list about 3 to 15 files with pathname, in preferred reading order): [[ ]] [[ ]] [[ ]] [[ ]] [[ ]] [[ ]] [[ ]] [[ ]] [[ ]] [[ ]] [[ ]] [[ ]] [[ ]] [[ ]] [[ ]] 11. Would that person who is well familiar with my platform know that the above are the best starting points for reading even if nobody told him/her? (mark with an X) [[ ]] yes [[ ]] yes, for most of the files [[ ]] for many of the files not, but s/he would find them within 15 minutes
84
Freie Universität Berlin, Institut für Informatik
[[ ]] no, for most of the files not [[ ]] no 12. These are the files that someone who knows the programming language but not the rest of my platform (framework, libraries, architecture conventions) should first read in order to understand my team’s PbT implementation (list about 5 to 20 files with pathname, in preferred reading order, explain the role of each in about one sentence): [[ ]] [[ ]] [[ ]] [[ ]] [[ ]] [[ ]] [[ ]] [[ ]] [[ ]] [[ ]] [[ ]] [[ ]] [[ ]] [[ ]] [[ ]] [[ ]] [[ ]] [[ ]] [[ ]] [[ ]] That’s all, folks! Thank you very much for your participation in Plat_Forms.
Technical Report B-07-10, www.plat-forms.org
85
B Answers to postmortem questions 7, 8, 9 This appendix contains the raw material from which the summary in Section 14.2 was composed. Each itemized list was compiled from the three postmortem questionnaires filled in by each team.
B.1 Q7: Most difficult aspects of the task B.1.1 Java
Team3 Java: • Scalability: Handling the requested amount of users and concurrent users without performance testing is hardly to do (if you have a platform (inside VMWare) you do not really know). • Amount of requested features vs. time: Implementing all the features was hardly to do. • Search over likes/dislikes: hard to code joins/conditions • Member list and associated charts for different status • Webservice Implementation: environment not easy to handle • complex search: The different search options and their combinations were difficult to translate to SQL • geographical search: Because of no previous experience with geographical search, it was difficult to choose whether to use the database?s native support or to implement it on top Team4 Java: • Generating the image: We had no idea which library we should use. • Web Services: We had not enough time to come this far. • Member search. Very complex, the complexity comes from satisfying all of the selected filters, selected by the user. • Overview plot of member list. Never worked with images in java and sent as respond to the browser (only with PDF), but finally I completed the task. • Matching the plotting area within the overview plot of member list. Difficulties were the varying dimensions of the axis. Team9 Java: • I think that there were no real difficult aspects of PbT regarding the programming challanges. Personally I think the most difficult thing about PbT is meet the non-functional requirements like creating an acceptable UI or comply with the scalability requirements. • WebService interface: no experience with WebServices and some uncertainties on how to integrate e.g. Axis in RAP/OSGi • Eneagram chart: RAP has no out-of-the-box support for dynamically generating images. Time-consuming would be to find a suitable library (licence, stability, feature-completeness) and learn how to solve the problem with the chosen library. • The web services interface, because our platform is not targeted at those stuff. • The member list overview plot, because we don’t have a canvas control to draw on. We could have drawn those images using some graphics lib. An alternative approach would be to freely arrange labels representing the members on a blank control. 86
B.1 Q7: Most difficult aspects of the task B.1.2 Perl
Team1 Perl: • SOAP: because I know nothing about SOAP, and even less about WSDL • Complex search capabilities, for it required database savvyness • SOAP • Prioritization • Complex search • SOAP specification (complexity of the WSDL interface). REST Web services would have been much simpler • complex criteria combination for searching members • graphical plot Team2 Perl: • SOAP, complex stuff, especially within 30 hours • Graphical plot, since there was no time to find and test a plotting module, so it was coded as plain gdlibcalls • WSDL, because with Perl it is very difficult to realize (I guess nobody finished this issue • User search, was very complex • SOAP, generally difficult, especially since perl supports WSDl only very poor • KTS calculation: Not difficult per se, but new stuff, had to read a bit, and no testcases given! • Likes/Dislikes : unclear specification, problem of filtering stop words from sentences to fill proposal list • Member search: Desin a user friendly interface for queries Team5 Perl: • Lack of SOAP support in Perl, but by no means the fault of the contest. We should have given up on this aspect of the task instead of dedicating 1/3 of our effort on it. • Fatigue. I greatly underestimated how the lack of sleep impacted my work personally. I guess I can’t pull all nighters like I used to be able to! • VMware image. This was entirely my fault. I neglected to investigate building an image until near our departure and ran into various kernel problems on the systems I was working with. PlusW was kind enough to build us an image, but it was on a Linux distro we aren’t as familiar with and I spent roughly 2-3 hours working out Apache/mod_perl/postgresql/and CPAN/Perl issues that I really should have had sorted out prior to the start. • Unfamiliar work environment. Small things that impacted my performance like strange chair, bright lights, etc. • Requirements. Again, not the fault of the contest or organizers, but due to fatigue we misunderstood/missed a few requirements and priorities that I am sure we would have not given normal sleep/work patterns. • Complying with externally supplied wsdl file. SOAP is very verbose and repetitive protocol, for those reasons, it is not embraced by most users of agile languages and our tools for interacting with it are much less robust than in environments where verbosity and repetition are the norm. That said, we implemented several of the SOAP interactions (login, logout, new user registration, and take personality test) • Managing fatigue. I don’t have a magical suggestion for a better format, but 30 hours around the clock is hardly conducive to careful and accurate thinking. • soap ? perl is lacking soap support • advanced searching ? not terribly difficult, but it’s the next most difficult thing that I could think of. Technical Report B-07-10, www.plat-forms.org
87
B Answers to postmortem questions 7, 8, 9 B.1.3 PHP
Team6 PHP: • Search. The problem is here to have Millions of Record and a Search which can have up to 15 AND/OR clauses ? and this very fast. Actually this is more a database problem then a language issue • Security. To make a webapp secure is quite difficult. During contest we took some time and we could fully hack all other teams applications. • TTT, is one way to find real interesting persons • Location search, nobody wants to walk/drive so far away • Perfomance requirements. I still do not know if it is possible to fit to required limits (1M of users, 1k concurrent users on givven platform etc..) • User search ? building the query (the efficient one) was quite complex tasks. Some of them were solved (at least theoretically). For example we thought that searching users by distance r might be a problem on larger dbs as there is no possibility to index square root expression in MySQL. But shortly we came to the solution to limit the search to the 2r*2r geosquare (this query can use indexes) and only then filtering exact distance matches which are calculated by expression. • Some requirements were based on logout time ? due to nature of web applications, the exact logout time is not always could be registered. • Non functional aspect: after 15 or so hours of development, development velocity falls significantly Team7 PHP: • Performance issues. It was somehow difficult to optimize the application in the given timeframe • huge requirements. Just too much requirements to implement in the given amount of time. At least if you would have tried to do well. • RCD status Had problems to keep in mind sender and receipients status. • Member search Performance of searching in huge memberlists. • 1 Generate a perfomant search query for all aspects of search. • 2 Generate the graphic with a huge count of results in a clearly arranged way • 3 Algorithms for the ttt/ Find the best way to save this performant in the database Team8 PHP: • • • • • • • • •
Search Result Graph: some special requirements here that were not solved in general libraries Web Services: Returning the graph: Never did such a thing Performance: To achieve good performance in such little time is not easy Search Query: The 2-way relation made the search query a problem. keeping it all together ? planning, team communication, coding; and all withing 30 hours not to get in hectic ? difficult for me to work under pressure Geo-Distance Calculation ? because we didn?t have MySQL 5.1 installed The 2-D Plot ? because you need to design it and a suitable (fast) db query to get the required data Web-Service ? because one of our developers implemented too much functionality in the Controller instead of the User Model
B.2 Q8: Platform advantages B.2.1 Java
Team3 Java: 88
Freie Universität Berlin, Institut für Informatik
B.2 Q8: Platform advantages • • • • • • • •
Simple Input Formulars with Validation, Formatting: Part of abaXX Framework Simple UI Elements (e.g. sortable Tables, Menu, Login, Logout): Part of the abaXX Framework Lots of available libraries: Eg Chart User Registration: Built-in user management in abaXX.components Member Lists: support for sorting, chunking in abaXX.components Pageflow in general: support for eventbased pageflow in abaXX Webservice implementation: best support in Java Reuse of UI components (e.g. Member List). The abaXX web.ui framework provides a true component model for web applications that allows to construct web applications of pre-build or custom components (so called ?parts?) based on the MVC-pattern • Complex web user interface. The abaXX web.ui tag library contains powerful JSP tags, that simplify the development of complex user interfaces. For example automatic paging of lists by the list widget/tag • Web Services support. The Axis framework provided a good mapping of the given WSDL to Java objects Team4 Java: • OOP: Java provides a real object-oriented programming model with e.g. information hiding and strong datatypes. • Layered architecture: The components are divided in 3 distinct layers: DAO, service and GUI. Each layer can be implemented and tested in isolation. • Testing: All components can be thoroughly covered by Unit-Tests. • Frameworks for ORM (Hibernate), Security (Acegi), Page Flows (SWF) • Scalability. Reason is the layered architecture, object orientation, maintainability, ? • Flows like user registration or the TTT. Spring webflow profoundly supports such ?flows?. • Webservice. High reusability of components. Team9 Java: • As I am not very trained in HTML and JavaScript ?programming?, so it helped a lot that RAP encapsulates those low level tasks completly. • Extensibility: through the plug-in mechanism of RAP the application could be (even by thrid-party implementors) easily extended to meet further requirements. Though this was not an actual requirement of PbT, from my experience I would suppose that any non-trivial application will face this requirement sooner or later. • Rich, in the sense of feature-rich, user interface: responsive, not page-oriented, aligned with non-web client user interfaces. • Indirect advantage: since RAP is written in Java and based on Eclipse, all advantages of a compiled, type-safe language and a mature IDE with excellent support for Java-development. • User experience. In our approach, every functionality is close at hand. • Extensibility. It’s quite easy to add more tabs, views, and dialogs to the application without breaking the navigation concept. • All the advantages of software development with Eclipse: a powerful component model, great IDE support, ... B.2.2 Perl
Team1 Perl: • Short time frame: Perl’s development cycle is very fast • database access made easy with good Object Relational Model • Graphics: almost too many Perl modules to choose from Technical Report B-07-10, www.plat-forms.org
89
B Answers to postmortem questions 7, 8, 9 • • • • • • •
CRUD Login - Registration TTT analysis and computing profile (data structure transformations in Perl are elegant and easy) SQL generation (Perl module SQL::Abstract is great for combining various criteria) graphical plot (compact API — once we got the proper module!) Object-Relational Model (automatic classes and methods for accessing the database, including joins) Page generation (Perl Template Toolkit is a very efficient language)
Team2 Perl: • ORM, Perl is very handy for code generation, like domain classes • Form handling, Perl provides modules which let you describe and validate a whole form with just one simple data structure • Component based OO-templating with Mason. Possible with other languages too, but there aren’t many mason-like solutions for them. • Data Access Objects (DBIx::Class) • Frontend Templating • User accounts, Sessions, ... • Form validation ; very flexible tool, define a profile, throw in your form data, take the result out. • HTML templating ; HTML::Mason is extremely flexible for this, • Database access ; Database independent, fast, comfortable, no sql writing! generate classes automagically Team5 Perl: • Code generation of database models • Ability to regenerate all db models and controller models without losing any “custom” changes we needed to make • The overall flexibility • data modeling. With Bigtop, regenerating through rapid data model changes is easy. • Scoring the temperment tests. With about three hashes and a tiny set of loops and logic, this task was almost made for an agile language like Perl. • mvc and code factoring ? our separation and code factoring makes for a quick and organized multideveloper development platform • standalone ? the standalone server allows for rapid development
B.2.3 PHP
Team6 PHP: • • • • • • •
Web Pages itself SOAP webservice ? at least compared to Perl Flexibility, PHP is more flexible and can be easier integrated as others Extending, its very easy to extend php and it has a very great default and base functionallity Fast setup, short time between setup and the start with actual requirement implementation Variable variables can be extremely powerful not specifically PbT aspect: php provides a possibility to choose the implementation strategy: quick and dirty OR structured and clean
Team7 PHP: 90
Freie Universität Berlin, Institut für Informatik
B.3 Q9: Platform disadvantages • No Framework. We built it almost from scratch. So were completely open and didn’t have to care about how we would have to built it using framework X. With PHP that’s possible. In the Java World that wouldn’t have been possible. [[ Multiple processing of RCDs Performance problems in huge memberlists. • Memberlist overview plot Plot of many member values • Easy prototyping with a little framework • Optimized for web applications • Easy template engine • possibly time saving workarounds by using unclean ways of programing (using global variables etc.) Team8 PHP: • Graphic output: Powerful JPGraph library • Forms processing: abstract model for display and validation of forms • Web Services (though we could not implement them all due to time lack for refactoring the application accordingly) • MVC ? Very streamlined implementation, no configuration in separate config-file needed. • Template Engine ? Incorporates concepts of Java-Tag-Libraries, easy Templating language • Web-Services (PHP 5 comes with all required classes) • Rapid Prototyping (you can just start writing your application) • Many useful (high-level) code libraries and frameworks like PEAR, Zend Framework and jpgraph (PHP in general) • MVC pattern (Zend Framework), which makes the code clean and readable
B.3 Q9: Platform disadvantages B.3.1 Java
Team3 Java: • Database access: We tried to access the database over hibernate. The requested search criterias where quite hard to • Scability: It is hard to do fulfil Scalability request without testing, because there are too many parameters which can influence them. • Web services sessions. The session handling and timeout is not supported and had to be programmed for PbT. • Fixed paths for WSDL and SOAP services. A servlet to forward requests to the given URLs had to be build. Team4 Java: • Time consuming: Long compile and deployment cycles • Develop the tasks in the “short” time. Reason is the higher complexity due to high scalability, reusability and maintainability in the “operations” phase. Team9 Java: • The first development steps of RAP where done in october 2006. So it?s not realy finished by know ? besides this I did not encounter any restrictions for the given task • Eneagram graph: the framework is yet missing a way to dynamically create images. • RAP is a very young technology and therefore we encountered many pitfalls during the implementation of PbT. In turn we gathered valuable insight on how usable (or not) the current implementation is. Technical Report B-07-10, www.plat-forms.org
91
B Answers to postmortem questions 7, 8, 9 • Performance - the startup time is rather long. On the other hand, once loaded, the application responds very quickly. • Web servcices interface: RAP is geared towards the UI, there are no builtin facilities for web services. Due to the underlying technology, registering additional servlets might still introduce some problems, especially when they need access to session management. • RAP is still in a very early state of development, many features are still missing. Therefore, workarounds had to be used at certain places. Development with RAP will surely be much easier and faster once it has matured. B.3.2 Perl
Team1 Perl: • • • •
SOAP: because Catalyst is more geared towards REST or XMLRPC SOAP SOAP : missing tools for WSDL parsing and mapping to Perl code complex clauses in SQL generation (SQL::Abstract doesn?t support subqueries or MySQL MATCH..AGAINST syntax)
Team2 Perl: • • • •
SOAP ? there was no appropriate module for using a wsdl file WSDL SOAP WSDL / SOAP ; very poor support. SOAP is ok, but WSDL is bad.
Team5 Perl: • SOAP. As mentioned before Perl is lacking good SOAP support. • SOAP. See number 7 above. • soap B.3.3 PHP
Team6 PHP: • • • •
actually I don?t believe that there is anything in this project where other language could have done better Multibyte support, will be changed with php6 Straight OO Implementation, Object Overloading is missing, real references (pointer) again. Not specifically PbT aspect: php provides a possibility to choose the implementation strategy quick and dirty OR structured and clean. Some side note: I am not sure, but because of this ?quick and dirty? approach looks like php as a language has worse name comparing to java or perl within programmer community. This is because php is quite ?easy? language and relatively many beginner programmers who are not fully aware of security solutions use php. But again this is not a language problem. As on the other hand, it would be much more difficult for inexperienced developers to start with java or similar languages at all.
Team7 PHP: • • • • 92
WSDL2PHP missing. Had to do it by myself ;). Overview plot no diagram library (in our framework not in php!) available Overall performance decreasing performance of MySQL when number of members exceeds about 100.000 1 Allows dirty implementation / possibile security issues Freie Universität Berlin, Institut für Informatik
B.3 Q9: Platform disadvantages • 2 better standard modules like filters for input parameters etc. could be possible Team8 PHP: • • • • •
User Interface (look and feel): No special libraries used, no standard layout Distance Search: No support in the DB nor in the Framework for GIS, no knowhow in the team HTML-Form-Abstraction ? Only semi-automatic Value/Type checking ORM ? Too much Handcoding needed Security (I know that there are XSS problems, but the next version of our template engine ? a part of our internal Framework distribution - will fix that by escaping all strings by default) • Performance (a C++ program could have been faster ;)
Technical Report B-07-10, www.plat-forms.org
93
C Screenshots
To give you at least a minimal impression of what the solutions are like, we provide you with screen shots of each team’s main application dialogs below. Some of the shots are missing, because the respective functionality was not present in all applications.
C.1 Registration dialog
Figure C.1: Registration dialog of team3 Java
94
C.1 Registration dialog
Figure C.2: Registration dialog of team4 Java
Figure C.3: Registration dialog of team9 Java
Technical Report B-07-10, www.plat-forms.org
95
C Screenshots
Figure C.4: Registration dialog of team1 Perl
96
Freie Universität Berlin, Institut für Informatik
C.1 Registration dialog
Figure C.5: Registration dialog of team2 Perl
Technical Report B-07-10, www.plat-forms.org
97
C Screenshots
Figure C.6: Registration dialog of team5 Perl
98
Freie Universität Berlin, Institut für Informatik
C.1 Registration dialog
Figure C.7: Registration dialog of team6 PHP
Technical Report B-07-10, www.plat-forms.org
99
C Screenshots
Figure C.8: Registration dialog of team7 PHP
100
Freie Universität Berlin, Institut für Informatik
C.1 Registration dialog
Figure C.9: Registration dialog of team8 PHP
Technical Report B-07-10, www.plat-forms.org
101
C Screenshots
C.2 Trivial Temperament Test (TTT)
Figure C.10: Clipping from “Trivial Temperament Test” of team3 Java
Figure C.11: Clipping from “Trivial Temperament Test” of team4 Java
102
Freie Universität Berlin, Institut für Informatik
C.2 Trivial Temperament Test (TTT)
Figure C.12: Clipping from “Trivial Temperament Test” of team9 Java
Figure C.13: Clipping from “Trivial Temperament Test” of team1 Perl
Technical Report B-07-10, www.plat-forms.org
103
C Screenshots
Figure C.14: Clipping from “Trivial Temperament Test” of team2 Perl
Figure C.15: Clipping from “Trivial Temperament Test” of team5 Perl
Figure C.16: Clipping from “Trivial Temperament Test” of team6 PHP
104
Freie Universität Berlin, Institut für Informatik
C.2 Trivial Temperament Test (TTT)
Figure C.17: Clipping from “Trivial Temperament Test” of team7 PHP
Figure C.18: Clipping from “Trivial Temperament Test” of team8 PHP
Technical Report B-07-10, www.plat-forms.org
105
C Screenshots
C.3 Search for members
Figure C.19: Clipping from “Search for members” of team3 Java
Figure C.20: Clipping from “Search for members” of team5 Perl
Figure C.21: Clipping from “Search for members” of team9 Java
106
Freie Universität Berlin, Institut für Informatik
C.3 Search for members
Figure C.22: Clipping from “Search for members” of team1 Perl
Figure C.23: Clipping from “Search for members” of team2 Perl
Figure C.24: Clipping from “Search for members” of team6 PHP
Technical Report B-07-10, www.plat-forms.org
107
C Screenshots
Figure C.25: Clipping from “Search for members” of team7 PHP
Figure C.26: Clipping from “Search for members” of team8 PHP
108
Freie Universität Berlin, Institut für Informatik
C.4 Memberlist and member overview graphic
C.4 Memberlist and member overview graphic
Figure C.27: Clipping from “Member list” of team3 Java
Technical Report B-07-10, www.plat-forms.org
109
C Screenshots
Figure C.28: Clipping from “Member list” of team9 Java
Figure C.29: Clipping from “Member list” of team1 Perl
110
Freie Universität Berlin, Institut für Informatik
C.4 Memberlist and member overview graphic
Figure C.30: Clipping from “Member list” of team2 Perl
Figure C.31: Clipping from “Member list” of team5 Perl
Technical Report B-07-10, www.plat-forms.org
111
C Screenshots
Figure C.32: Clipping from “Member list” of team7 PHP
Figure C.33: Clipping from “Member list” of team8 PHP
112
Freie Universität Berlin, Institut für Informatik
C.5 Member status page
C.5 Member status page
Figure C.34: Clipping from “Member status page” of team3 Java
Figure C.35: Clipping from “Member status page” of team4 Java
Figure C.36: Clipping from “Member status page” of team9 Java
Technical Report B-07-10, www.plat-forms.org
113
C Screenshots
Figure C.37: Clipping from “Member status page” of team1 Perl
Figure C.38: Clipping from “Member status page” of team2 Java
114
Freie Universität Berlin, Institut für Informatik
C.5 Member status page
Figure C.39: Clipping from “Member status page” of team5 Perl
Figure C.40: Clipping from “Member status page” of team6 PHP
Figure C.41: Clipping from “Member status page” of team7 PHP
Technical Report B-07-10, www.plat-forms.org
115
C Screenshots
Figure C.42: Clipping from “Member status page” of team8 PHP
116
Freie Universität Berlin, Institut für Informatik
Bibliography
[1] Henning Behme. Programmierwettbewerb Plat_Forms online. http://www.heise.de/newsticker/meldung/79305/, October 2006. [2] Larry Christensen. Experimental Methodology. Allyn and Bacon, 10th edition, 2006. [3] Alistair Cockburn. Writing Effective Use Cases. Addison-Wesley, 2001. URL http://www.amazon. com/exec/obidos/ASIN/0201702258/alistaircockburn. [4] Matthias Gamer. irr: Various Coefficients of Interrater Reliability and Agreement, 2007. URL http: //cran.r-project.org. R package version 0.63. [5] Alan Green and Ben Askins. A Rails/Django comparison. http://docs.google.com/View?docid=dcn8282p_1hg4sr9, September 2006. URL http://docs. google.com/View?docid=dcn8282p_1hg4sr9. [6] Jim Highsmith and Alistair Cockburn. Agile software development: The business of innovation. IEEE Software, (9):120–122, September 2001. [7] David C. Hoaglin, Frederick Mosteller, and John W. Tukey, editors. Understanding Robust and Exploratory Data Analysis. Wiley Interscience, 2000. URL http://www.amazon.com/gp/reader/ 0471384917/ref=sib_dp_pt/103-2832531-4405422#reader-link. [8] Barbara A. Kitchenham, Shari Lawrence Pfleeger, Lesley M. Pickard, Peter W. Jones, David C. Hoaglin, Khaled El Emam, and Jarrett Rosenberg. Preliminary guidelines for empirical research in software engineering. IEEE Trans. Softw. Eng., 28(8):721–734, 2002. ISSN 0098-5589. [9] Michael Kunze and Hajo Schulz. Gute Nachbarschaft: c’t lädt zum Datenbank-Contest ein. c’t, 20/2005:156, 2005. see also http://www.heise.de/ct/05/20/156/, english translation on http://firebird.sourceforge.net/connect/ct-dbContest.html, overview on http://www.heise.de/ct/dbcontest/ (all accessed 2007-05-01), results in issue 13/2006. [10] Detlef Müller-Solger. Wettbewerb der Portale. IT Management, 9-2006:47–48, 2006. [11] Jakob Nielsen and Robert L. Mack, editors. Usability Inspection Methods. Wiley and Sons, New York, 1994. URL http://www.useit.com/jakob/inspectbook.html. [12] Dewayne E. Perry, Adam A. Porter, and Lawrence G. Votta. Empirical studies of software engineering: a roadmap. In Proc. of the Conf. on The future of Software engineering, pages 345–355. ACM Press, 2000. ISBN 1-58113-253-0. [13] Karl Popper. The Logic of Scientific Discovery. Routledge, 1959/2002. ISBN 9780415278430. [14] Lutz Prechelt. The 28:1 Grant/Sackman legend is misleading, or: How large is interpersonal variation really? Technical Report 1999-18, Fakultät für Informatik, Universität Karlsruhe, Germany, December 1999. URL http://page.inf.fu-berlin.de/~prechelt/Biblio/#varianceTR. ftp.ira.uka.de. 117
Bibliography [15] Lutz Prechelt. An empirical comparison of C, C++, Java, Perl, Python, Rexx, and Tcl for a search/string-processing program. Technical Report 2000-5, Fakultät für Informatik, Universität Karlsruhe, Germany, March 2000. URL http://page.inf.fu-berlin.de/~prechelt/Biblio/ #jccpprtTR. ftp.ira.uka.de. [16] Lutz Prechelt. An empirical comparison of seven programming languages. IEEE Computer, 33(10): 23–29, October 2000. [17] Lutz Prechelt. Kontrollierte Experimente in der Softwaretechnik – Potenzial und Methodik. Springer Verlag, Heidelberg, 2001. [18] Lutz Prechelt. Plat_Forms – a contest: The web development platform comparison. Technical Report TR-B-06-11, Freie Universität Berlin, Institut für Informatik, Germany, October 2006. [19] Lutz Prechelt. Plat_Forms 2007 task: PbT. Technical Report TR-B-07-03, Freie Universität Berlin, Institut für Informatik, Germany, January 2007. [20] R Development Core Team. R: A Language and Environment for Statistical Computing. R Foundation for Statistical Computing, Vienna, Austria, 2006. URL http://www.R-project.org. ISBN 3-900051-07-0. [21] Jürgen Seeger. Java EE vs. .Net vs. RoR vs. PHP vs. Python — Plat_Forms: Internationaler P rogrammierwettbewerb geplant. iX, 11/2006:52, 2006. URL http://www.heise.de/kiosk/archiv/ix/2006/11/ 20_Java_EE_vs._.Net_vs._RoR_vs._PHP_vs._Python. [22] Hadley Wickham. ggplot: An implementation of the Grammar of Graphics in R, 2006. R package version 0.4.0.
118
Freie Universität Berlin, Institut für Informatik