ABSTRACT. Twenty hFSH isoforms were isolated from hu- man pituitary extracts,. 15 of which were highly pure. The mild purification procedure, which used a ...
0013-7227/92/1305-2820$03.00/0
Endocrinology Copyright 0 1992 by The Endocrine
Vol. 130, No. 5 Society
Printed
Isolation and Physicochemical Human Follicle-Stimulating PETER G. STANTON, DAVID BARBARA SCHMAUK-WHITE, Department of Biochemistry, (D.M.R.), Clayton, Melbourne
Characterization Hormone Isoforms*
in U.S.A.
of
M. ROBERTSON, PATRICK G. BURGON, AND MILTON T. W. HEARN
Monash University, and Prince 3168, Victoria, Australia
Henry’s
ABSTRACT. Twenty hFSH isoforms were isolated from human pituitary extracts, 15 of which were highly pure. The mild purification procedure, which used a FSH RRA to monitor FSH activity, involved an initial fractionation of pituitary extracts by gel filtration and isoelectric focusing. Six p1 regions (mean pI values, 3.63, 3.88, 4.07, 4.23, 4.84, and 5.13) of human (h) FSH were obtained and further fractionated on ion exchange and gel filtration HPLC. Recoveries of FSH radioreceptor activity at each stage were greater than 80%. Fifteen isoform preparations were judged as near homogeneous by HPLC-gel filtration and sodium dodecyl sulfate-polyacrylamide gel electrophoresis, exhibiting elution and migration behaviors consistent with the known mol wt of intact hFSH and its subunits. The remaining 5 isoform preparations contained a higher mol wt component that is probably hFSH related, as this component was detected after iodination, immunoprecipitation with hFSH antiserum,
Institute
of
Medical
Research
and sodium dodecyl sulfate-polyacrylamide gel electrophoresis. Similar amino acid compositions were obtained for the 20 hFSH isoforms, except for evidence of some oxidative degradation of serine, threonine, and tyrosine and decreased levels of glutamic acid, possibly due to carboxy-terminal heterogeneity of the /3subunit. An average amino acid composition value for all isoforms was comparable to that of 2 other highly purified hFSH preparations. Using the First International Standard for pituitary hFSH (83/575) as standard, radioreceptor activities were obtained ranging from 7,800-56,300 IU/mg protein. It is concluded that a mild purification procedure for the isolation of hFSH isoforms has been developed which gives high recoveries and has enabled the isolation of 15 isoforms in high purity suitable for further physicochemical and biological characterization. (Endocrinology 130: 2820-2832, 1992)
I
T IS KNOWN that preparations of the glycoprotein hormones FSH, LH, and TSH isolated from pituitaries are heterogeneous, existing as families of isoforms with respect to isoelectric point (PI), molecular size, circulatory half-life, and in U~‘UO,in vitro, and immunological activities (for a recent review, see Ref. 1). Furthermore, the pattern of heterogeneity of secreted forms of these hormones is similar to that found with pituitary (stored) hormone preparations (2-4). Currently, this heterogeneity is attributed to variation in the structures of the carbohydrate moieties present on the CX- and @subunits (1, 5, 6). The general structures of these carbohydrate groups have been recently determined (5, 7), with major variations occurring in the content and linkage of terminal sialic acids (7) and minor sulfation of terminal hexosamines (7). These variations are presumed to play an important role in the associated changes observed in the biological activities and other biochemiReceived October 16,199l. Address all correspondence and requests for reprints to: Dr. P. G. Stanton, Department of Biochemistry, Monash University, Wellington Road, Clayton, Victoria 3168, Australia. * This work was supported by a grant from the National Health and Medical Research Council of Australia.
2820
cal characteristics of these glycoprotein hormones (4, 811). Qualitative and quantitative changes in the isoform distribution of FSH, LH, and TSH have been correlated with changes in the physiological and endocrinological status of the donor animal (12). For example, the median charges of FSH from postmenopausal women, normal men, and castrated men are similar, whereas FSH in premenopausal women is more basic (13-15). These basic forms also exhibit greater in uitro bioactivities, with an increased MCR (16). One of the major problems in understanding the effect of glycosylation or other posttranslational modifications on the structure and function of these glycoprotein hormones, has been the lack of suitable separation protocols to purify to homogeneity individual protein isoforms. Hence, it is still not known how many isoforms of human (h) LH, hFSH, and hTSH are present in human pituitaries or how their different in uiuo and in vitro biological properties can be related to precise molecular differences. Earlier studies have relied primarily on differences in protein charge to separate isoforms. Isoelectric focusing (IEF) has been used extensively, for example, to characterize 7 broad peaks of hLH immunoreactivity (9),
ISOFORMS with obvious shoulders representing further molecular species.By in vitro bioassay, at least 20 different species of hLH are discernible in the eluted protein profile after isoelectric focusing of pituitary extracts (17). Characterization of heterogeneity by chromatofocusing has similarly produced broad profiles, representing more than 11 different hFSH isoforms (10) and 14 hLH isoforms (18, 19), while by moving boundary electrophoresis, greater than 20 isohormones of hTSH, hLH, and hFSH have been recognized (20). In these earlier studies, glycoprotein hormone activity was determined in the elution fractions that also contained many other proteins of similar elution or migration behavior, i.e. definitive information on specific activity and amino acid and carbohydrate compositional differences of these glycoprotein hormones could not be obtained. In a previous paper we have shown that isoforms of hLH separated by preparative IEF (i.e. by net charge differences) remain heterogeneous and may be further resolved by ion exchange chromatography (IEX; i.e. by surface charge differences) (21). The advantage of this approach is that individual surface charge differences on glycoproteins can be chromatographically resolved under several different conditions with the same ion exchange sorbent, with maximal resolution and recovery of isoforms suitable for structural characterization (21). In the current study we have applied this integrated approach to the purification and characterization of the isoforms of pituitary hFSH. This study differs from previous fractionation procedures that have resulted in the isolation of hFSH preparations containing multiple isoforms. To our knowledge this is the first attempt to isolate individual isoforms of the pituitary-derived gonadotrophins. A preliminary report of these results has been published (22). Materials
and Methods
Preparations Highly purified hFSH preparations were obtained from the NIH [NIH hFSH-I-3; FSH activity, 3100 IU/mg by the hCG augmentation bioassay; LH activity, 400 IU/mg; First International Standard (1st IS) for FSH/LH, human, urinary, for bioassay FSH/LH 70145 as standard] and the Human Pituitary Advisory Committee [HPAC; Canberra, Australia; HPAC hFSH, preparation 84/l; FSH radioreceptor activity, 2350 IU/ mg; LH radioreceptor activity, 35 IU/mg; Second International Reference Preparation (2nd IRP) of FSH/LH for bioassay as standard]. Initial
preparation
of human pituitary
extracts
Frozen human pituitaries, provided by the HPAC were stored at -70C before the fractionation studies. These pituitaries were not selected for age or sex, and donors presumably were predominantly elderly of both sexes (23). The initial steps for the
OF hFSH
2821
extraction of the human pituitaries were carried out at 4 C, as previously described (21). Briefly, lots of 50 human pituitaries were minced finely and homogenized (Polytron, Janke & Kunkel, Staufen, Germany) for 5 min at maximum speed in 50 mM phosphate buffer, pH 7.0, and a high speed supernatant was prepared by centrifugation at 100,000 X g for 1 h at 4 C. The supernatant was applied directly to gel filtration chromatography on a Sephacryl S200 (Pharmacia, Uppsala, Sweden) column (86 X 5 cm) in 50 mM ammonium acetate, pH 7.0, at a flow rate of 7.0 ml/h; fractions of 8 ml were collected. The FSH radioreceptor-active fractions were pooled and lyophilized. Preparative IEF of this lyophilisate (two runs, 400 mg each, dissolved in water containing 0.3 mM EDTA, 1.1 fiM pepstatin, 1.3 pM leupeptin, and 0.2 pM phenylmethylsulfonylfluoride; Sigma Chemical Co., St. Louis, MO) was carried out in a sucrose density gradient column in the pH range 3.5-10.0 at a final concentration of 1% (vol/vol) Ampholine, (LKB, Bromma, Sweden) in a 440-ml electrofocusing column (LKB) for 16-20 h at 2000 V or 30 watts at 4 C (21). The gradient was then eluted at 100 ml/h, and l-ml fractions were collected. The absorbance was measured at 280 nm. The pH was determined in every fifth tube directly using a combination glass electrode attached to a pH meter (PHM 62, Radiometer, Copenhagen, Denmark) and a chart recorder (Servograph REC 61, Radiometer). The pH of each fraction was then neutralized by the addition of 0.5 ml 0.3 M phosphate buffer, pH 7.0, and fractions were snap-frozen and stored at -20 C. Gel filtration
chromatography
on Sephadex
G-100
FSH-containing fractions were pooled and concentrated by ultrafiltration at 4 C (PLGC 062 25 membrane, Millipore, Bedford, MA) and fractionated on a Sephadex G-100 gel filtration column (90 X 2.6 cm) in 20 mM piperazine buffer, pH 9.6, containing 0.015% (vol/vol) Brij-35 (Sigma) at a flow rate of 18.1 ml/h at 4 C. Fractions of 7.5 ml were collected and stored at -20 C. High performance
anion exchange chromatography
(HPZEX)
A fast protein liquid chromatograph (Pharmacia) system was used with Mono-Q-prepacked columns (HR 5/5; 5 x 0.5 cm), as previously described (21). All separations were carried out at a flow rate of 1 ml/min at ambient temperature. Initial fractionation of the FSH pools was carried out using the Mono& column preequilibrated in 20 mM piperazine and 0.015% (vol/vol) Brij-35, pH 9.6. Bound proteins were eluted with a 57-min linear gradient of O-342 mM NaCl in piperazine buffer, and 1-min fractions were collected. Fractions associated with peaks of activity from each run were combined, and the buffer was exchanged on Sephadex G-25 columns (PD-10, Pharmacia) equilibrated in 20 mM piperazine and 0.015% Brij-35, pH 6.0. The FSH fractions (total volume, -30-50 ml) were then reloaded using a 50-ml loop (Superloop, Pharmacia) onto the Mono-Q column preequilibrated in 20 mM piperazine and 0.015% Brij-35, pH 6.0. Bound proteins were eluted with a 33.1min linear gradient of O-300 mM NaCl in piperazine buffer; fractions of 0.5 min were collected and stored at -20 C. FSH isoforms were identified by FSH RRA and rechromatographed on the Mono-Q column under identical conditions at pH 6.0 to confirm isoform separation. Preliminary studies indicated the
2822
ISOFORMS
necessity of including a low concentration of the nonionic detergent Brij-35 (0.015%, vol/vol) in the ion exchange buffers to avoid nonspecific adsorptive losses of FSH. High performance
gel filtration
chromatography
FSH isoforms were concentrated to less than 1 ml by lyophilization and chromatographed on a TSK G3OOOSW column (60 x 0.75 cm; Toya Soda Co., Yamasuchi-Ken, Japan) in 10 mM phosphate buffer, 154 mM NaCl, and 0.015% Brij-35, pH 7.4, at a flow rate of 0.4 ml/min at ambient temperature. The fraction size collected was 0.4 ml. Sodium dodecyl sulfate-polyacrylamide (SDS-PAGE)
gel electrophoresis
SDS-PAGE was carried out on 16% gels using the method of Laemmli (24). Gels were electrophoresed for 18 h at a constant current of 7.5 mamp and stained using the ammoniacal silver stain of Wray et al. (25), with a 10% (vol/vol) glutaraldehyde prefixation step (26). Immunoprecipitation Selected FSH isoform preparations were iodinated by the lactoperoxidase method (27), and aliquots were immunoprecipitated using rabbit hFSHol (NIDDK anti-hLuFSH-1), hFSH/3 (NIDDK anti-hpFSH-l), and hFSH (NIDDK anti-hFSH-6) antisera at dilutions of l:lO,OOO in 50 mM Tris-HCl (pH 7.4), 600 mM NaCl, and 0.5% Triton X-100, as described by Goding (28). Labeled antigen-antibody complexes were incubated (16h) with sheep antirabbit immunoglobulin (Silenus Laboratories, Melbourne, Victoria, Australia) diluted 1:5 in Tris buffer, followed by the addition of 10% (wt/vol) S. aureus cells (Calbiochem, La Jolla, CA) and incubated for 16 h at room temperature. The tubes were centrifuged, pellets were boiled in SDSPAGE sample buffer under reducing conditions, and the supernatants were run on SDS-PAGE (24). The radioactivity was detected by autoradiography. Amino
acid analysis
Samples for amino acid analysis were lyophilized and hydrolyzed in uacuo in constantly boiling 6 M HCl containing 0.2% (wt/vol) phenol for 22 h at 110 C. Samples (typical replicate, n = 3) were then analyzed by the Picotag method (Millipore) (29). With each analysis, HPAC hFSH and individual hFSH isoforms were included to monitor the consistency of mass recovery and amino acid composition. To assess recoveries, aamino butyric acid (Sigma) was added as an internal standard to each sample before hydrolysis. Hydrolysis losses and mass yields of individual amino acids were determined in separate experiments by the repeated analysis (n = 6) of horse heart myoglobin (22-h hydrolysis; Sigma) and horse heart cytochrome-c (hydrolyses for 24, 48, and 72 h; Sigma). These experiments demonstrated a 24-h hydrolysis loss of tyrosine (26%), threonine (3%), histidine (6%), and lysine (4%), which was associated with an overall 4% decrease in protein mass. Extrapolation to establish the amino acid composition at 0 h gave a similar composition to published values (data not shown). No corrections for these losses were made in the analysis of data for the composition and determination of mass of the hFSH isoforms.
OF hFSH Hormone
Endo - 1992 Voll30. No 5
assays
hFSH isoforms were measured by RRA (30), using calf testis membranes as receptor source and the 1st IS for hFSH (83/ 575) as standard. An in-house highly purified hFSH isoform pool, corresponding to the D p1 region (~14.25) obtained before fractionation by IEX at pH 6.0, was iodinated by the lactoperoxidase procedure (27) and used as tracer. In brief, the incubation mixture, in a volume of 800 ~1 [200 ~1 sample/standard, 100 ~1 tracer (10,000 cpm), and 500 ~1 testicular membrane], was incubated at 25 C for 20 h. The tubes were centrifuged at 2,500 X g for 45 min, and the pellets were counted in a ycounter. The purity of the iodinated hormone was assessed from its profile after fractionation on an Ultrogel ACA 54 (LKB) column (90 X 1.6 cm) in 10 mM phosphate, pH 7.4, containing 154 mM NaCl and 0.2% BSA (13). The specific activity of the tracer, as determined by a self-displacement procedure in the RRA (31), was 36 &i/pg. Specific binding of isoform D tracer to an excess of membrane was 65%. In routine assays, a membrane dilution giving 25% binding with nonspecific binding [assessed by the addition of 1 IU pituitary hFSH (HPAC)] of 1.5-2% was used. The between-assay variation, as assessed from the coefficient of variation of repeated analysis of a purified hFSH preparation, was 6.8% (n = 9). The withinassay variation based on the mean index of precision was 0.049 (n = 9). To equate potencies in terms of the previous 1st and 2nd IRP of human pituitary FSH and LH (69/104 and 78/549), a factor of 0.388 should be applied (11). hLH was determined by LH RRA (32) with the 2nd IRP for hLH and hFSH as standard, and hCG (CR 121, a gift from the NIDDK, Baltimore, MD), iodinated by the chloramine-T procedure as tracer. Nonspecific binding was assessed with a crude hCG preparation (10 IU; Pregnyl, Organon, Oss, Holland). The membrane binding of [?]hCG in the assays ranged from 1250%. The between-assay variation, as assessed from the coefficient of variation of the repeated analysis of a purified LH preparation, was 21.4% (n = 36). The within-assay variation, as assessed from the mean index of precision (X) was 0.045 (n = 36). The LH in vitro bioassay of Van Damme et al. (33) was used, based on the LH-induced production of testosterone by mouse Leydig cells in culture. The 1st IRP for human pituitary LH (68/40) was used as standard. TSH immunoactivity was estimated using a double antibody RIA procedure with reagents provided by the NIDDK. The 2nd IRP for human pituitary TSH for bioassay was used as standard, with hTSH antiserum (batch 3) and [iZ51]hTSH (I-5) as tracer. The between-assay variation was 14.9% (n = 16), and the within-assay variation (X) was 0.056 (n = 16). Statistical
analyses
Parallelism between standard and unknown preparations in the various assays was established by two-way analysis of variance of the slope values of the linearized dose response after log dose transformation. Potency estimates were then determined using standard bioassay statistical designs (34). In situations where nonparallelism was observed between the dose-response line of the sample and that of the standard, a logit 0 value (equivalent to EDso) of the unknown in terms of
ISOFORMS the standard was determined. In situations where activities were determined at one dose level against the standard, the reiterative line-fitting procedure of Burger et al. (35) was used. Peritz’s multiple range test was used for assessingdifferences betweengroups(36).
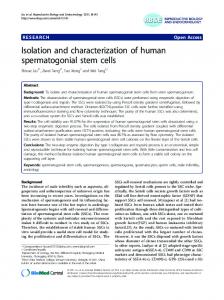
Results Isolation of hFSH isoforms Sephacryl S200. The high speed supernatant fraction of human pituitaries was initially fractionated by gel filtration chromatography on Sephacryl S200, with removal of the bulk of the lower mol wt compounds and free hormone subunits (Fig. 1). LH and TSH eluted together with FSH (data not shown), with 78% recovery of FSH radioreceptor activity (Table 1). The hormone-containing fractions were pooled and lyophilized before preparative IEF.
Initial fractionation by gel filtration:
Preparative IEF. The lyophilized
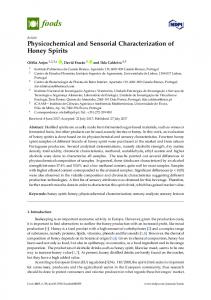
fraction was fractionated by preparative IEF on a sucrose density gradient of carrier ampholytes in the pH 3.5-10 range, and typical activity profiles for FSH, LH, and TSH are shown in Fig. 2, a and b. The FSH-containing region (p1 3.655.50), shown on an expanded axis in Fig. 2c, was partitioned into six p1 regions of activity (regions A-F, Table l), with recoveries of FSH radioreceptor activity of 82% (Table 1). TSH immunoactivity (Fig. 2b) was eluted as five major components over the p1 range 5.4-8.4, although immunoreactivity corresponding to a number of minor components was also detectable in the regions of p1 4.0-5.4 bSA
OVA
MY0 I
OF hFSH
and 8.4-9.1. Five major peaks of LH radioreceptor ity (Fig. 2a) were detected in the p1 7-9 region.
640
800
960 VOLUME
1120
1280
(ml)
FIG. 1. Gel filtration chromatography of a human pituitary extract. A sample of the human pituitary high speed supernatant (93 ml) was loaded onto a Sephacryl S200 column (86 x 5 cm). FSH and LH activities were determined using the respective RRAs, and fractions between 652-1044 ml were pooled, as indicated by the bar, and lyophilized. LH and TSH activities eluted in a similar volume as FSH activity (data not shown). The elution volumes of standard proteins are indicated: BSA (bSA), 68K; ovalbumin (OVA), 43K; and myoglobin (MYO), 17.3K.
activ-
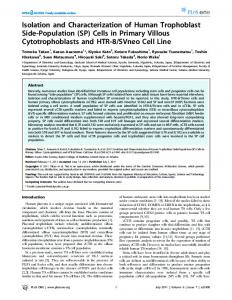
Sephadex G-100. Gel filtration chromatography on Sephadex G-100 was used to remove the bulk of the higher mol wt proteins and carrier ampholytes from FSH regions A-F and to preequilibrate the FSH samples into the initial buffer for the first ion exchange step (Fig. 3, data for FSH zone D shown only). Differences in the observed size exclusion partition coefficient (K,,) for each of the six FSH p1 regions after Sephadex G-100 chromatography are presented in Table 1. The recovery of FSH radioreceptor activity was 93% (range, 91-96%; n = 6; Table 1). Gel filtration:
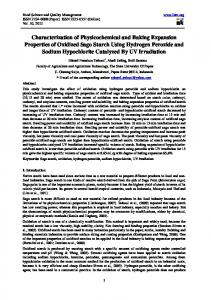
pH 9.6. HPIEX at pH 9.6 of the six FSH p1 regions resulted, in each case, in the elution of a complex broad peak of FSH activity (Fig. 4). No activity was found in the 1-M NaCl fraction at the end of the gradient run. The average recovery of FSH activity for all FSH regions after HPIEX at pH 9.6 was 87% (n = 6; Table 1).
HPIEX,
pH 6.0. SDS-PAGE analysis of the FSH-containing fractions from all zones after HPIEX at pH 9.6 revealed the presence of several, probably unrelated, coeluting proteins (data not shown). A series of preliminary studies using the Mono-Q column and eluents of decreasing pH (data not shown) demonstrated that the chromatographic selectivities of these contaminants could be manipulated (21) such that they eluted with different retention times from that of FSH p1 regions. The optimal pH found to give this separation was pH 6.0. All FSH p1 regions were rechromatographed on the Mono-Q column at pH 6.0 (Fig. 4b) to remove these contaminants. The yield of FSH activity was 86% (n = 6; Table 1). At this stage, individual FSH isoform pools were prepared (Fig. 4b). Each isoform pool was then rechromatographed on the same column under identical conditions at pH 6.0, confirming the separation of the individual pools (Fig. 4~). Twenty FSH isoforms from the six p1 regions were prepared in this manner and are denoted FSH Al-A5, Bl-B3, Cl-C3, Dl-D3, El-E4, and Fl-F2 (Table 1).
HPIEX,
chromatography. The final step in the purification of the 20 FSH isoforms was high performance gel filtration chromatography using a TSK G3000SW column. Representative chromatograms for the FSH isoforms are given in Fig. 5, a and b, and show the separation of a 45K component (fractions 47 and 48, Fig. 5a) from FSH (fractions 52-56) and lower mol wt components. All isoforms from regions B-F and isoform A5 chromatographed as single FSH-active peaks; however, a second FSH peak of apparent lower mol wt was present in minor amounts in isoforms A4 and A3
High performance gel filtration 0
2823
2824 TABLE
ISOFORMS 1. Recoveries
of FSH
radioreceptor
Procedure Starting material GF-S200 PREP IEF Zone
FSH 15,700 12,300 10,050
pI 3.63 Total
activity
IU
4,620 (pH 9.6) 4,400 (pH 6.0), run 1 4,050 (pH 6.0), run 2 1 596 2 1,256 3 910 4 634 5 88 3,480
GF-TSK Isoform Isoform Isoform Isoform Isoform Total
1 2 3 4 5
throughout Recovery
the isolation
Endo. Vol130.No5
procedure
(% )
100 78.3 82 A (3.50-3.75)”
4,810
GF*GlOO HPIEX HPIEX HPIEX Isoform Isoform Isoform Isoform Isoform Total
activity
OF hFSH
(96)’ (95) (92)
[0.161d
(79) (93) (89) (78) (81) (86)
I3 p1 3.88 (3.76-4.00) 2,490
C p1 4.07 (4.01-4.14) 1,430
D pI 4.23 (4.15-4.32) 750
E p1 4.84 (4.74-4.94) 460
F p1 5.13 (4.95-5.29) 150
2,230 (90) 1,960 (88) 1,740 (89)
1,260 (88) 1,020 (81) 846 (83)
690 (91) [0.24] 670 (97) 586 (85)
430 (93) [0.19] 320 (75) 276 (85)
140 (93) [0.20] 100 (71) 82 (82)
204 (74) 60 (68) 174 (76)
36 (79) 106 (83) 74 (82)
[0.19]
485 (82) 467 (75) 447 (84)
[0.18]
229 (73) 159 (65) 236 (82)
34 (78) 28 (73)
8 (72) 1,400
(80)
624 (79)
438 (75)
460 (95) 374 (80) 395 (88)
198 (86) 121 (76) 188 (80)
183 (90) 44 (73) 162 (93)
507 (81)
389 (89)
224 (81)
62 (75)
G3000SW 543 1,190 683 582 76 3,080
(91) (95) (75) (91) (86) (88)
1,230
(89)
’ pI is given as the midpoint, with the range in parentheses. * GF, Gel filtration. c Numbers in parentheses are the percent yields for each step. d K., for the Sephadex G-100 column, where K., = (V, - V,)/(V, of column, and V, is the total included, volume of column.
and as a marked peak in A2 and Al (Fig. filtration distribution coefficients (K,,) of forms are presented in Table 3. Recoveries ity from the TSK G3000SW column were see Table 1).
- V,),
5b). The gel the FSH isoof FSH activ85% (n = 20;
Characterization of FSH isoforms Amino acid composition. The amino acid compositions
of the 20 hFSH isoforms and that of the NIH and HPAC hFSH preparations are presented in Table 2. A comparison of the combined amino acid composition for all isoforms with the NIH hFSH preparation showed a significant (P < 0.05) difference in mole percentage for glutamic acid. This was also seen in the comparison with the HPAC hFSH preparation, with significantly (P < 0.05) different mole percentages of glutamic acid, serine, histidine, and threonine. A comparison of amino acid composition between p1 regions showed significant (P < 0.05) differences in mole percentages of aspartic acid, serine, threonine, alanine, and tyrosine. SDS-PAGE. The apparent
mol wt of the FSH isoforms, as established on SDS-PAGE under reducing conditions, showed differences between all p1 regions in terms of the mol wt range of the diffuse staining zone (19.0-26.010
where
V, is the elution
30 (85) 95 (89) 63 (84) 6.3 (78)
28 (83) 22 (80)
194 (87)
volume
of the FSH
50 (82)
peak,
V, is the void
volume
for each isoform and the presence of distinct bands within the diffuse staining zone (Table 2 and Fig. 6). Higher mol wt bands (29-36K) were present in isoform preparations from p1 regions E and F. No discernible difference in band pattern was observed within pI regions B, C, D, or E, while changes in apparent mol wt were noted between Al and A5. SDS-PAGE of the NIH I-3 and HPAC hFSH preparations showed the presence of a similar diffuse staining zone (Table 3), with a number of higher mol wt bands (Table 3 and Fig. 6). In an attempt to identify whether the high mol wt bands (29-36K), present in hFSH isoforms from pI regions A and E were FSH related, the isoforms A4, E3, and D (a combined Dl, D2, and D3 preparation) were iodinated and immunoprecipitated with independantly prepared antisera to hFSH, hFSHa, and hFSH@. As shown in Fig. 7, the hFSH antisera precipitated broad bands of l&O-25.5K mol wt in isoform A4 and 18.0-23.0K mol wt in isoform E3, similar to the diffuse silver-staining pattern observed with the noniodinated isoforms (Fig. 6). A faint band of 33.5-36.0K mol wt was also apparent in the three isoforms (Fig. 7; results for isoform D not included). Immunoprecipitation with hFSHa antiserum detected only the l&O-25.5K band Immunoprecipitation.
ISOFORMS
OF hFSH
2825
0.12
400 f
0.08
z
P 5 ? 3
2ooE
0.04
I! 0
0
0
10
20 FRACTION
30
40
50
NUMBER
FIG. 3. Gel filtration
chromatography. FSH pI region D from IEF was chromatographed on a Sephadex G-100 column (95 x 2.6 cm). Collected fractions containing FSH activity were pooled, as indicated by the solid bar. The elution positions of standard proteins are indicated: ovalbumin (OVA), 43K; and carbonic anhydrase (CA), 29K. V,,, Void volume (blue dextran).
3
4
5
6
7
6
9
10
PH
4
5
6
PH
FIG. 2. Preparative
IEF. IEF profiles of hFSH, hLH, and hTSH. a, FSH and LH activities, as determined by RRAs; b, UV profile at 280 nm and TSH immunoreactivity profile; c, expanded FSH activity profile from a second IEF experiment. The FSH zones A-F used for subsequent fractionation are marked.
(Fig. 7), while immunopreciptation with hFSHp antiserum indicated the presence of both the l&O-25.5K and 33.536.OK bands (Fig. 7). Specific activities of FSH isoforms. Significant
differences in the slope values of the logit log dose transformed response lines were observed between hFSH isoforms (Fig. 8), with isoform regions A, B, and C significantly (P < 0.001-0.05) different from groups D, E, and F. Since the slope value for the standard (83/575) was comparable to those of groups A-C, parallel line statistics were used in determining potencies within these groups, while the determination of potencies in the hFSH isoform regions
D, E, and F was based on a comparison of EDs0 values between sample and standard. The FSH radioreceptor specific activities of the 15 highly purified isoform preparations ranged from 7,81056,300 IU/mg protein (Table 3), while the 5 less pure preparations showed activities between 7,820-32,800 IU/ mg. Significant differences were observed both within isoform groups and between groups (A and F). A comparison of the specific activity of the pituitary high speed supernatant starting material (3.75 IU/mg protein) with the most potent hFSH isoform (A3) showed a purification factor of 15,000-fold. The LH in vitro bioactivity for the FSH isoforms ranged between 36-237 IU/mg protein, with an average activity of 120 IU/mg protein (Table 3). Discussion
Twenty isoforms of hFSH have been isolated from human pituitaries using a new purification procedure under mild conditions. These hFSH isoforms are considered to be highly purified based on their high FSH radioreceptor activities and comparable SDS-PAGE staining patterns and amino acid compositions. This is the first study to isolate from the same pituitary extract a large number of hFSH isoforms to near homogeneity in a nonselective manner and in sufficient quantities to permit further structural and biological characterization. The hFSH purification procedure used in this study exploits two purification techniques for the discrimination of key differences in the charge characteristics of closely related proteins, such as the glycoprotein hormones. The procedure consists of the combination of IEF and IEX, with several gel filtration steps used primarily for buffer exchange. As the first dimension, IEF separates proteins based on the pH at which they exhibit zero net charge in an electric field (i.e. the isoelectric
2826
ISOFORMS
OF hFSH
Endo. 1992 Vol130 -No 5
SO
I
50 0.025
I
3. =
100
40 I N 2 !
3 G
2 cc
d a
0
0 I
E
E
50
0.025
40
0.025
2000
0
0 0
40
20 FRACTION
0
20
40 FRACTION
60
-I
60
NUMBER
FIG. 4. HPIEX.
All hFSH p1 regions were chromatographed on a Mono-Q anion exchange column at pH 9.6. a, Shown are the UV and FSH radioreceptor activity profiles for pI region B, with the gradient from O-100% buffer B represented as a broken line. FSH-containing fractions were pooled, as indicated by the vertical bars. The arrow marks the addition of 1 M NaCl to the mobile phase. b, Rechromatography at pH 6.0 of the FSH p1 region B collected at pH 9.6. FSHcontaining fractions were pooled into isoforms (Bl, B2, and B3), as indicated by the vertical bars. c, Rechromatography at pH 6.0 of the FSH isoforms Bl, B2, and B3. For further details, see Materials and Methods.
point, PI). In contrast, resolution of proteins by IEX is determined by the location of charged groups on the surface of the protein (37). Advantage can, therefore, be taken of the salt and pH dependancies shown by closely related proteins in their ion exchange chromatographic and electrophoretic mobility behaviors. The framework to establish such tandem integrated preparative procedures has recently been described in detail (38). An example of the high resolving power that can be achieved when these protein charge-based procedures are used in tandem can be seen, for example, in the isolation of isoforms Bl, B2, and B3. Initially, FSH activity associated with these isoforms was resolved by IEF over a narrow p1 range (pH 3.75-4.0), yet after fractionation by HPIEX, proteins were identified over a large salt gradient range (O-340 InM). The resolution of the tandem IEF/IEX scheme can be
SO
SO
NUMBER
FIG. 5. High performance gel filtration chromatography. All FSH isoforms were individually chromatographed on a TSK G3000SW column. Representative UV and FSH activity profiles from two of these runs are shown here (a, isoform B3; b, isoform A2). Fractions were collected as indicated by the solid bars. The column was also calibrated with standards of known mol wt: ovalbumin (OVA), 43K; carbonic anhydrase (CA), 29K; and cytochrome-c (CC), 11.7K. VO, Void volume (blue dextran); V,, total volume (NaN3).
further enhanced by manipulation of the selectivity of the ion exchange column by modifying the buffer pH, ionic strength, or nature of the counter ion (21, 39, 40). These parameters have been exploited in the present purification scheme by the initial IEX of FSH p1 regions at pH 9.6, followed by rechromatography at pH 6.0 on the same ion exchanger. As an example, the rechromatography of hFSH isoforms from p1 region B at pH 6.0 resulted in further purification. These findings highlight the differences in protein separation based on IEF and IEX and demonstrate the advantages of applying these techniques in tandem, particularly with heterogeneous proteins. As evidenced from the results, a considerably greater resolution of hFSH isoforms has been achieved with this multidimensional method compared to currently published procedures (2,3,9), although it is not claimed that the current procedure isolates all hFSH isoforms. Asymmetric peaks were observed for some of the isoforms at the final IEX step, indicating that absolute isoform purity was not obtained. In these cases, finer peak cutting or modification of the ion exchange elution parameters would be anticipated to improve resolution. Based on these results, the number of hFSH isoforms
ISOFORMS TABLE
QY
His -4%
Thr Ala Pro 'br
Val Met Ile Leu Phe
2827
2. Average amino acid composition of FSH isoforms expressed as a mole percentage hFSH” (cDNA)
Asp Glu Ser
OF hFSH
8.33 10.56 8.33 5.56 3.33 4.44
11.11 6.11 6.67 6.11 7.22 2.22
3.89 5.00
3.89
HPAC 84/l (n = 6) 8.62 10.56 8.22 9.83 2.39 3.87
(0.49) (0.95)d (1.66)d (0.80) (0.36)d (0.40)
NIH I-3 (n = 3) 8.46 10.72 5.52 10.68 2.03 4.46
All isoforms (i = 20)
p1 isoform region Al-5
(0.89)
8.50 (1.25)
(0.64)d (1.05)e (4.57) (0.08)' (0.90)
9.05 (0.91)e 8.54 (0.44) 6.34 11.24 1.56 4.15
(1.15)e (2.60) (0.46)e (0.84)
8.48 (0.58)* 7.20 9.25 1.84 3.98
(0.44)*,' (1.83) (0.42) (0.70)
Bl-3
Cl-3
Dl-3
El-4
10.78 (1.64)"
7.97 (0.29)* 9.47 (0.46)
8.06 (0.62)* 9.00 (1.13) 6.04 (0.61)*~'
5.12 (0.42)*
7.69 (0.46)*,"
8.04 (0.80)* 8.33 (0.70) 5.17 (1.38)*~'
9.60 (0.67)
13.67 (3.89)
11.61 (3.33)
12.81 (1.44)
1.62 (0.14) 3.32 (0.48)
1.40 (0.54) 4.20 (0.59)
1.74 (0.41) 3.93 (0.89)
1.21 (0.64) 5.02 (0.93)
6.42 6.52 2.98 7.67 2.27 5.98 6.95 3.88 6.44
10.18 (1.09)
7.75 (0.75)d
6.17 (1.34)d*’ 5.86 (1.11)’ 6.81 (0.83)’
5.98 (0.22)*,”
6.26 7.54 3.15 7.95 1.53 4.57 7.01 4.50 6.34
(0.55) (0.98)
5.59 (0.28) 7.04 (1.50)
6.72 (1.05)
(0.99)
4.19 (0.83)
3.33 (0.72)",'
(0.45) (0.43) (0.46) (0.32) (0.43) (1.24)
8.36 1.87 5.42 7.74 5.03
3.64 (1.12) 9.66 (3.16)
5.48 (0.85)* 5.72 (0.99) 4.30 (0.65)*~"
5.99 (1.13) 7.45 (1.29)
6.89 (1.40)
(2.01) (0.73) (0.82) (0.47) (0.78)
6.74 (0.89)*,'
6.98 (1.19) 7.45 (0.82) 9.13 (0.90) 1.90 (0.60) 2.44 (0.51) 6.77 (0.47) 4.09 (0.91) 5.00 (0.98)
Fl-2
12.43 (4.86) 1.61 (0.62) 6.03 6.73 3.65 7.17
(0.18) (1.06) (0.80) (1.60)
6.20 (1.84)*~’ 4.51 (1.07)* (0.30)bsc 6.34 (1.59)*,’ (1.48) (1.16)*,' (1.07) (0.53) (1.43) (1.67) (0.44) (0.87)
6.80 5.08 12.31 1.77 6.01 7.69 4.39 6.11
(1.05) (1.23)' (5.46) (0.25) (0.81) (1.63) (1.06) (2.45)
7.52 (0.79)* 9.23 (0.09) 6.34 (&go)b~c
11.39 (0) 1.46 (0.18) 4.35 (0.82)
5.55 (0.25)b.c 5.40 (0.60)“’ 7.62 (0.39)‘f 7.76 (O.lO)‘f 7.57 2.59 8.04 1.34 5.29 8.72 3.51 7.46
(1.33) (0.24)* (1.61) (0.46) (1.05) (0.57) (0.27) (0.93)
7.48 4.41 9.04 1.70 5.10 8.13 3.50 5.88
(1.36) (0.40)" (1.27) (0.57) (0.04) (2.10) (0.89) (0.38)
7.22 6.19 (1.84) 6.53 (1.30) 5.99 (0.89) n, Number of analyses; i, total number of isoforms. * us. ’ vs. /, P < 0.05. d us. e, P < 0.05. n Published mole percentage of hFSH from cDNA sequences, excluding Cys and Trp residues (hFSHp from Ref. 46; hFSHa from Ref. 47).
LYS
FIG. 6. SDS-PAGE of FSH isoforms. FSH isoforms (-500 ng) were electrophoresed by SDS-PAGE under reducing conditions in 16% gels and silverstained. The migration positions of standard proteins of known mol wt (kilodaltons) were as indicated. Double staining bands of approximately 50-55K were seen in the blank (bl) lanes where SDS-sample buffer only was loaded. Pit ext, Soluble extract of human pituitary used as starting material.
684329,
in pituitary extracts must be greater than 20. Attempts to establish the extent of homogeneity of these isoforms, and, therefore, the total number of isoforms within pituitary extracts, by analytical IEF in flat-bed polyacrylamide gels in this laboratory have been unsuccessful due to the limited amounts available of each isoform and the insensitivity of current silver-staining methods for hFSH (Stanton, P. G., unpublished observations). The hFSH isoforms obtained in this investigation were derived from the total FSH population present in a pool of unselected human pituitaries, and therefore, the number of hFSH isoforms isolated reflects the isoform composition of pituitaries of different sex- or age-dependent status (41). However, similar levels of heterogeneity have also been observed in single human pituitaries (42). Moreover, Wide (42) has shown that hFSH isoforms of
C”‘““”
6843* 29, 17.3 11.7
i
--
68, 43e-\\
\
29,
Iy p” \
17.3-
\
,N- *T I
similar net charge from different pituitary sources exhibit different ratios of biological/immunological activities, indicating different FSH subtypes and, therefore, distinct molecular structures of the hormone. It would be anticipated that further resolution of these subtypes would be possible using the IEF/IEX tandem procedure described here. Recent studies by Green and Baenziger (5, 7) have shown that the carbohydrate moieties of pituitary-derived hFSH are highly heterogeneous, consisting of at least 11 branched sialylated oligosaccharide structures and 3 branched sulfated structures that contribute to the overall charge of the molecule (5). The precise determination of which of these carbohydrate moieties is attached at the four different glycosylation sites of hFSH has yet to be made, and therefore, the extent of FSH heterogeneity may be much greater than
2828 TABLE
ISOFORMS 3. Mol
wt and specific
Isoform pI 3.63 Al A2 A3 A4 A5 p1 3.88 Bl B2 B3 p1 4.07 Cl c2 c3 pI 4.23 Dl D2 D3 p1 4.85 El E2 E3 E4 p1 5.13 Fl F2 NIH hFSH I-3 HPAC hFSH”
activities
(SA)
of FSH
K.“”
OF hFSH
Endo. Vol130.
isoforms Mol
LH in vitro bioassay UU/md
wt (kilodaltons) by SDS-PAGE [bands (range)]”
FSH
23.5, 23.5, 22.5, 22.5, 22.5
30,800 42,200 56,300 43,000 24,800
(170) (1,100) (2,000) (400) (1,000)
92 61