© 2000 Nature America Inc. • http://structbio.nature.com
letters Crystal structures of Escherichia coli phytase and its complex with phytate
Phytases catalyze the hydrolysis of phytate and are able to improve the nutritional quality of phytate-rich diets. Escherichia coli phytase, a member of the histidine acid phosphatase family has the highest specific activity of all phytases characterized. The crystal structure of E. coli phytase has been determined by a two-wavelength anomalous diffraction method using the exceptionally strong anomalous scattering of tungsten. Despite a lack of sequence similarity, the structure closely resembles the overall fold of other histi-
dine acid phosphatases. The structure of E. coli phytase in complex with phytate, the preferred substrate, reveals the binding mode and substrate recognition. The binding is also accompanied by conformational changes which suggest that substrate binding enhances catalysis by increasing the acidity of the general acid. Phytate (myo-inositol 1,2,3,4,5,6-hexakisphosphate) is the primary form of phosphate storage in the seeds of cereals and legumes1. However, phosphorous in this form is essentially unavailable to animals such as pigs and poultry, necessitating costly supplementation of animal feeds with inorganic phosphorous. Phytate that is not assimilated by animals can also lead to environmental problems from increased levels of phosphorous in manure. Furthermore phytate in feeds interferes with the absorption of important nutrients by forming insoluble complexes with proteins and metal cations such as iron and calcium2. Phytases catalyze the hydrolysis of inorganic phosphate from phytate and are able to increase the bioavailability of the endogenous phosphorous in feeds and reduce the antinutritional effects of phytate. The PhyA phytase from Aspergillus niger NRRL 3135 (Aspergillus ficuum) is currently in use as a commercial feed additive3.
a
c
Daniel Lim1, Serguei Golovan2, Cecil W. Forsberg2 and Zongchao Jia1
© 2000 Nature America Inc. • http://structbio.nature.com
1Department of Biochemistry, Queen’s University, Kingston, Ontario K7L 3N6, Canada. 2Department of Microbiology, University of Guelph, Guelph, Ontario N1G 2W1, Canada.
b
(ii)
(i)
(iii)
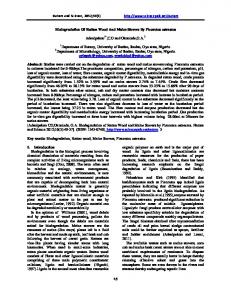
Fig. 1 The three-dimensional structure of E. coli phytase and comparison to other related structures. a, A prominent central cavity divides the protein into an α-domain (red) and an α/β-domain (blue). The α/β-domain contains a twisted seven-stranded β-sheet of mixed topology with two α-helices on each side of the β-sheet. The α-domain is predominantly made up of α-helices but also contains a β-hairpin structure (strands 6 and 7) that forms part of the rim of the binding pocket. The four disulfide bonds are shown in yellow. The N- and C-termini are labeled as N and C, respectively. Helices are labeled with capital letters, while β-strands are labeled with numerals. A stick model of phytate is shown with its 3-phosphate (red) in the active site. b, Stereo view of the Cα trace of E. coli phytase. The color scheme is the same as in the ribbon diagram. c, A comparison of the structures of (i) E. coli phytase (ii) A. niger phytase and (iii) rat prostatic acid phosphatase. The α/β-domain, which consists of the main β-sheet and surrounding α-helices, are well conserved among the three structures. A comparison of the α-domains of the phytases from E. coli and A. niger and the rat prostatic acid phosphatase shows a number of structurally homologous helices, which are topologically identical and have been colored the same in all three structures. Helices were labeled using capital letters for E. coli phytase, small letters for A. niger phytase, and numerals for rat prostatic acid phosphatase. A unique feature of the α-domain in E. coli phytase is a β-hairpin structure (dark blue). The helices colored in orange belong to the α/β-domain and are oriented such that the helix dipole can assist binding of the scissile phosphate at the active site. All figures were prepared using the programs MOLSCRIPT30 and RASTER3D31, unless otherwise stated.
108
nature structural biology • volume 7 number 2 • february 2000
© 2000 Nature America Inc. • http://structbio.nature.com
letters An acid phosphatase isolated from the periplasm of Escherichia coli is highly specific for phytate4 and has the highest specific activity of any phytase characterized3. Its specific activity is almost eight-fold higher than that of the A. niger phytase5. This 44 kDa phosphatase from E. coli (hereafter referred to as E. coli phytase) is therefore of potential commercial interest. E. coli phytase is a member of the histidine acid phosphatase family. This group of enzymes have acidic pH optima and contain the conserved sequence motif RHGXRXP at the active site. This active site motif has been found in a number of phosphatases of medical interest6. Catalysis is a two-step process consisting of a nucleophilic attack on the phosphorous atom by the histidine in the active site motif, followed by hydrolysis of the resulting phospho-histidine intermediate7,8. The mechanism is supported by mutagenesis studies9,10 and crystal structures of transition state analog complexes11, which have also shown that a conserved aspartic acid residue is the proton donor to the leaving group oxygen10,11.
© 2000 Nature America Inc. • http://structbio.nature.com
a
b
c
d
nature structural biology • volume 7 number 2 • february 2000
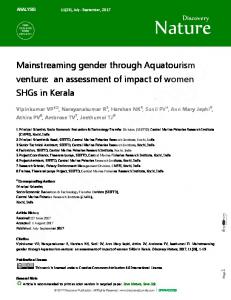
The crystal structures of a number of histidine acid phosphatases have been determined: the prostatic acid phosphatases from rat12 and human13; and two acid phosphatases from A. niger: the PhyA phytase14 and the pH 2.5 acid phosphatase15. The structures of the rat and human prostatic acid phosphatases are nearly identical, while the structures of the A. niger acid phosphatases are highly similar. Here, we report the 2.05 Å crystal structure of E. coli phytase. Despite the lack of sequence similarity with other histidine acid phosphatases beyond the active site, E. coli phytase is structurally similar to the prostatic and A. niger acid phosphatases. These structures contain a conserved α/β- domain and a variable α-domain. The active site is located at the interface between the two domains. Differences in substrate binding have been attributed to differences in the α-domains14,15. Using an active site mutant, we have determined the crystal structure of E. coli phytase in complex with phytate, which provides the first enzyme–substrate complex of a histidine acid phosphatase. A number of conformational changes that occur upon phytate binding suggest that the binding of an appropriate substrate can enhance catalysis and provide a possible basis for the observed specificity for phytate4. Overall structure The crystal structure of E. coli phytase was determined by the multi-wavelength anomalous diffraction (MAD) method. Data collected from a tungstate-derivatized crystal at only two wavelengths produced an electron density map of excellent quality. The structure was determined in two crystal forms, namely the acidic and mercury forms. Crystals of the acidic form were grown at pH 4.5, the pH optimum of the enzyme, while crystals of the mercury form were grown at pH 6.6. The tungstate and phytate complexes were determined in the mercury crystal form. In order to obtain the phytatebound complex at a near optimum pH, the inactive mutant crystals grown at pH 6.6 were first equilibrated at pH 5.0, and phytate was then soaked into the crystals at pH 5.0. The structures from the acidic and mercury forms are essentially identical, with a root mean square (r.m.s.) deviation of 0.39 Å between identical Cα atoms. Fig. 2 Phyate and tungstate binding. a, A 2.05 Å 2Fo - Fc electron density map contoured at 1 σ in which the substrate phytate was omitted during calculation. Phytate with the 3-phosphate in the active site (colored by atom type, red labels) best accounts for the density. A superposition of phytate with the 6-phosphate in the active site is shown in purple. The only significant structural differences are at the 1- and 2-positions. b, Fo - Fc difference map at the 1-position for phytate bound with the 6-phosphate in the active site (purple). In this orientation, positive density (3 σ) at the 1-position indicates disagreement between the model and the map. However, phytate with the 3-phosphate bound at the active site (yellow) can fully account for the positive difference density. c, Phytate complex of E. coli phytase. The coloring of the phytate molecule is based on refined individual atomic temperature factor values and shows a gradient of ordered (blue) to less ordered regions (red). At the active site the scissile 3-phosphate is coordinated by the side chains of Arg 16, Arg 20, Arg 92 and His 303 and by the amide nitrogen of Asp 304. His 303 is hydrogen bonded to Asp 88, which enhances binding of the scissile phosphate. Asp 304 is in a suitable position to act as the proton donor. The 4- and 5-phosphates are involved in a number of water-mediated interactions. d, Tungstate complex. The position of tungstate in the active site is similar to that of the scissile phosphate in the phytate complex. The tungstate complex was obtained with active enzyme and shows how His 17 would be positioned for a nucleophilic attack on the scissile phosphate. Fig. (a) and (b) were prepared with the programs Xtalview24 and RASTER3D31.
109
© 2000 Nature America Inc. • http://structbio.nature.com
letters a
b
© 2000 Nature America Inc. • http://structbio.nature.com
Fig. 3 Binding pocket and interaction with phyate. a, A GRASP32 electrostatic surface representation of the substrate binding pocket of E. coli phytase with potentials ranging from -20 V (red) to +20 V (blue). A stick model of phytate is shown in the binding pocket. Positive charges are concentrated at the region of the scissile phosphate. b, Schematic diagram of the interactions involved in phytate binding.
There are four disulfide bonds in E. coli phytase involving all eight Cys (Fig. 1a,b). A large cavity divides the structure into two domains. The lower domain contains a central β-sheet of mixed topology with two α-helices on each side and is clearly homologous to the α/β-domains of the prostatic acid phosphatases and the A. niger acid phosphatases. Similar to these other structures, the α-domain of E. coli phytase consists of two central α-helices (I, J) that partly define the substrate binding region with a number of helices and loops packed around them. However, the α domain of E. coli phytase also contains a unique β-hairpin structure lining the rim of the binding pocket opposite the active site. Structural comparisons of E. coli phytase with A. niger phytase and with the rat prostatic acid phosphatase were made with the program ALIGN16. The r.m.s. deviations for structurally equivalent Cα atoms are 2.8 Å and 2.1 Å, respectively. In addition to the high degree of similarity of the α/β-domains, four groups of homologous helices in the α-domains (corresponding to helices J, D, E+F and I in E. coli phytase) can be identified based on a visual comparison of the three structures (Fig. 1c). In the two phytases, helices A and a are topologically equivalent and similarly positioned in the overall structures. Phytate binding An inactive mutant of E. coli phytase was constructed by mutating the nucleophile His 17 to Ala. The loss of activity was confirmed by an assay of the mutant for phytate hydrolysis. Phytate complex crystals were prepared at pH 5.0 and data were collected to 2.05 Å resolution. At pH 5.0, the activity of E. coli phytase is approximately 90% of the activity at the pH optimum of 4.5 (ref. 4), so that phytate is expected to be bound similarly at pH 4.5 and 5.0. A difference map showed strong and unambiguous electron density for all six phosphate groups of phytate (Fig. 2a). Biochemical analysis of hydrolysis intermediates has shown that E. coli phytase preferentially hydrolyzes the 6-phosphate of phytate4. However the electron density in both Fo - Fc and 2Fo - Fc omit maps (Fig. 2b) clearly indicates that phytate was bound with its 3-phosphate in the active site. The main observable difference is at the position adjacent to the scissile phosphate (2phosphate in the observed binding mode). If phytate is modeled with the 6-phosphate in the active site, positive difference density is observed at this position, which cannot be accounted for by the model. However phytate modeled with the 3-phosphate in the active site fully accounts for this density (Fig. 2b). Although the discrepancy in the electron density maps is clear, the overall 110
structural difference is very small, and there is no obvious difference in terms of observed interactions. Hence there is no apparent structural explanation as to why one orientation is preferred over the other. The scissile phosphate is coordinated by Arg 16 and Arg 20 from the RHGXRXP motif, as well as by conserved residues downstream: Arg 92, His 303 and Asp 304 (Fig. 2c). The tungstate complex was obtained with the active enzyme and shows the side chain of His 17 oriented for nucleophilic attack by a hydrogen bonding interaction with the carbonyl oxygen of Gly 18 (Fig. 2d). The position of tungstate is in close agreement with the position of the scissile phosphate in the phytate complex. Thus, the position of His 17 in the tungstate complex is likely to be representative of its position in a complex of the active enzyme with phytate, and the H17A mutation is unlikely to have affected phytate binding. The positions and orientations of conserved residues in the active sites of E. coli phytase, the A. niger acid phosphatases14,15, and the prostatic acid phosphatases12,13 are highly conserved. Additionally, the N-terminus of helix L in E. coli phytase points at the active site, and the N-terminal amide nitrogen (that of Asp 304) is hydrogen bonded to the scissile phosphate (Figs 1a, 2d). The dipole of this helix would facilitate the binding of the scissile phosphate. This helix is also conserved in the other histidine acid phosphatase structures (Fig. 1c). Phytate does not fully occupy the binding pocket, which is substantially larger than the substrate (Fig. 3a). It is most tightly bound and ordered in the region of the scissile phosphate, where most of the interactions are observed (Fig. 3b). This is reflected in the charge distribution on the molecular surface of the binding pocket (Fig. 3a). Positively charged groups are mostly located in the region of the active site, with few basic residues in other parts of the binding pocket. Consequently phytate is primarily anchored in the binding pocket by the scissile phosphate. This arrangement of protein–ligand interactions facilitates dissociation of the product following hydrolysis of the phosphate ester linkage. Phytate-induced conformational changes In E. coli phytase, phytate binding induces conformational changes near the active site (Fig. 4a). The most noticeable is the opening and closing of residues 20–25, which include a part of the active site. The side chain of Arg 20 swings down to hydrogen bond with the scissile phosphate. The Nε atom moves 2.98 Å nature structural biology • volume 7 number 2 • february 2000
© 2000 Nature America Inc. • http://structbio.nature.com
letters b
© 2000 Nature America Inc. • http://structbio.nature.com
a
Fig. 4 Conformational change induced by phyate binding. a, Phytate binding induces conformational changes. Phytate is shown in magenta with the 3- and 4-phosphates colored red. The α- (red) and α/β- (light blue) domains are shown as a ribbon diagram. Residues 19–27 are represented by a Cα trace, while side chains of the key residues are shown. The open conformation (yellow) facilitates entry of the substrate into the binding pocket. Arg 20 then swings down to hydrogen bond with the scissile 3-phosphate. This results in residues 21–25 moving into the closed conformation (blue). Thr 23 and Lys 24 are flipped inward to interact with the 5- and 6-phosphates. This conformational change is also observed in the tungstate complex. As the substrate is drawn fully into the binding pocket, the carboxylate of Glu 219 is pushed down by the 4-phosphate of phytat e. b, Interaction between Glu 219 and Asp 304. In the absence of substrate, deprotonation of Asp 304 is disfavored by a water-mediated interaction with Glu 219. When phytate is bound, the 4-phosphate group (translucent purple) pushes the carboxylate of Glu 219 into the phytate-bound position (purple) to break the interaction between Glu 219 and Asp 304, thereby enhancing proton donation by the latter.
with an accompanying 0.85 Å shift of the Cα atom. This is associated with large changes in Thr 23 and Lys 24, with movement of their Cα atoms by 3.55 Å and 4.66 Å, respectively. The backbone in this region flips inward and brings the side chains of these two residues into contact with the 5- and 6-phosphates of phytate. These conformational changes are also observed in the tungstate complex, which show that binding of the scissile phosphate alone is sufficient to effect these changes, and that Arg 20 is the trigger. A more subtle conformational change in E. coli phytase occurs in Glu 219, which is located within the binding pocket, on helix I (Fig. 4a,b). In the native conformation, the side chain carboxylate of Glu 219 points into the interior of the binding pocket. With phytate bound, unfavorable steric interactions and charge repulsion with the 4-phosphate pushes the carboxylate of Glu 219 away towards Asp 325. Movement in Glu 219 is restricted to the side chain carboxylate group by van der Waals interactions with surrounding residues. Phytate binding may enhance catalysis In its native conformation, Glu 219 interacts with the proton donor Asp 304 via Wat 683 (Fig. 4b). This interaction is disrupted in the phytate-bound conformation, which suggests an involvement of Glu 219 in catalysis. The role of Glu 219 in its native conformation may be to electrostatically disfavor the deprotonation (formation of the carboxylate anion) of Asp 304, such that upon binding of phytate or a similar substrate, the acidity of Asp 304 is increased by the disruption of the interaction between Glu 219 and Asp 304 (Fig. 4b). The protonation state of Asp 304 would therefore be linked to the side chain conformation of Glu 219. The phytate complex indicates that proper positioning of the substrate in the active site is coincident with the substrate-induced conformational change in Glu 219. Therefore Glu 219 can act as a switch to allow substrate binding to promote deprotonation of Asp 304 (with proton transfer to the leaving group). In this context, the open conformation of residues of 20–25 could accommodate an initial binding of phytate with Glu 219 in its native conformation. Insertion of the scissile phosphate into the active site then induces residues 20–25 to move into the closed conformation. This closure draws phynature structural biology • volume 7 number 2 • february 2000
tate deeper into the binding pocket and results in displacement of the carboxylate of Glu 219 by the 4-phosphate of phytate. This is consistent with a number of water-mediated protein–ligand interactions in this region, which likely facilitate the movements associated with these conformational changes. Conversely, the proposed coupling of the protonation state of Asp 304 with the side chain conformation of Glu 219 implies that deprotonation of Asp 304 at high pH can induce a conformational change in Glu 219. This is indeed reflected by native and tungstate complex structures, which show Glu 219 in the native conformation at pH 4.5 and 5.0, while at pH 6.6 Glu 219 adopts the phytate-bound conformation even in the absence of phytate. At pH 6.6, the activity of E. coli phytase is less than 10% of the activity at pH 4.5 (ref. 17), which is likely due to the deprotonation of Asp 304. This is supported by a comparison of the wild type and D304A mutant enzymes at pH 6.5, in which the two enzymes showed similar activities, and in which the D304A mutant exhibited a lower Km (ref. 10). When deprotonated by high pH, Asp 304 can no longer act as a proton donor, and activity is lost. E. coli phytase has been tested with a number of phosphorylated substrates but shows by far the highest activity towards phytate. Additionally, a time course of phytate hydrolysis suggests that the rate of hydrolysis is reduced for intermediates containing less phosphate groups4. Based on the structural data presented, catalysis is expected to be enhanced for substrates that are able to cause a conformational change in Glu 219. Therefore, the reduced activity for less preferred substrates may be accounted for in part by their lack of a suitably positioned phosphate or similar group to displace the carboxylate of Glu 219. Methods Crystallization. E. coli phytase was purified and crystals of the acidic form were grown as described17. Crystals of the mercury form were grown at room temperature using the vapor diffusion method by mixing 1 µl of a 72 mg ml-1 protein solution containing 2.5 mM HgCl2 with an equal volume of crystallization solution containing 28% ethylene glycol, 18% glycerol and 33 mM MOPS pH 6.6. Crystals of the tungstate complex were grown under the same conditions but with protein solution containing 1.5 mM Na2WO4. For equilibration at pH 5.0, crystals were soaked in 28% ethylene glycol,
111
© 2000 Nature America Inc. • http://structbio.nature.com
letters Table 1 MAD phasing statistics for WO42- derivative1 and crystallographic data and refinement statistics λ1 anomalous
MAD RCullis2 (acentric/centric reflections) Phasing power3 (acentric/centric reflections) Figure-of-merit (acentric/centric) (24 – 2.5 Å)
© 2000 Nature America Inc. • http://structbio.nature.com
Data & refinement
Native acidic
λ2 anomalous
0.6864 / – 2.855 / –
0.3394 / – 5.605 / – 0.82311 / 0.60565
Native mercury
pH 4.5 6.6 Wavelength (Å) 1.54 1.54 Space group P21 P212121 Cell axes a, b, c (Å) 74.8, 72.1, 82.4, β = 92.0° 71.0, 74.5, 89.4 Resolution range (Å) 25 – 2.3 25 – 2.25 No. of observed reflections 106,657 82,456 No. of unique reflections 37,076 42,339 Rsym (%)4 8.5 3.0 Overall completeness (%) 95.0 98.1 Anomalous completeness (%) – 83.7 No. of non-H atoms Protein / water / ligand 6,167 / 343 / – 3,145 / 162 / 1 R-factor5 / free R-factor6 15.7 / 20.24 22.42 / 26.67 R.m.s. deviations 0.0073 / 1.39 0.0063 / 1.30 Bond lengths (Å) / angles (°)
5.0 1.54 P212121 70.4, 74.7, 89.8 25 – 2.4 66,609 33,792 3.6 92.9 80.9 3,145 / 144 / 5 22.2 / 26.8 0.0068 / 1.31
λ2 - λ 1 isomorphous 0.3479 / 0.3913 5.701 / 3.158
WO 42- derivative λ1 λ2 6.6 6.6 1.55 1.214 P212121 P212121 70.6, 75.0, 89.7 70.7, 75.0, 89.7 25 – 2.5 25 – 2.38 48,024 81,499 30,534 36,860 3.9 4.7 93.7 97.5 80.6 85.7 – – –
3,145 / 259 / 9 19.5 / 22.3 0.0063 / 1.31
Phytate complex 5.0 1.54 P212121 70.4, 75.1, 90.0 25 – 2.05 184,164 55,402 6.2 96.1 83.3 3,140 / 227 / 40 21.5 / 25.6 0.0061 / 1.31
1MAD phasing was calculated as a special case of single isomorphous replacement with anomalous scattering (SIRAS), where λ (1.55 Å) was used as 1 a native and λ2 (1.214 Å) was used as a derivative. 2R = Σ |E| / Σ || F | |F ||, where E is the lack of closure. Cullis j j λ λ0 3Phasing power = , where FH(calc) is the calculated anomalous difference and E is the lack of closure. 4R = Σ|I(k) |/ΣI(k), where I(k) and represent the diffraction intensities of the individual measurements and the corresponding mean values sym respectively. The summation is over all measurements. 5R-factor = Σ|F obs - Fcalc|/Σ|Fobs|, where Fobs and Fcalc are the observed and calculated structure factors, respectively. 6The free R-factor was calculated using 5% of all reflections for all data sets except the native acidic data set, in which 10% of all reflections were used.
18% glycerol, 10% PEG 3350, 33 mM sodium acetate pH 5.0, 0.25 mM HgCl2 for 48 h. The pH 5.0 phytate complex was obtained by first equilibrating a crystal of the inactive mutant at pH 5.0 and then soaking in a pH 5.0 solution containing 3 mM sodium phytate. Data collection and processing. All native and phytate complex data sets were collected using a Rigaku rotating anode X-ray source and a MAR300 image plate. Data for the acidic and mercury crystal forms were collected at 277 K and 100 K, respectively. Data for the tungstate derivative were collected with a MAR345 image plate at the X8-C beamline at Brookhaven National Laboratory. The HKL package18,19 and the CCP4 software suite20 were used for data reduction and processing. Attempts to solve the structure by molecular replacement using the native data sets and the coordinates of the A. niger phytase and the rat prostatic acid phosphatase were unsuccessful. Structure determination and refinement. The structure of E. coli phytase was determined by the multi-wavelength anomalous diffraction method using data collected from the tungstate derivative near the tungsten LIII edge (λ = 1.214 Å) and at a remote wavelength (λ = 1.55 Å). An anomalous difference Patterson map calculated using the edge data set showed an exceptionally strong 26.6 σ peak, with an accompanying 10.9 σ peak in the dispersive Patterson map, which correspond to a single tungsten site. Due to strong white line effects near the tungsten LIII edge21, experimental f' and f'' values for W at the edge wavelength were estimated from X-ray fluorescence data and refined in SHARP 22. The f' and f'' values refined to -24.3 and 25.9 electrons, substantially higher than the theoretical values of -19.8 and 10.5 electrons, respectively. The initial phases were improved by solvent flipping with SOLOMON23, and the resulting electron density map at 2.5 Å resolution was of excellent quality with clear backbone connectivity
112
and density for most side chains. The MAD phasing statistics are given in Table 1. The model was completed by iterative cycles of model building with Xtalview24 and refinement with CNS25. An initial model for the acidic crystal form was obtained by molecular replacement with the program AMoRe26 using a model from the mercury crystal form containing only protein atoms. The asymmetric unit of the acidic crystal form contains two molecules. The model was manually adjusted in Xtalview24 and refined in CNS25. The final models showed good stereochemistry when analyzed with PROCHECK27. The refinement statistics are summarized in Table 1. Phytase assays. Phytase activity was measured as the amount of inorganic phosphate released28. Protein concentrations were determined by the bicinchoninic acid method 29. All measurements were made in triplicate with proteins produced from the appA deletion mutant CU 1867 devoid of endogenous E. coli phytase9, in order to avoid activity contamination. With respect to the H17A mutant, activity assays were performed together with positive controls. The maximum activity detected for the mutant in both phytase and acid phosphatase assays was less than 0.002 U mg-1, indistinguishable from background. Coordinates. The coordinates have been deposited in the Protein Data Bank (accession codes 1DKL, 1DKM, 1DKN, 1DKO, 1DKP and 1DKQ).
Acknowledgments The authors would like to thank Y.-C. Liou of P. Davies’ group at Queen’s University for equipment and technical assistance in early purification attempts and for his support throughout the project. We thank A. Tocilj for his encouragement and assistance at various stages of the project. We thank A. Iyo and M. Cotrill for constructing and help with purifying the inactive mutant, respectively. We also thank E. Leinala for her advice on crystallization. G. Thatcher
nature structural biology • volume 7 number 2 • february 2000
© 2000 Nature America Inc. • http://structbio.nature.com
letters provided helpful discussion. We are grateful to L. Flaks and the technical staff at the National Synchrotron Light Source at Brookhaven National Laboratory for their support at X8-C. D.L. was an Ontario Graduate Scholarship recipient. This work was supported by a NSERC grant to Z.J. and contract funding from Ontario Pork to C.W.F. Correspondence should be addressed to Z.J. email:
[email protected]
© 2000 Nature America Inc. • http://structbio.nature.com
Received 23 June, 1999; accepted 6 December, 1999 1. Reddy, N.R., Sathe, S.K. & Salunkhe, D.K. Adv. Food Res. 28, 1–92 (1982). 2. Graf, E. In Phytic Acid Chemistry and Application (ed. Graf, E.) 1–21 (Pilatus Press, Minneapolis; 1986). 3. Wodzinski, R.J. & Ullah, H.J. Adv. Appl. Micro. 42, 263–302 (1996). 4. Greiner, R., Konietzny, U. & Jany, K.-D. Arch. Biochem. Biophys. 303, 107–113 (1993). 5. Wyss, M. et al. Appl. Env. Microbiol. 65, 367–373 (1999). 6. Chi, H. et al. Genomics 56, 324–336 (1999). 7. Vincent, J.B., Crowder, M.W. & Averill, B.A. Trends Biochem. Sci. 17, 105–110 (1992). 8. Van Etten, R.L. Ann. N.Y. Acad. Sci. 390, 27–51 (1992). 9. Ostanin, K. et al. J. Biol. Chem. 267, 22830–22836 (1992). 10. Ostanin, K. & Van Etten, R.L. J. Biol. Chem. 268, 20778–20784 (1993). 11. Lindqvist, Y., Schneider, G. & Vihko, P. Eur. J. Biochem. 221, 139–142 (1994). 12. Schneider, G., Lindqvist, V. & Vihko, P. EMBO J. 12, 2609–2615 (1993). 13. LaCount, M.W., Handy, G. & Lebioda, L. J. Biol. Chem. 273, 30406–30409 (1998). 14. Kostrewa, D. et al. Nature Struct. Biol. 4, 185–190 (1997).
15. Kostrewa, D., Wyss, M., D’Arcy, A., van Loon, A.P.G.M. J. Mol. Biol. 288, 965–974 (1999). 16. Cohen, G.H. J. Appl. Crystallogr. 30, 1160–1161 (1997). 17. Jia, Z., Golovan, S., Ye, Q. & Forsberg, C.W. Acta Crystallogr. D54, 647–649 (1998). 18. Otwinowski, Z. In Proceedings of the CCP4 Study Weekend: Data Collection and Processing (ed Sawyer L., Issacs N.& Bailey S.) 56–62 (Daresbury Laboratory, Warrington; 1993). 19. Minor, W. XdisplayF Program. Purdue University, West Lafayette, USA (1993). 20. Collaborative Computational Project, Number 4. Acta Crystallogr. D50, 760–763 (1994). 21. Egloff, M.-P., Cohen, P. T. W., Reinemer, P. & Barford, D. J. Mol. Biol. 254, 942–959 (1995). 22. de La Fortelle, E. & Bricogne, G. In Methods in Enzymology, Macromolecular Crystallography (eds. Sweet, R.M. & Carter, Jr. C.W.) 276, 472–494 (Academic Press, New York; 1997). 23. Abrahams J.P. & Leslie A.G.W. Acta Crystallogr. D52, 30–42 (1996). 24. McRee, D.E. J. Mol. Graphics 10, 44–47 (1992). 25. Brünger, A.T. et al. Acta Crystallogr. D54, 905–921 (1998). 26. Navaza, J. Acta Crystallogr. A50, 157–163 (1994). 27. Laskowski, R.A., MacArthur, M.W., Moss, D.S. & Thornton, J.M. J. App. Crystallogr. 26, 283–291 (1993). 28. Engelen, A.J., Vanderheeft, F.C., Randsdorp, P.H.G., & Smit, E.L.C. J. AOAC. Int. 77: 760–764. (1994). 29. Provenzano, M.D., Fujimoto, E.K., Goeke, N.M., Olson, B.J., & Klenk, D.C. Anal. Biochem. 150: 76–85. (1985). 30. Kraulis, P.J. J. Appl. Crystallogr. 24, 946–950 (1992). 31. Merrit, E.A. & Murphy, M.E.P. Acta Crystallogr. D50, 869–873 (1994). 32. Nicholls, A., Sharp, K. & Honig, B. Proteins 11, 281–296 (1991).
The aspartic proteinase from Saccharomyces cerevisiae folds its own inhibitor into a helix Mi Li1–3, Lowri H. Phylip1,4, Wendy E. Lees4, Jakob R. Winther5, Ben M. Dunn6, Alexander Wlodawer2, John Kay4 and Alla Gustchina2 1
These authors contributed equally to this work. 2Macromolecular Crystallography Laboratory, Program in Structural Biology, National Cancer Institute-FCRDC, Frederick, Maryland 21702, USA. 3Intramural Research Support Program, SAIC Frederick, National Cancer Institute-FCRDC, Frederick, Maryland 21702, USA. 4School of Biosciences, Cardiff University, Cardiff CF1 3US, UK. 5Department of Yeast Genetics, Carlsberg Laboratory, DK 2500 Copenhagen Valby, Denmark. 6Department of Biochemistry and Molecular Biology, University of Florida, Gainesville, Florida 32610, USA.
Aspartic proteinase A from yeast is specifically and potently inhibited by a small protein called IA3 from Saccharomyces cerevisiae. Although this inhibitor consists of 68 residues, we show that the inhibitory activity resides within the N-terminal half of the molecule. Structures solved at 2.2 and 1.8 Å, respectively, for complexes of proteinase A with full-length IA3 and with a truncated form consisting only of residues 2–34, reveal an unprecedented mode of inhibitor–enzyme interactions. Neither form of the free inhibitor has detectable intrinsic secondary structure in solution. However, upon contact with the enzyme, residues 2–32 become ordered and adopt a near-perfect α-helical conformation. Thus, the proteinase acts as a folding template, stabilizing the helical conformation in the inhibitor, which results in the potent and specific blockage of the proteolytic activity. Proteolytic enzymes are categorized into four main families1. Whereas structures have been solved for complexes of gene-encodnature structural biology • volume 7 number 2 • february 2000
Fig. 1 Schematic diagram of the structure of proteinase A. Ribbon representation showing the tracing of the main chain of proteinase A (green) with the oligosaccharide attached to Asn 67 shown in mauve, together with the visible fragment of the inhibitor IA3 (gold). Side chains of the active site residues Asp 32 and Asp 215 are shown in red.
ed inhibitors (for example, serpins2, cystatins3 and TIMPs4) that target three of these protein families (serine, cysteine and metalloproteinases), protein inhibitors of the aspartic proteinase family are rare5 and no mechanism of action has previously been elucidated for any of the few that are known, such as IA3 (ref. 6). Human pathogens, including HIV, Plasmodium falciparum (malaria) and fungi such as Candida, the causative agent of thrush infections, are known to be crucially dependent on aspartic proteinases for their replication and survival7–9. Substantial progress has been made in the generation of chemically synthesized inhibitors to block the action of these enzymes10,11, and several HIV-1 proteinase inhibitors are now licensed by the United States Food and Drug Administration as drugs for use in combating AIDS10,12. In contrast, only a few naturally occurring protein inhibitors of this proteinase family have been found, for example, in humans (renin binding protein13), in the parasitic nematode Ascaris lumbricoides14, 113