ISAAC M. DINNER, HARALD J. VAN HEERDE, and SCOTT A. NESLIN* The current marketing environment is characterized by a surge in multichannel shopping and increasing choice of advertising channels. This situation requires firms to understand how advertising in one channel (e.g., online) influences sales in another channel (e.g., offline). This article studies the presence, magnitude, and carryover of these cross-channel effects for online advertising (display and search) and traditional media. The analysis considers how these advertising expenditures translate directly into sales, as well as indirectly through intermediate search advertising metrics—namely, impressions and clickthrough rate. For a high-end clothing and apparel retailer, the authors find that cross effects exist and are important and that cross-effect elasticities are almost as high as own-effect elasticities. Online display and, in particular, search advertising is more effective than traditional advertising. This result is primarily due to strong cross effects on the offline channel. Return-on-investment calculations suggest that by ignoring these cross effects, firms substantially miscalculate the effectiveness of online advertising. Notably, the authors find that traditional advertising decreases paid search click-through rates, thus reducing the net cross effect of traditional advertising.
Keywords: advertising elasticity, search advertising, banner advertising, multichannel, cross-effects, nonlinear models, marketing-mix models Online Appendix: http://dx.doi.org/10.1509/jmr.11.0466
Driving Online and Offline Sales: The CrossChannel Effects of Traditional, Online Display, and Paid Search Advertising Many brick-and-mortar retailers have opened online stores and found that these stores dramatically increase sales. For example, while Macy’s 2012 year-on-year revenue growth in physical stores was 3.7%, the firm’s online sales increased by 41.0% (Macy’s 2013). The growth in the online sales channel has coincided with growth in online advertising spending. While the global financial crisis forced most companies to cut their marketing budgets (Bradshaw 2008; McKinsey 2009), Internet advertising grew 15% from 2009 to 2010, to the point where online advertising spend exceeded $36.6 billion in 2012 (IAB 2013). The proliferation of the online purchase channel, combined with competing advertising outlets across online and offline channels, creates opportunities but also an increasingly complex problem for firms. Retailers such as Macy’s now need to balance advertising across traditional media (e.g., television, print) with online techniques such as search
*Isaac M. Dinner is Assistant Professor of Marketing, Kenan-Flagler Business School, University of North Carolina at Chapel Hill (e-mail: isaac_
[email protected]). Harald J. van Heerde is Research Professor of Marketing, School of Communication, Journalism and Marketing, College of Business, Massey University, and Extramural Fellow, CentER, Tilburg University (email:
[email protected]). Scott A. Neslin is Albert Wesley Frey Professor of Marketing, Tuck School of Business, Dartmouth College (e-mail: scott.
[email protected]). The authors are grateful for the constructive feedback received from participants at the Marketing Science Conference, Marketing in Israel Conference, and ISMS Practice Prize Conference, as well as at marketing seminars at Dartmouth College, Massey University, University of California–Davis, University of Maryland, University of New South Wales, University of North Carolina at Chapel Hill, University of Pittsburgh, and Georgia Institute of Technology. They thank Marnik Dekimpe, Don Lehmann, and Carl Mela for their excellent suggestions on a previous draft of this article. They also thank an anonymous retailer for sharing its marketing and transaction data and Sha Yang for her insights and for sharing unpublished data regarding the effectiveness of search advertising. Harald van Heerde thanks the New Zealand Royal Society Marsden Fund (MAU1012) for research support. Michel Wedel served as associate editor for this article. © 2014, American Marketing Association ISSN: 0022-2437 (print), 1547-7193 (electronic)
527
Journal of Marketing Research Vol. LI (October 2014), 527–545
528
and display advertising (banner ads) to propel purchases across both physical and online stores. While marketing campaigns are often put in place to drive sales to the native channel (e.g., e-mail campaigns aim to drive online sales; Ansari, Mela, and Neslin 2008), it is natural to consider the impact that advertising will have across channels. For example, online advertising may have an impact on offline sales (a “cross effect”) as well as an impact on online sales (an “own effect”). This raises questions as to what portion of the sales impact will be native and what will be cross-channel. Is the cross effect larger or smaller than the own effect? Is the cross effect negative due to channel substitution? How will this differ between traditional and digital media? What are the implications for return on investment (ROI)? These questions motivate and guide this research. From a managerial perspective, knowing the full return from all advertising expenditures is necessary for developing an efficient marketing plan. Solely measuring own effects could result in misjudgment of the impact of advertising. In addition, understanding the size and direction of cross effects has strong implications for setting strategy across channels. For example, if there is a substantial positive cross effect of online advertising, a retailer may find it advantageous to use online advertising to build sales at a physical store. It is therefore not surprising that in an extensive review of multichannel strategies, Zhang et al. (2010, p. 173) conclude that “there is a pressing need to develop and implement formal performance metrics that take into account the idiosyncratic nature of each channel and cross-channel effects of any retail mix decisions.” Our goal is to address this need. Specifically, the purpose of this article is to empirically validate the presence of cross-channel advertising effects, quantify their magnitude, and generate insights into what determines this magnitude. We develop a multiequation model that estimates sales in both online and offline channels as a function of online display, online paid search, and traditional advertising. One reason to expect cross effects is that customers prefer to shop in certain channels (i.e., offline vs. online), and when they see advertising, whether it is traditional or online, they purchase in the channel they prefer. That preferred purchase channel may differ from the advertising medium, causing a direct cross effect. However, paid search advertising presents a nonobvious case. Paid search expenditures only occur to the extent that the paid search advertisement drives customers to the website. Therefore, for a cross effect to occur, the customer must first click on the search advertisement, visit the website, and then go to the offline store. This seems like a roundabout way to create a cross effect. However, previous work on research shopping (Verhoef, Neslin, and Vroomen 2007) suggests that it is not uncommon for customers to use the Internet as a “search channel” and the offline store as the “purchase channel.” In addition, Lal and Sarvary (1999) make the important distinction between digital and nondigital attributes. Digital attributes are easily described on the Internet, while nondigital attributes require “physical presence.” Because many products have both nondigital and digital attributes, there is reason to suspect that even if paid search ads bring the customer to the website, the customer may prefer to go to the
JOURNAL OF MARKETING RESEARCH, OCTOBER 2014
store to make the purchase. These ideas provide a rationale for a positive cross effect for paid search advertising and suggest that traditional methods of measuring returns from search advertising (i.e., just the online impact) may undervalue search advertising. Because the existence of cross effects for paid search is less obvious and richer from a theoretical perspective, paid search plays a central role in our conceptual framework. We model paid search impressions and click-through rate, which combine to produce the clicks that send customers to the retailer’s website. We trace advertising’s indirect impact on these intermediate metrics and determine whether this facilitates cross effects. We apply our model to data from an upscale clothing retailer that offers an assortment of high-end clothing and apparel. This task is particularly challenging for several reasons, including (1) endogeneity of advertising, (2) dynamic advertising effects, (3) a multivariate dependent variable, (4) potential autocorrelation, and (5) competitive advertising effects. To address these challenges, we estimate the model using a procedure that accounts for all five of them, and we conduct several specification and robustness checks. Our findings indicate that positive cross-channel advertising effects exist and are almost as strong as own-channel effects. Online advertising, and in particular search advertising, is more effective than traditional advertising in terms of overall sales impact, primarily due to the strength of its cross effects on the offline channel. We find that while traditional advertising has a positive direct cross effect on online sales, it decreases click-through rates of paid search ads. This effect is only partially offset by a marginally significant, positive impact on impressions. The net result is that traditional advertising’s total cross effect becomes less positive because of the negative indirect effect on paid search effectiveness. This suggests that managers face a challenge in overcoming the dilution of traditional advertising effectiveness. Overall, however, cross effects are real, and a key takeaway is that firms that evaluate advertising solely on the basis of its impact on own-channel performance may significantly miscalculate the total impact. LITERATURE REVIEW
Research investigating online and offline advertising effectiveness can be categorized into own- and cross-channel effects. While there is an abundance of research on ownchannel effects, particularly in the offline channel, there is a small but increasing body of research investigating crosschannel advertising effects, to which this article contributes. Own-Channel Advertising Effects
The large body of literature investigating the impact of offline advertising on offline sales has generated two major meta-analyses. The first, Assmus, Farley, and Lehmann (1984), came well before the common use of the online channel. They find an average short-term elasticity of .22 and an average carryover effect of .46. Recently, Sethuraman, Tellis, and Briesch (2011) examined the 25 years following Assmus, Farley, and Lehmann. They focus on advertising from print, television, and “aggregate” media and find a lower average short-term elasticity of .12. They note that elasticities are lower in mature markets and conclude that the decrease in the effectiveness of advertising over the past
Driving Online and Offline Sales
25 years is due to “increased competition, ad clutter, [and] the advent of the internet as an alternate information source” (Sethuraman, Tellis, and Briesch 2011, p. 460). The recent advent of the online channel means that research into the effect of online advertising on online sales is still sparse. Manchanda et al. (2006) determine the likelihood of consumer repurchase due to online display exposure and find an elasticity of .02. Trusov, Bucklin, and Pauwels (2009) measure the impact of event marketing on signing up with a social networking site and find a shortterm elasticity of only .002 for signups, while online word of mouth had an elasticity of .14. Other research in purchasing and advertising in online channels has focused on dependent variables such as consideration sets (e.g., Naik and Peters 2009) or has used independent variables other than advertising, such as online communications (Sonnier, McAlister, and Rutz 2011). Due to its growing importance, there is an increasing interest in understanding the impact of paid search advertising (for a review, see Rutz and Bucklin 2013). Yao and Mela (2011) contend that search advertising is highly profitable because the costs of drawing customers to the website are relatively low compared with the benefits of “conversion” into sales. Most empirical research has been conducted at the micro level. Ghose and Yang (2009) measure the impact of search ad position on click-through rate and conversion rate, and Rutz and Trusov (2011) show that including the keyword the consumer types into the search engine in the headline of the search ad increases click-through rates. Rutz and Bucklin (2013) explore the “long tail” for keywords and suggest that less commonly searched keywords underperform compared with more commonly searched keywords. Additional research by Rutz, Trusov, and Bucklin (2011) indicates that click-throughs on certain keywords generate current and future visits through spillover effects. There are two key takeaways from this line of research on paid search. First, there are many micro-level factors that determine success. Although the data do not allow us to directly estimate these issues (e.g., the impact of search rank), we do examine macro-level determinants of paid search success, namely, the impact of investments on other advertising media (traditional and online display). Second, paid search may have both long- and short-term effects. This is crucial for fully evaluating an advertising campaign and is a focus of our study. Cross-Channel Advertising Effects
Researchers have only begun to investigate the crosschannel effects of online activities on offline sales (Chan, Wu, and Xie 2011; Danaher and Dagger 2013; Pauwels et al. 2011; Van Nierop et al. 2011) as well as the impact of offline activities on online sales and consideration (Naik and Peters 2009; Trusov, Bucklin, and Pauwels 2009). Even more limited, however, is research that measures both online and offline cross-channel advertising effects, particularly at the purchase or sales level. In contrast, prior research has used consumer contact methods that differ from advertising (Ansari, Mela, and Neslin 2008) or have a dependent variable that is different from sales (Naik and Peters 2009). The following discussion notes the most relevant work in chronological order.
529
Abraham (2008) surveys how combining display and search advertising influences multichannel sales revenue. Customers who saw no online ad yielded the least revenue, followed by customers who only saw display ads; then, there was a large jump in revenue for customers who only saw search ads, with the best performance resulting from customers who saw both search and display ads. Notably, the largest revenue impact was on offline buyers, implying that online advertising cross effects may be more important than the own effects. However, these results do not provide a method for how to analyze resource allocation or account for endogeneity. Naik and Peters (2009) were the first to econometrically estimate a multichannel structure in which the dependent variable was the consideration set for automobile choice. The authors examine the impact of offline advertising (consisting of television, radio, magazines, and newspapers aggregated into a single construct), online advertising (display), and direct mail (postal). The consideration set was measured by visiting the dealer showroom (offline channel) and by visiting and configuring a car on the firm’s website (online channel). The authors find significant cross effects on consideration. For example, online advertising affects offline consideration, while direct mail affects online consideration. Although Naik and Peters do not measure actual purchases, this research is an important step forward. We expand on their study by considering actual purchases, carryover effects, competitive effects, and endogeneity. Wiesel, Pauwels, and Arts (2011) use vector autoregression to estimate how customers move through the “purchase funnel.” The authors help a business-to-business company in the Netherlands optimize fax, flyer, and search advertising expenditures. As part of the study, they find a very high sales elasticity for AdWords (4.35) and a much lower sales elasticities of .05 and .04 for flyers and faxes, respectively. They find strong cross-channel effects in which 73% of the profit impact of AdWords is due to offline sales and 20% of the profit impact from direct mail flyers is due to online sales. Their work takes a large step toward measuring cross effects of online and offline media, particularly relevant to the business-to-business arena. We build on this work by including competitive effects and endogeneity, adding the intermediary impacts of search dynamics, and focusing on mass advertising communications in a businessto-consumer context. Chan, Wu, and Xie (2011) study the impact of customer acquisition channel on customer lifetime value. Importantly, the authors find that a large portion of the customer lifetime value from customers acquired through paid search is due to transactions in offline channels, providing further support for the importance of cross-channel management. In summary, while own-channel advertising effects have been studied extensively, researchers have just begun to make headway in considering cross-channel advertising effects. However, no research to date has addressed endogeneity, competitive advertising, and the dynamics that are endemic to empirically studying the impact of advertising. In addition, no study has examined and compared three major types of advertising—traditional (offline), online display, and paid search. Finally, no study has examined how traditional and online display advertising affects the intermediate metrics (impressions and click-through rate) that
530
drive paid search performance. Thus, our study provides deeper insights into how offline and online advertising generates sales both within and across channels. CONCEPTUAL FRAMEWORK
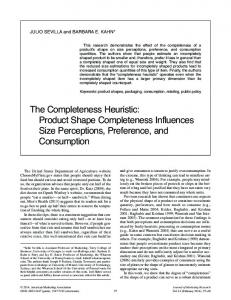
We develop a framework that gauges how different forms of advertising (traditional, online display, and paid search) affect online and offline sales directly or indirectly through interactions with paid search intermediaries (click-throughs and impressions). Figure 1 represents the framework. On the left side are the three forms of advertising—traditional advertising, online display advertising, and paid search advertising. On the right side are offline and online sales. The middle of the framework contains the elements of paid search advertising that translate paid search expenditures into sales. In line with Rutz and Bucklin (2013, p. 233), the key is to understand how paid search generates clicks that route the customer to the website. Clicks arise from impressions (how many times the paid search ad is served) and click-through rate (click-through rate = the fraction of impressions in which the customer clicked through the paid search ad). Specifically, click-throughs = impressions × click-through rate. Clicks translate into sales by “converting” the clicks into purchases. These purchases can take place in the online or offline channel. We group traditional and online display advertising because they are a form of advertising that targets consumers earlier in the decision-making process than paid search advertising. That is, customers targeted through paid search are often in an advanced decision-making stage, whereas traditional and online display ads cast a wider customer net. Traditional and online display advertising can have direct effects on both offline and online sales because these ads may directly lead a customer to a store or website. This is represented by the top line in Figure 1, which goes straight to offline/online sales. In addition, there are potential indi-
JOURNAL OF MARKETING RESEARCH, OCTOBER 2014
rect effects through the impact of traditional and display advertising on search impressions and click-through rate. Traditional and online display advertising can stimulate need recognition, leading to more keyword searches and thus more impressions. Traditional and display advertising might increase click-through rate by raising awareness about the focal retailer. This would produce more clicks and thus more online sales, amplifying the cross effects of traditional/online advertising. A counterargument is that this advertising serves as a substitute for the information provided in a search ad and thus decreases click-through rate. We determine empirically what occurs in our context. The key point is that cross effects of traditional/online display advertising may be amplified or diminished by an indirect effect manifested by its impact on paid search impressions and click-through rate. Paid search expenditures should indirectly affect sales through impressions and click-through rate. This process begins with the advertiser, our focal retailer, which sets a budget and bids on keywords. The search engine (e.g., Google, Yahoo!) runs an auction that determines the cost per click and the paid search ad’s position in the lineup of ads. The search engine determines the number of times the ad is shown (impressions), and consumers click through a certain percentage of these impressions (click-through rate). The search engine ensures that the resulting clicks do not exceed the budget specified by the focal retailer. Note the sequence: (1) A budget is specified, (2) impressions are generated and click-through rate is determined, and (3) the resulting clicks translate into sales. That is, the budget is specified ahead of time; the retailer does not offer the search engine a blank check and wait to see how much they ultimately spend. Our discussion with the focal retailer confirmed that this sequence is indeed what transpired; expenditures were not determined after the campaign was run or determined by the search engine. The retailer also con-
Figure 1
MODELING FRAMEWORK FOR THE CROSS-CHANNEL EFFECTS OF ONLINE AND TRADITIONAL ADVERTISING ON SALES
Traditional Advertising
Online Display Advertising
Search Impressions
Offline Sales Search Click-throughs
Paid Search Advertising
Search Click-through Rate (CTR)
(Impression ! CTR)
Online Sales
Driving Online and Offline Sales
firmed that the search engine satisfied the entirety of the budget, implying that there were enough impression opportunities. In summary, the paid search budget equaled paid search expenditures and logically preceded impressions and click-through rate. Our study contributes at a macro level by investigating the relationship between search expenditures and impressions/click-through rate. Higher expenditures should unequivocally increase the number of impressions. However, the impact on click-through rates is not clear. As we discussed previously, Rutz and Bucklin (2013) note that less commonly entered keywords may have poorer performance. It could be that with higher expenditures, companies begin to bid on these lower-performing keywords, resulting in lower click-through rates. Again, we empirically study this question for our retailer. In summary, our framework enables us to study the own and cross effects of advertising, with additional depth regarding the effects of paid search advertising. We allow traditional and online display advertising to exert an indirect effect on multichannel sales through intermediate metrics of paid search—namely, impressions and click-through rate. In addition, we study how paid search expenditures influence these intermediate metrics and trace how they indirectly influence offline sales (cross effects) and online sales (own effects). The dependent variables in the framework are offline
531
and online sales, paid search impressions, and paid search click-throughs. The key independent variables are traditional, online display, and paid search advertising expenditures. DATA DESCRIPTION
To test our framework, we use data from a major U.S. clothing retailer, which has asked to remain anonymous. The store offers a large assortment of high-end clothing and accessories. The store operates online and offline stores in 25 U.S. markets. The bulk of the revenue is generated through the offline channel (85%), although the online channel’s share of the revenue (15%) has steadily increased over time. We observe the dependent variables online and offline dollar sales at the weekly market level. With 103 weeks of data from September 2008 to August 2010, this provides 2,575 offline sales observations and 2,575 online sales observations (25 markets × 103 weeks). We observe the other dependent variables at the national level: weekly paid search impressions and paid search click-through rate. The number of paid search impressions runs into the millions,1 and the average search click-through rate is 3.1% (SD = .6%), which is comparable to click-through rates in the retail industry (eMarketer 2012). Table 1 describes the
1To protect the identity of the retailer, we have scaled all sales, advertising, and impression variables by a constant factor.
Table 1
Variable
VARIABLE OPERATIONALIZATIONS Operationalization
Offline sales
Aggregate dollar value of store sales in a particular market
Online display advertising
Dollars spent on Internet display advertising, obtained by allocating national figures proportional to the market’s GDP
Online sales
Traditional advertising Paid search advertising
Paid search impressions Paid search click-through rate Paid search click-throughs
Dummy test banner advertising Christmas dummy
Aggregate dollar value of online sales in a particular market
Dollars spent on newspaper, magazine, radio, television, and billboard advertising, obtained by allocating national figures proportional to the market’s GDP
TNS TNS
Number of click-throughs due to search advertising, obtained by allocating national figures proportional to the market’s GDP
Company
Click-through rate for search advertising
A binary variable that is 1 during weeks of additional geo-targeted banner advertising
A binary variable that is 1 for weeks between Thanksgiving and the end of the calendar year (i.e., the last six weeks of the year)
Clearance
Dummy variable for clearance sales in a week
The number of individual, minor promotion days in a week (multiday promotions counted as the number of days the promotion runs)
Company Company Company Company Company Company Company
Unemployment rate in the associated market in each week, gathered from Bureau of Labor Statistics data (http://www.bls.gov/eag/, accessed January 2011)
Bureau of Labor Statistics
Dollars spent on display advertising by the closest competitor, obtained by allocating national figures proportional to the market’s GDP
TNS
Competitor traditional advertising
Dollars spent on Internet traditional advertising by the closest competitor, obtained by allocating national figures proportional to the market’s GDP
Market
Geographic region representing a service area as defined by the company
Competitor online display advertising
Company
Company
Number of impressions due to search advertising
The number of individual important promotion days in a week, classified as major promotions by the company (multiday promotions counted as the number of days the promotion runs)
Unemployment rate
Company
Dollars spent on search advertising
Large promotion
Small promotion
Source
TNS
Company
532
variables used in the analysis, and Table 2 offers descriptive statistics. Advertising Spend
The retailer engages in both online and offline advertising. Their traditional (offline) advertising is a mix of radio, print media, television, and billboard campaigns, averaging 33% of total advertising expenditures. These campaigns are relatively short and unique, making generalizable analysis of any one type difficult. Therefore, we follow Naik and Peters (2009) and aggregate these expenditures across the various traditional media. Figure 2 shows time-series plots for ad spend. The advertising data are available nationally. We scale these data proportionately to the gross domestic product (GDP) of each market in model equations when the dependent variable is at the market level. (We obtained GDP data from the U.S. Bureau of Economic Analysis.) The retailer spends 38% of its advertising budget on display advertising (banners) and 29% on paid search advertising. Most of the display advertising is general, promoting either the retailer’s name or a specific event, though exact content cannot be verified. In addition, five of the markets Table 2
Variable
DESCRIPTIVE STATISTICS (PER PERIOD)
Offline sales (per region) Online sales (per region) Traditional advertising (national) Online display advertising (national) Paid search advertising (national) Paid search impressions Paid search click-through rate Paid search click-throughs Dummy test banner advertising Christmas dummy Large promotions Small promotions Clearance promotions Unemployment rate (%) Competitor traditional advertising Competitor online display advertising
M
324,685.3 68,363.0 46,020.5 53,110.8 39,965.6 2,022,079.2 .031 58,772.3 .023 .12 1.71 5.67 .072 8.8 73,513.8 338.1
SD
304,340.3 71,011.4 50,369.4 34,869.9 15,012.6 932,700.3 .006 20,308.4 .15 .32 2.61 5.35 .26 2.4 50,692.4 682.2
Notes: N = 2,575. Data for sales, advertising, search impressions, and click-throughs are all comparatively rescaled to prevent revealing the identity of the retailer.
Figure 2
TIME-SERIES PLOTS FOR ADVERTISING EXPENDITURES $250,000
Traditional advertising Online display advertising Paid search advertising
$200,000 $150,000 $100,000 $50,000
$0
1
11
21
31
41 51 Week
61
71
81
91
101
JOURNAL OF MARKETING RESEARCH, OCTOBER 2014
received targeted online display advertisements during a 12week period. These advertisements were in addition to the normal online display spend and specifically mentioned a store location. Because spending for these advertisements is included with the national number, the econometric analysis includes a dummy variable (Dummy Test Banner Advertising) signifying when the particular markets received these ads. Other Variables Driving the Dependent Variables
Our analysis must control for other factors that drive our dependent variables. The retailer implements a large number of promotions, ranging from in-store discount sales to promotional events to special discounts for targeted customers. Discussions with the retailer suggested that they could be categorized as large promotions, such as significant giveaways, or small promotions, such as a new designer launch or minor price discounts. Furthermore, there are biannual clearance sales, when much of the merchandise is significantly discounted. We operationalize LargePromotionmt as the sum of all large promotion days during the given week t in market m. For example, if party dresses are promoted for 7 days, men’s shoes are promoted for 4 days, and there is a 1-day promotional event for a specific designer, this week would have 12 large promotion days. We use the same operationalization to measure the extent of the smaller promotions (SmallPromotionmt). The average week had 1.7 large promotion days and 5.7 small promotion days, and there was variation in promotions across markets. Occasionally, the traditional or display advertising announced a promotion. In such cases, the traditional or display advertising variable may pick up some of the communication aspects of promotion (as in feature advertising for scanner data), while the promotion variable picks up the pricing aspect of the promotion.2 We use a dummy for clearance periods (Clearancemt), which occur in just over 7% of the weeks. Other control variables include economic environment, seasonality, and trend. Specifically, we use unemployment at the market level as a proxy for the macroeconomic conditions (UnemploymentRatemt). A Christmas season dummy variable (ChristmasDummyt) accounts for any natural increases in purchase behavior between Thanksgiving and the end of the year. To account for systematic changes that occur within the study’s time period, we include a trend variable (Trendt). We also account for advertising expenditures by the firm’s primary competitor. Advertising by a competitor may adversely affect the focal company if the ads entice potential customers to switch. However, if competitor advertising serves as a need recognition reminder, it could have a positive effect on focal company’s performance (Schultz and Wittink 1976). This information includes the amount spent on traditional advertising (Competitor TraditionalAdvertisingt) and online display advertising
2Note that we do not include a separate price variable. It would be difficult to calculate a price index for the entire store, even if we had the data for all stockkeeping units, because the stockkeeping units carried by each store vary so much over time. In addition, this is an upscale retailer and is commensurately priced high on an everyday basis. The promotion variables cover significant price discounts implemented by the retailer.
Driving Online and Offline Sales
(CompetitorOnlineDisplayAdvertisingt). Our models also account for market-level fixed effects. MODEL DEVELOPMENT
Model Specification
The four dependent variables are offline sales, online sales, paid search impressions, and paid search clickthrough rate. Accordingly, we specify a system of equations for these four variables. We use a log-log model because it allows us to interpret the coefficients (for log independent variables) as elasticities. Advertising effects are likely to carry over to the next period(s) (e.g., Leone 1995). The carryover rate may be different for various media (e.g., traditional, display, search) because they serve different purposes in the purchase process. To cope with this, we use AdStock, or goodwill, for the long-term effect of each advertising medium on each dependent variable (Broadbent 1984). AdStock is the cumulative value of a brand’s advertising at a given point in time. Over time, advertising builds a stock of consumer goodwill, which subsequently decays over time (e.g., Broadbent 1984; Danaher, Bonfrer, and Dhar 2008). The model equations are as follows: (1) lnSearchImpressionst = b1, 0 + b1, 1TraditionalAdStockt + b1, 2OnlineDisplayAdStockt + b1, 3OnlineSearchSpendt + b1, 4ChristmasDummyt + b1, 5Trendt + u1, t,
(2) lnSearchClickThroughRatet = b2, 0 + b2, 1TraditionalAdStockt + β2, 2OnlineDisplayAdStockt + b2, 3OnlineSearchSpendt + β2, 4ChristmasDummyt + β2, 5Trendt + u2, t,
(3) ln OfflineSales mt = β 3,0 +
M −1
∑
m =1
β3,0,m D m
(3) ln OfflineSales mt + β 3,1TraditionalAdStock mt
(3) ln OfflineSales mt + β 3,2OnlineDisplayAdStock mt
(3) ln OfflineSales mt + β 3,3SearchClickthroughStock mt
(3) ln OfflineSales mt + β 3,4 CompetitorTraditionalAdvertisin g mt
(3) ln OfflineSales mt + β 3,5CompetitorOnlineDisplayAdvertisin g mt (3) ln OfflineSales mt + β 3,6ChristmasDummy t (3) ln OfflineSales mt + β 3,7 LargePromotion mt
(3) ln OfflineSales mt + β 3,8SmallPromotion mt + β 3,9Clearance mt (3) ln OfflineSales mt + β 3,10 Trend t + β 3,11UnemploymentRatemt (3) ln OfflineSales mt + β 3,12 DummyTestBannerAdvertisin g mt (3) ln OfflineSales mt + u 3,mt , and
(4) ln OnlineSales mt = β 4,0 +
M −1
∑β
m=1
533 4,0,m Dm
(4) ln OnlineSales mt + β 4,1TraditionalAdStock mt
(4) ln OnlineSales mt + β 4,2OnlineDisplayAdStock mt
(4) ln OnlineSales mt + β 4,3SearchClickthroughStock mt
(4) ln OnlineSales mt + β 4,4 CompetitorTraditionalAdvertisin g mt
(4) ln OnlineSales mt + β 4,5CompetitorOnlineDisplayAdvertisin g mt (4) ln OnlineSales mt + β 4,6ChristmasDummy t (4) ln OnlineSales mt + β 4,7 LargePromotion mt
(4) ln OnlineSales mt + β 4,8SmallPromotion mt + β 4,9Clearance mt (4) ln OnlineSales mt + β 4,10 Trend t + β4,11UnemploymentRate mt (4) ln OnlineSales mt + β 4,12 DummyTestBannerAdvertising mt (4) ln OnlineSales mt + u 4,mt ,
where TraditionalAdStockt and OnlineDisplayAdStockt are traditional and online display AdStock in week t (and for market m if these variables have an extra index “m”). Online SearchSpendt is paid search expenditures in week t, and SearchClickthroughStockmt is the stock of paid search clickthroughs. The variables Dm are 1 for market m and 0 otherwise. Their coefficients b3,0,m and b4,0,m are the fixed effects, accounting for differences in levels between markets.3 The stock variables in Equations 3 and 4 are defined as follows (e.g., Danaher, Bonfrer, and Dhar 2008): (5) TraditionalAdStockmt = λTraditionalTraditionalAdStockmt – 1 + (1 – λTraditional)ln(TraditionalAdvertisingmt + 1),
(6) OnlineDisplayAdStockmt
= λOnlineDisplayOnlineDisplayAdStockmt – 1
+ (1 – λOnlineDisplay)ln(OnlineDisplayAdvertisingmt + 1), and
(7) SearchClickthroughStockmt
= λSearchSearchClickthroughStockmt – 1
+ (1 – λSearch)ln(SearchClickthroughsmt + 1),
where TraditionalAdvertisingmt is the dollar expenditures on traditional advertising in market m in week t, OnlineDisplayAdvertisingmt is the display advertising spend, and SearchClickthroughsmt is the number of search clickthroughs in week t. We take the logs of these variables plus 1 to avoid taking the log of zero in case of a zero value. The term bi,j is the long-term advertising elasticity for medium j, dependent variable i, and (1 – λj)bi, j is the short-term advertising elasticity (Danaher, Bonfrer, and Dhar 2008). The stock variables in Equations 1 and 2 are defined analogously, but at the national level.
3The equations for search impressions (Equation 1) and click-through rate (Equation 2) control for trend and Christmas effects. Because these dependent variables are observed at the national level, econometrically it does not make sense to include market-specific control variables such as unemployment rates or promotions.
534
Endogeneity of advertising. The model allows for endogeneity of all advertising variables. A manager may plan weekly advertising expenditures according to demand shocks known to him or her but unknown to the researcher. This creates a correlation between the regressor (advertising) and the error term, which leads to a biased advertising coefficient if not addressed (e.g., Sethuraman, Tellis, and Briesch 2011). Another form of endogeneity is particularly relevant to search advertising. Managers may anticipate when consumers will do many Internet searches and adjust the paid search budget accordingly. This may create a spurious correlation between search advertising and sales. In summary, we need to account for possible endogeneity of the three own advertising stock variables (traditional, online display, and search) and the two competitor advertising variables (traditional and online display). One way to address endogeneity is to capitalize on exogenous variation in advertising in the data. As we explained previously, the focal company experimentally varied display advertising in test markets. However, this experiment accounts only for a small portion of display advertising, while traditional and paid search advertising were not varied experimentally. Therefore, we use instrumental variables (IVs) for the endogenous advertising variables. Finding suitable instruments is always a difficult challenge. We ruled out using lagged values of the endogenous variables because of the suspected presence of autocorrelation. Instead, we followed the logic of using marketing variables from a similar but different market as IVs. The logic is that shocks in costs that cause exogenous variation in marketing variables in one market will cause similar exogenous variation in the focal market. For example, costs of ingredients may drive price variation in region A similarly to the way it drives price variation in region B, and thus prices in region A can be used as IVs for prices in region B (Nevo 2001). Other researchers have also adopted the approach of using IVs based on noncompeting (but not too dissimilar) markets or categories (e.g., Lamey et al. 2012; Ma et al. 2011; Van Heerde et al. 2013). In our case, advertising is at the national level, but following the logic described previously, we argue that changing costs of advertising will cause exogenous variation in advertising spend across retailers serving different market segments. Thus, we use the advertising expenditures of lower-end retailers as IVs for advertising levels of the focal high-end retailer and its main high-end competitor. The lower-end retailers are in lower price brackets, while the focal firm and its competitor are upscale stores. Therefore, the lower-end retailers are unlikely to influence sales of the focal retailers and thus will not be correlated with the error term of the main model (Equations 1–4), and yet they will be subject to the same exogenous cost shifts that the focal firm and its competitor face. Specifically, the IVs include log traditional and online display advertising expenditures (plus 1) from eight lower-end retailers, for a total of 16 instruments (eight nondirect competitors, each with two types of advertising—traditional and online display). These 16 IVs are not used elsewhere in the system, which is sufficient for five endogenous regressors. We formally test the adequacy of the instruments in the next section. We also test
JOURNAL OF MARKETING RESEARCH, OCTOBER 2014
a different set of cost-based IVs, which we discuss further in the “Robustness Checks” section. Heterogeneity in response parameters. While the model allows for market fixed effects, there may be heterogeneity in response parameters across markets. For example, some markets may show a stronger response to advertising and other marketing activities than other markets. One alternative for addressing this possible issue is to estimate a separate model for each market; another is to formulate a hierarchical model and estimate it using Bayesian techniques. However, a first step is to investigate whether market heterogeneity is present. A pooling test confirmed that for this retailer, markets can be pooled (we offer further details in the next section). Error terms. There is potential for autocorrelation (ui, t and ui,mt are error terms) caused by omitted variables (e.g., weather) that affect shopping behavior and would tend to be correlated over time. We allow for autocorrelation in the estimation of the model: ui,t = riui,t – 1 + ei,t (i = 1, 2), and ui,mt = riui, mt – 1 + ei, mt (i = 3, 4). There is also potential for error correlations between the four dependent variables. For example, favorable weather conditions (part of the error term) may draw consumers to the physical store and thereby increase offline sales, at the expense of online sales. Therefore, we allow for contemporaneous covariances between the error terms: cov(ei,t, ej,t) = sij, cov(ei, t, ej, mt) = sijm, and cov(ei, mt, ej, m¢t) = sijmm¢. Model estimation. The model accommodates endogeneity, advertising carryover effects, contemporaneous correlations, and autocorrelation. The resulting model is nonlinear in the parameters because the AdStock carryover parameter is multiplied by the parameter representing the impact of AdStock on each of the dependent variables. We estimate the model by using a three-stage least squares (3SLS) adaptation of Parks (1967) augmented with a grid search for the carryover parameters. Details are available in Web Appendix A. Model Testing
MODEL RESULTS
We test the model specification in two ways: bottom-up and top-down. The bottom-up approach relies on a series of specification tests (e.g., pooling, endogeneity). The topdown approach estimates models under different assumptions (e.g., account for endogeneity vs. do not account for endogeneity) and compares model fit and the robustness of the findings. Specification tests.4 First, we conduct a pooling test to determine whether we can pool response parameters across regions. Second, we test for stationarity in the dependent and independent variables. Third, we investigate the strength (explanatory power) of the IVs. Fourth, we test for endogeneity in each of the four equations. Fifth, we test the overidentifying restrictions for the IVs. Sixth, we compare the dynamic model to a static model. Seventh, we test for autocorrelation. Eighth, we test for the direct effect of impressions on sales beyond the effect of search clickthroughs. 4These tests all account for the fact that we are dealing with a balanced panel. For example, we use fixed effects for each market in our tests.
Driving Online and Offline Sales
Table 3 summarizes the specification tests. They suggest a model that pools across markets, uses variables in levels (as opposed to first differences), includes autocorrelation, and includes advertising carryover. Endogeneity must be accounted for in the online and offline sales equations but not in the search impressions and click-through rate equations. Thus, the manager does seem to set advertising levels based on unobserved shocks in demand but not based on unobserved shocks in the intermediate (and perhaps less visible) metrics for impressions and click-throughs. The IVs are empirically adequate, and after controlling for the effect of search click-throughs, there is no direct effect of impressions on sales. Comparative model testing. We now proceed to the comparative model testing approach to specification, as shown in Table 4. We estimate seven models, ranging from a static ordinary least squares (OLS) model (Model 1) to a model that includes endogeneity, carryover, advertising carryover, autocorrelation, and contemporaneous correlation (Model 7). At this stage, we are most interested in comparative fit; subsequently, we will compare the coefficients (shown in Web Appendix C) as robustness checks. Before we begin comparing fit, however, it is important to realize that models that account for endogeneity do not have the best fit (Ebbes, Papies, and Van Heerde 2011). The reason is that OLS will minimize the sum of squares, whereas two-stage
535
least squares (2SLS) and related approaches will tilt the regression line away from the best-fitting OLS line. To compare apples with apples, we first observe the models that do not correct for endogeneity. Among these models, Model 5 has the best (lowest) Bayesian information criterion (BIC), suggesting a model that includes autocorrelation, cross-equation correlation, and advertising carryover. Among the models that correct for endogeneity, Model 7 is superior, again suggesting that it is crucial to account for autocorrelation, cross-equation correlation, and advertising carryover. The superiority of Model 7 to the other models that account for endogeneity, plus our bottom-up specification testing, indicates that we should include carryover effects, contemporaneous error correlations, and autocorrelated errors. The Hausman–Wu test suggests that we should include endogeneity in the online and offline sales equations but not in the impressions and click-through rate equations. This leads to a choice of Model 7. Model Fit
The purpose of this analysis is descriptive rather than predictive. However, it is still worthwhile to examine model fit. Figure 3 shows predicted and observed dependent variables for a representative market. The vertical axes are on a log scale, and the horizontal axes cover the entire two-year time
Table 3
Test
SPECIFICATION TESTS
Heterogeneity across markets: A pooling test (e.g., Greene 2000, p. 289) is used to determine whether markets can be pooled or whether we need to estimate separate models and employ a hierarchical structure. The null hypothesis is that the slope parameters are the same across markets.
Outcome
The pooling tests for the two dependent variables—OfflineSales (F = 1.07, d.f.1 = 231, d.f.2 = 2,270, p > .10) and OnlineSales (F = 1.08, d.f.1 = 231, d.f.2 = 2,270, p > .10)—suggest that pooling is appropriate. This is not surprising given that (well-off) clientele may have similar behavioral characteristics across markets, combined with a nearly uniform marketing strategy in terms of assortments, pricing, and promotions. Stationary variables: An augmented Dickey–Fuller test is performed on the The p-values (all < .05; see Web Appendix B) suggest that there are no unit core dependent and independent variables (Greene 2000, p. 783) to determine roots. To avoid overdifferencing, we use variables in levels rather than in first if first differencing is necessary. The null hypothesis is that there is a unit differences. Overdifferencing may result in higher standard errors (Plosser root for these variables. and Schwert 1978). Instrumental variable strength: An incremental F-test is used to measure the The p-values for the exclusion of the IVs suggest that the IVs are sufficiently strength of the IVs (Greene 2000, p. 360). We regressed each endogenous strong (p < .01, for each of the five endogenous regressors). The first-stage regressor first against the exogenous variables in the model; next we added regression R-squares are .98, .98, and .94 for TraditionalAdvertising, the IVs and conducted an incremental F-test for the explanatory power of OnlineDisplayAdvertising, and SearchClickthroughs, respectively. These these IVs. The null hypothesis is that the IVs do not add explanatory power. R-squares are significantly higher than for the first-stage regressions excluding the IVs, which are .88, .83, and .90, respectively Endogeneity in advertising: A Hausman–Wu is used to test for endogeneity in The p-values suggest that endogeneity is present in the offline and sales each of the four equations (Wooldridge 2002, p. 121). The null hypothesis is equations (p < .01) but not in the impressions and click-through rate that OLS and IV estimates are equal and that endogeneity does not exist. equations (p = .968 and .711, respectively). Overidentifying restrictions: A Sargan test is used to test for overidentifying Because we fail to reject the null (the p-values for the offline and online sales restrictions (Verbeek 2004, p. 147). The null hypothesis is that the residuals are .46 and .28), we can have some confidence in the overall set of instruments and instruments are indeed uncorrelated (Angrist and Pischke 2009, p. 143). used (Wooldridge 2002, p. 123). It could also be that the test has low power for detecting endogeneity of some of the instruments (Wooldridge 2002, p. 123). Dynamics test: We compare a dynamic model with a static one to test the The likelihood ratio test rejects (p < .01) the static specification with contemnecessity of including dynamics. We used the likelihood ratio test and BIC to poraneous advertising effects in favor of the dynamic Model 7 with AdStock determine whether this pays off in additional explanatory power. variables. Likewise, the BIC values suggest that the penalized fit is better for the dynamic model (–2.84) than for the static model (–2.80). Autocorrelation: Statistical significance of the autocorrelation coefficients The p-values (all < .01) suggest these autocorrelations are significant for all (Franses and Paap 2001, p. 40) is tested. To achieve this, we estimated a four dependent variables. version of the model without accounting for autocorrelations. Direct effect of search impressions on offline and online sales: The argument The augmented specifications (one treating search impressions as an here is that the mere exposure to search results (even without clicking exogenous variable and one treating search impressions as an endogenous through) may enhance preferences and, thus, sales. variable) do not improve BIC. The likelihood ratio tests (p > .10) confirm that adding the direct sales effect of impressions is not required.
5,356 86 271.20 .99275 –2.845
OLS
Current Same-period effects No No No
Model 1
5,356 86 279.30 .99253 –2.816
2SLS
Current Same-period effects No No Yes
Model 2
5,356 86 278.85 .99254 –2.817
Parks (1967)
Current Same-period effects Yes Yes No
Model 3
5,356 86 285.06 .99237 –2.795
3SLS+Parks (1967)
Current Same-period effects Yes Yes Yes
Model 4
Notes: All models include fixed effects for markets. The separate grid searches for Models 6 and 7 yielded the same carryover effects λ.
Total number of observations Total number of parameters System sum of squared residuals System R2 System BIC (lower is better)
Optimal carryover parameters
Estimation
Modeling of advertising effects Interpretation of advertising elasticities Contemporaneous error correlations Autocorrelated errors Endogeneity correction
Model Characteristic
Table 4
MODEL COMPARISON
λTraditional = .91 λOnlineDisplay = .82 λSearch = .00 5,356 89 259.51 .99306 –2.885
Parks (1967) + grid search
AdStock Long-term effects Yes Yes No
Model 5
3SLS + Parks (1967) + grid search λTraditional = .89 λOnlineDisplay = .84 λSearch = .00 5,356 89 271.86 .99273 –2.838
AdStock Long-term effects Yes Yes Yes
Model 6
AdStock Long-term effects Yes Yes Yes for sales and no for click-through rate and impressions 3SLS + Parks (1967) + grid search λTraditional = .89 λOnlineDisplay = .84 λSearch = .00 5,356 89 270.26 .99277 –2.843
Model 7 (Focal Model)
536 JOURNAL OF MARKETING RESEARCH, OCTOBER 2014
Driving Online and Offline Sales
537
Figure 3
OBSERVED VERSUS PREDICTED LOG VALUES FOR A REPRESENTATIVE MARKET (NORMALIZED BY THE OBSERVED VALUES) A: Online Sales
16.0 15.5 15.0 14.5 14.0 13.5 13.0 12.5 12.0
1
6
11
16
21
Observed log store sales
26
31
36
41
46
Predicted log store sales
51 56 Week
61
66
71
76
Observed log online sales
81
86
91
96
101
Predicted log online sales
B: Search_Clickthrough Rates
–2.0
Observed log Search_Clickthrough rate Predicted log Search_Clickthrough rate
–2.5 –3.0 –3.5 –4.0 –4.5 –5.0
1
11
21
31
41
51 Week
61
71
81
91
101
C: Search Impressions 16.0
Observed log search impressions Predicted log search impressions
15.5 15.0 14.5 14.0 13.5 13.0 12.5
1
11
21
31
41
51 Week
61
71
81
91
101
538
period. The top panel of Figure 3 verifies that the fit is similar for both store sales (R2 = .91) and online sales (R2 = .96). The results capture Christmas seasonality (around weeks 13 and 65) as well as several of the promotional sales bumps. Note that the promotional spikes are more prominent instore compared with online, and our model picks this up. The predictions capture the general trends in the data well, although the model does miss some of the spikes. Search impressions (see the bottom panel of Figure 3; R2 = .86) are more predictable than the click-through rate (see the middle panel of Figure 3; R2 = .41). Overall, we believe that the Rsquares and Figure 3 demonstrate that our models fit the data well.
JOURNAL OF MARKETING RESEARCH, OCTOBER 2014
Impressions and Click-Through Rate Models
Table 5 shows the results of the impressions and clickthrough rate models.5 The impressions model shows that search advertising expenditures are strongly and positively associated with the number of impressions, as expected (b = 1.136, two-sided p = .000; we use two-sided tests throughout). Traditional advertising expenditures have a marginally significant, positive association with impressions (b = .066, p = .064), suggesting that traditional ads stimulate customers’ need recognition and customers therefore search more for the keywords on which the retailer has bid. The Christmas effect is negative (b = –.097, p = .021), which is somewhat surprising at first because one would expect more searches during the Christmas season. However, for a given budget, the number of impressions decrease during the Christmas season because (1) companies may increase their bids during the Christmas season, thus increasing cost per click, and (2) as we observe for the click-through model, click-through rates increase during the Christmas season. These two factors mean that the budget will be exhausted with fewer impressions during the Christmas season—thus, the negative impact on impressions. The click-through model shows that an increase in paid search expenditures is associated with a decrease in clickthrough rate (b = –.271, p = .000). This is consistent with the long-tail phenomenon we discussed previously (Rutz and Bucklin 2013). That is, as firms increase paid search expenditures, they bid on more esoteric keywords that have lower click-through rates. Most importantly, this finding 5Web Appendix D offers the covariance matrix of the error terms and the autocorrelation coefficients.
suggests that increased paid search expenditures increase impressions but decrease click-through rates, exerting both positive and negative forces on total clicks. We subsequently show how this nets out in terms of own- and crosschannel effects of paid search. Perhaps most noteworthy is that traditional advertising is associated with lower click-through rates (b = –.100, p = .006). Previously, we conjectured that traditional advertising might increase awareness and therefore enhance clickthrough rate or, through an information substitution effect, provide the information consumers need to determine whether to shop at the retailer. It appears that, for this retailer, the information substitution effect dominates. This has critical implications for the cross effects of traditional advertising, as we demonstrate when we calculate the total cross effect of traditional advertising on online sales. Sales Models
We first discuss the impact of the control variables on sales to assess the face validity of the model (Table 6). As we expected, an increase in unemployment has a statistically significant, negative impact on both online and offline sales. The Christmas season has a statistically significant, positive relationship on both online and offline sales. Large promotions are generally more impactful than small promotions, and clearance sales have the greatest impact on both online and offline sales. All promotions have a greater impact on offline sales than online sales, possibly because the price discrimination that underlies the price promotional element of promotions is executed more effectively or prominently in the offline environment. Competitive advertising does not have a large effect; the one significant result is a negative association between competitor traditional advertising and online sales. We believe that there are two counteracting forces involving competitor advertising. On the negative side is the usual supposition that competitive advertising attracts customers away from the focal retailer. On the positive side, competitor advertising can stimulate need recognition (e.g., it can motivate a customer to shop for a cashmere sweater), and this is a benefit to the focal retailer. As a result, it is not surprising that in our context, competitor advertising does not exert a large impact. Overall, these results provide face validity for the model. Unemployment, the Christmas season, promotions, and the
Table 5
FOCAL MODEL RESULTS FOR SEARCH IMPRESSIONS AND SEARCH CLICK-THROUGH RATE
Intercept Traditional advertising Online display advertising Paid search advertising Christmas dummy Trend Number of observations R2
*.05 < two-sided p-value £ .10. **two-sided p-value £ 0.05.
b
.979 .066* .035 1.136** –.097** .001
Search Impressions Search SE
.852 .035 .046 .029 .042 .002
t
1.149 1.856 .763 38.778 –2.311 .339
103 .864
p-Value .251 .064 .445 .000 .021 .735
b
2.293** –.100** –.073 –.271** .111** –.007**
Click-Through Rate SE
.875 .036 .046 .033 .047 .002
t
2.621 –2.773 –1.570 –8.129 2.372 –3.879
103 .408
p-Value .009 .006 .117 .000 .018 .000
Driving Online and Offline Sales
539
Table 6
FOCAL MODEL RESULTS FOR OFFLINE SALES AND ONLINE SALES Offline Sales
b
SE
Traditional advertising .084* Online display advertising .119* Paid search click-throughs .158* Competitor traditional advertising –.003 Competitor online display advertising .011 Christmas dummy .191* Large promotions .046* Small promotions .012* Clearance promotions .196* Trend .005* Unemployment rate –.332* Dummy test banner advertising .011 Number of observations R2
t
.016 5.319 .028 4.242 .059 2.697 .021 –.158 .008 1.506 .054 3.524 .006 8.146 .003 4.830 .025 7.880 .001 5.521 .057 –5.872 .012 .941 2,575 .912
p-Value .000 .000 .007 .874 .132 .000 .000 .000 .000 .000 .000 .347
b
.035* .152* .182* –.067* –.009 .256* .010* .005* .034* .007* –.727* –.009
Online Sales
SE
p-Value
t
.015 2.435 .024 6.358 .049 3.707 .018 –3.742 .006 –1.380 .043 5.928 .004 2.487 .002 2.544 .011 2.929 .001 10.141 .059 –12.416 .009 –.948 2,575 .960
.015 .000 .000 .000 .168 .000 .013 .011 .003 .000 .000 .343
*two-sided p-value £ .05. Notes: We have omitted the estimates for the fixed effects for markets for the sake of space. However, these estimates are available on request.
advertising of a close competitor all have sensible and statistically significant effects on the dependent variables. Elasticities and Carryover Coefficients
We now focus on advertising elasticities. In Table 6, we observe strong evidence of cross effects for all three forms of advertising. For traditional advertising, the .035 (p = .015) online elasticity is a direct cross effect, although it will be partially offset by the indirect effect due to its negative impact on click-through rate. The direct cross effect of online display on offline sales is an elasticity of .119 (p = .000). For paid search, the .158 (p = .007) elasticity on offline sales is with respect to clicks. To compute the effect with regard to paid search expenditures, we account for the positive association between expenditures and search impressions as well the negative association with clickthrough rates. However, even without the complete elasticity calculations, there is ample evidence of strong cross effects. Table 7 shows the estimated carryover coefficients for the three forms of advertising. Notably, both traditional (.89) and online display advertising (.84) have relatively high carryover, suggesting that these media increase consumer awareness and knowledge for long periods of time. How-
Table 7
ADVERTISING CARRYOVER COEFFICIENTS (λ) AND DURATION INTERVALS Type of Advertising
Traditional advertising Online display advertising Paid search advertising
.89 .84 .00 λ
90% Duration Interval (Weeks) 20 13 0
Notes: 90% duration interval = ln(1 – .90)/ln(λ) (Leone 1995).
ever, the paid search carryover is zero, meaning that the impact is felt immediately. This is consistent with our context of a clothing department store, in which we can assume that a consumer who types in a search keyword has a clear need and wants to buy something right away, not weeks in the future. Table 8 shows how the total long-term advertising elasticities can be decomposed. We focus first on cross effects. Traditional advertising’s direct effect on online sales is .035, but there is a negative indirect cross effect of –.006. The negative indirect effect is due to traditional advertising’s marginally significant, positive effect on impressions and
Table 8
TOTAL LONG-TERM ADVERTISING ELASTICITIES AND THEIR DECOMPOSITION (BOLDFACED NUMBERS ARE CROSS-CHANNEL EFFECTS
Traditional advertising
Online display advertising
Paid search advertising
Direct Effect (a)
.084** (.016) .119** (.028)
Offline Sales Indirect Effect (b)
–.005* (.003) –.006 (.004) .137** (.051)
Total Effect (a)+(b) .079** (.016) .113** (.028) .137** (.051)
Direct Effect (c)
.035** (.015) .152** (.024)
Online Sales Indirect Effect (d)
–.006** (.003) –.007* (.004) .158** (.043)
Total Sales Elasticitya
Total Effect %Revenuesonline ¥ (a+b) + (c)+(d) %Revenuesonline ¥ (c+d) .029* (.015) .145** (.024) .158** (.043)
.071** (.014) .118** (.024) .140** (.044)
*.05 < two-sided p-value £ .10. **two-sided p-value £ 0.05. aIn this calculation %Revenues offline = .85 (%Revenuesonline = .15) because in the application, 85% of sales goes through the offline channel. Notes: The standard errors (in parentheses) were calculated with the Delta method (see Web Appendix E and Greene 2000, p. 300).
540
significant, negative effect on click-through rate. A possible interpretation is that (1) traditional advertising stimulates need recognition and initiates consumer information search, leading to a marginally positive impact on impressions, but (2) due to the information substitution effect (i.e., traditional ads provide information that could be provided by a clickthrough), click-through rate declines. The positive direct effect (.035) is not entirely wiped out by the negative indirect effect (–.006), but it is diminished to a total cross effect of traditional advertising on online sales of .029. The results regarding the cross effect of online display advertising on offline sales are in the same direction but are of a different magnitude. The direct effect on offline sales is .119 and the indirect effect is –.006. This results in a total cross effect of .113 for online display advertising. The elasticity of search advertising on offline sales is .137. The positive impact on impressions (1.136 elasticity) is partially offset by the decrease in click-through rate (–.271 elasticity). However, the retailer still retains a net .865 elasticity for the effect of search spend on click-throughs, and because more click-throughs lead to more offline sales (b = .158; see Table 6), the cross effect of search advertising on offline sales is .865 × .158 = .137. In summary, the cross effect elasticities of traditional, display, and search advertising are .029, .124, and .137, respectively. In comparison, Table 8 shows the own effects are .079, .145, and .158. Cross effects are clearly important, especially for online media. Total Elasticities
It is straightforward to show that the total elasticity equals the weighted sum of own and cross elasticities, the weights being the percentage of sales that are in offline versus online channels. Intuitively, elasticity is a percentage increase; if that percentage is from a higher base (as is the case if the particular sales channel is the majority of sales), it will be more influential in the total effect. Table 8 shows that the total sales elasticities of traditional, online display, and paid search advertising are .071, .128, and .140, respectively. Traditional advertising remains effective because although it has a relatively small cross effect on online sales, offline sales represent the majority of sales for this retailer (85%). However, online advertising elasticities are generally higher than traditional advertising elasticities. Table 8 shows that much of the strength of online advertising is due its cross effect on offline sales. For example, the total sales elasticity of paid search is 85% × .137 + 15% × .158 = .140. The first term is the contribution of the cross effect of paid search. ROI
To more tangibly examine the advertising elasticities, we compute ROI. For this calculation, let Soffline = offline sales and hoffline = the elasticity of offline sales with respect to advertising. Similarly, define Sonline and honline. Let m = profit margin, A = the level of advertising expenditure, and ’ = profit. In a multichannel environment, ’ = m[Sonline + Soffline] – A. Here, ROI is the change in profits per unit change in advertising, or in derivative form, (∂’/∂A) = m[(∂Sonline/∂A) + (∂Soffline/∂A)] – 1. The elasticity of online sales with respect to advertising is defined as honline = [(∂Sonline/∂A)(A/Sonline)], so that (∂Sonline/∂A) = honline(Son-
JOURNAL OF MARKETING RESEARCH, OCTOBER 2014
line/A); the equation is similar, for hoffline; Substituting, we get
ROI =
S S ∂Π = mηonline online + mηoffline offline – 1. A A ∂A
We refer to the first term in this equation as the online channel contribution and the second term as the offline contribution.6 For paid search, using a 35% margin,7 the elasticities in Table 8, and the descriptive statistics in Table 2, ROI = offline channel contribution
ROI + online channel contribution – 1
324,685.3 ROI = .35 × .137 × 39,965 25
68,363.0 ROI + .35 × .158 × −1 39,965.6 25 ROI = $9.71 + 2.36 – 1 = $11.07.
Clearly, the offline channel contribution of paid search ($9.71) plays an important role in the total ROI of paid search ($11.07). Table 9 shows the calculations for all three media, for the short run and the long run. Traditional advertising has a long-term ROI of $4.23, and we observe that most is contributed by own effects ($4.86 > $.38). This is because although the cross effect of traditional advertising on online advertising is positive, it is not large (.029 vs. .079 own elasticity). The online display and paid search advertising ROIs are $7.29 and $11.07, respectively, and most is contributed by cross effects ($6.66 and $9.71, respectively), that is, from the impact on the offline channel. The ROIs for paid search are large, but they are more conservative than the emerging knowledge base on search advertising. Wiesel, Pauwels, and Arts (2011, Table 4) provide the most direct comparison. They find an ROI of €56.72 for the long-term, multichannel return from search advertising. A recent industry study reported search ROIs of £17–£27 for a British travel agency (Murphy 2008). We also find industry data supporting an average search campaign ROI of 6.03 Yuan for a Chinese cosmetics e-tailer (Yang 2011). In summary, online display and search advertising ROIs are strong, and this is reflected in the trend we observe in advertising funds being allocated to online media. A noteworthy finding is that the largest contribution to these ROIs are the cross effects. This is because the cross effect elasticities are strong and the offline channel represents 85% of total sales. Many companies evaluate paid search ROI by assessing click-through and conversion in only the online channel. This may be appropriate under certain conditions but often does not consider long-term effects and certainly
6Note that we cannot calculate separate online and offline ROIs. The reason is that we do not infer how much of the advertising should be “allocated” to each channel. This is the attribution problem that is the subject of ongoing research but beyond the scope of this article. We thank an anonymous reviewer for pointing out this issue. The contribution-to-ROI calculations we make still serve to show the economic importance of cross effects. 7The company’s annual report states that the cost of goods sold is approximately 65% of revenues.
Driving Online and Offline Sales
Traditional
Online display Paid search aROI
Within-Channel Contribution
$.53 (offline Æ offline) $.26 (online Æ online) $2.36 (online Æ online)
Table 9 Short Run
Cross-Channel Contribution
$.04 (offline Æ online) $1.07 (online Æ offline) $9.71 (online Æ offline)
= within-channel contribution + cross-channel contribution – 1.
does not include cross-channel effects, which are important for this retailer. Scenario Analysis
To establish face validity and show how the model can be used to evaluate advertising strategy, we ran a scenario analysis in which we simulate the impact of an increase in each form of advertising by 40% during a six-week period in one market. We schedule this increase (weeks 19–24 of the data) during a time window without major holiday time periods (weeks 18–30). The chosen market is one of the smaller ones in the data set, although we observe similar results for others. Figure 4 shows the results. The graphs show how the dynamics play out. Note that the impacts of traditional (Figure 4, Panel A) and display (Panel B) advertising are small at first but have significant carryover before wearing out. In contrast, the impact of search advertising is immediate and declines to zero at the end of the campaign (Panel C). The graphs show that the effects are sizable but not unreasonable. For example, they are not larger per period than the effect due to the large promotion that occurs in week 24. Robustness Checks
541
Parameter estimate stability. We conducted robustness checks to demonstrate the stability of our results. Web Appendix C shows the estimated parameters for the seven models defined in Table 4. We find that the parameters are remarkably stable across this wide variety of models. Focusing on the impact of advertising, (1) in the offline sales model, all three forms of advertising are positive and significant (at p < .06) in all models. (2) In the online sales model, all three forms of advertising are positive and significant except traditional advertising’s impact in Model 3. However, the coefficient .016 is similar to the other models. (3) In the impressions model, display is insignificant in all models, but paid search is significant and positive in all models. There is some discrepancy involving traditional advertising. Traditional advertising is significant and positive in Models 1–4, insignificant in Models 5–6, and marginally significant in Model 7. (4) In the click-through rate model, traditional and paid search have a significant, negative impact (at p < .064) in all seven equations. The finding that traditional advertising decreases click-through rates is an important result that decreases the effectiveness of both traditional and search advertising. The carryover parameter λTraditional for traditional advertising is stable across Models 5–7 (.91, .89, and .89, respectively). The same holds for
ROI
ROI*
–$.42 $.33
$11.07
Within-Channel Contribution
$4.86 (offline Æ offline) $1.64 (online Æ online) $2.36 (online Æ online)
Long Run
Cross-Channel Contribution
$.38 (offline Æ online) $6.66 (online Æ offline) $9.71 (online Æ offline)
ROIa
$4.23
$7.29
$11.07
carryover parameter λOnlineDisplay for online display advertising (.82, .84, and .84, respectively), and for λSearch for paid search (.00 for all three models). Overall, our findings are robust. IVs. We also conducted a robustness check using an entirely different set of IVs based on costs of advertising inferred from two public sources, Kantar Media’s Ad$pender and the Bureau of Labor Statistics (BLS). With the Kantar data, we calculated weekly unit costs for television, magazine, newspaper, and online display for the retail industry as a whole. From the BLS data, we used quarterly producer price indexes for periodicals and for newspapers. These six measures had relatively low correlations, implying that they measure different costs. Importantly, the key substantive results from this alternative set of IVs are robust (see Web Appendix F): (1) The model still nets significant, positive cross effects from online media to offline sales and from offline media to online sales, and (2) there is still a significant, negative impact of traditional advertising on search click-through rate. There are two reasons we believe the noncompetitor advertising IVs are preferable: (1) They are stronger: the focal IVs increases the R-square in predicting the dependent variable more than the cost-based IVs, and (2) the fit, as measured by BIC for the model using the noncompetitor IVs, is better (Ebbes, Papies, and Van Heerde 2011). Nonetheless, we view the cost-based IVs as an important robustness check because they yield similar results. Holdout sample analysis. We also examined the model’s predictive accuracy with a holdout sample (Web Appendix G). While holdout sample validation should not be used to compare models with versus without endogeneity correction (Ebbes, Papies, and Van Heerde 2011), it is important to check that the focal model is not overfitting. We first use one calendar quarter for holdout, meaning 90 weeks calibration and 13 weeks holdout. In terms of correlations, our final model (Model 7) shows no degradation between estimation and holdout samples. This is in contrast to Models 1–4, which show serious degradation on click-through rate. However, in terms of mean square error (MSE), the models with AdStock (Models 5–7) show some degradation, while the models without AdStock (Models 1–4) show less. Further inspection shows that Models 5–7 slightly underpredict on average (positive mean errors), causing MSE degradation. In the estimation sample, the carryover for online display is higher (.94) than for the full sample (.84), creating an AdStock variable that is at a different mean level, and as a result, the model somewhat underpredicts (though the correlations remain high). Figure 2 shows a
542
notable decline in display advertising toward the end of the observation period, suggesting that the model needs more observations to capture the dynamics. Indeed, increasing the estimation window from 90 weeks to 96 yields estimated carryover coefficients of .85 for online display, which is very close to the full sample value (.84). This longer prediction
JOURNAL OF MARKETING RESEARCH, OCTOBER 2014
Figure 4
SALES SCENARIO ANALYSIS FOR A MARKET (STANDARDIZED TO $100,000 AVERAGE SALES PER PERIOD) A: Scenario 1: Increase Traditional Advertising by 40% During a SixWeek Campaign $40,000 $35,000 $30,000
Store Sales
Online Sales
$160,000 $150,000 $140,000 $130,000 $120,000 $110,000 $100,000 $90,000 $80,000
$25,000 $20,000 18 19 20 21 22 23 24 25 26 27 28 29 30 Week
$15,000 $10,000
B: Scenario 2: Increase Online Display Advertising by 40% During a SixWeek Campaign $40,000 $35,000 $30,000
Store Sales
Online Sales
$160,000 $150,000 $140,000 $130,000 $120,000 $110,000 $100,000 $90,000 $80,000
$25,000 $20,000 18 19 20 21 22 23 24 25 26 27 28 29 30 Week
$15,000 $10,000
C: Scenario 3: Increase Paid Search Advertising by 40% During a SixWeek Campaign $40,000 $35,000 $30,000
Store Sales
Online Sales
$160,000 $150,000 $140,000 $130,000 $120,000 $110,000 $100,000 $90,000 $80,000
$25,000 $20,000 18 19 20 21 22 23 24 25 26 27 28 29 30 Week Base store sales Store sales with six-week 40% increase in advertising Base online sales Online sales with six-week 40% increase in advertising
$15,000 $10,000
Notes: Sales have been normalized to start at $100,000 in the store sales channel.
period leads to no degradation in correlation and MSE, and Model 7 is now the best-fitting model in terms of holdout MSE. In summary, we find no degradation in predictive accuracy as long as the estimation period has enough observations for our model to estimate advertising carryover correctly. DISCUSSION
Our results demonstrate that the impact of advertising is not just within a single purchase channel but rather across multiple channels. These cross-channel effects are particularly important for online advertising. The cross effect of traditional advertising is statistically significant but is mitigated by a negative indirect effect that undermines the effectiveness of paid search. This is due to a particularly noteworthy result: traditional advertising is associated with more impressions but a lower click-through rate, and the latter effect dominates. Measuring the impact of advertising on only a single channel does not fully account for its total impact. In the case of online advertising, we find that doing so can significantly underestimate its effect. For example, many firms multiply the probability that a customer who clicks their paid search ad will purchase or “convert” (e.g., 2%) by the amount they earn from that purchase (e.g., $50) to determine a maximum amount to pay for that click (e.g., 2% × $50 = $1.00). However, this calculation does not account for our finding that paid search advertising has a significant impact on offline sales, and this contributes strongly to the ROI of paid search (Table 9). In addition, cross effects can carry over to future time periods. For example, the short-term offline sales ROI contribution from display advertising is $1.07. Taking a longterm perspective, the carryover coefficient of .84 for display kicks in, and the ROI is $6.66. This supports the notion that display ads work primarily not as a click-through tool but as a billboard that can be used to build awareness and influence customers at the beginning of their decision-making process. In any case, cross effects, both immediate and long-term, are crucial for evaluating online advertising. The cross effect for traditional advertising takes even longer to fully materialize, as its carryover effect (.89) is the highest among the three forms of advertising. The large cross effects for search advertising support the notion of research shopping (Verhoef, Neslin, and Vroomen 2007). By design, paid search routes the customer to the firm’s website, but the purchase is not made online; it is made at the store. This behavior is rational for customers of this retailer, for which there are many nondigital attributes (Lal and Sarvary 1999) and the risk of online purchase is high due to uncertainties related to size, color, fit, and so forth. Because the carryover coefficient for search advertising is zero, its impact is immediate. For this particular firm, online advertising (display and paid search) outperforms traditional advertising in terms of elasticities and ROI. Although the cause for these differences is not definite, we can make some conjectures. The strong results for search advertising are probably due to the medium’s “value proposition,” in that search advertising targets customers who are already in the process of buying. As a result, paid search expenditures translate more readily into purchases. Online display and traditional advertising may be similarly focused on impression-based awareness.
Driving Online and Offline Sales
However, it is also possible that this retailer’s display advertising is better targeted than the traditional advertising. Subsequent discussions with the firm’s managers revealed that 40%–50% of its display ads were “re-targeted” (i.e., served to customers who had recently visited the firm’s website). This represents another reason to control for endogeneity, as this model does: the online environment also enables customization of advertisements based on web content (Hauser et al. 2009), whereas traditional advertising such as newspapers and radio cannot be customized. Our work has significant managerial implications: First, online and offline advertising, like online and offline purchase channels, should not be managed in silos. Cross effects suggest that online ads can be used as a way to grow the offline channel, and this requires cooperation and coordination. Second, our results suggest that traditional advertising does not enhance the effectiveness of paid search. While there is a marginally positive association with paid search impressions, this is tempered by a negative association with click-through rates. Managers need to find a way to reverse this negative effect. Perhaps the traditional advertising copy could be redesigned to encourage click-throughs by suggesting that the customer search online for a specific item, thus setting up the customer to click through on the paid search ad. Third, the finding that paid search had a negative association with click-through rates suggests that the marginal dollar spent on paid search is being spent on keywords with lower click-through rates. This supports the longtail effect noted by Rutz and Bucklin (2013). At a macro level, this is an important insight for managers planning ahead in terms of their paid search budgets. At a micro level, it suggests that advertising agencies must select keywords carefully when provided with an expanded budget. There are undoubtedly high-performing as well as low-performing long-tail keywords. CONCLUSION
In this article, we demonstrate the existence and importance of cross-channel advertising effects and provide insights into how these cross effects work. We develop a nonlinear (in the parameters) sales response model that accounts for (1) endogeneity of advertising, (2) dynamic advertising effects, (3) multiple dependent variables, (4) autocorrelation, and (5) competitive advertising effects. Our model addresses one of the key research priorities identified by the Marketing Science Institute (2014) by assessing the relative effectiveness of digital advertising media compared with traditional media. This model also answers Zhang et al.’s (2010) call for assessing cross-channel effects. For the specific retailer studied, we find that advertising cross effects are large, particularly from online advertising to offline sales. Most importantly, the comparable magnitudes between cross and own effects suggest that it is imperative for firms to consider cross effects in evaluating advertising ROI as well as aligning expenditures per channel with goals. Overall, our findings suggest that online advertising, which is often thought of as strictly an online tool, can effectively grow the offline channel. The AdStock estimates imply that the cross effects of traditional and online display media are not ephemeral but have a significant temporal carryover. This result is well established for traditional media but is an important new
543
finding for online display. The lack of a long-term effect for paid search is somewhat surprising in view of previous research (Rutz and Bucklin 2011; Rutz, Trusov, and Bucklin 2011). Perhaps our results differ because the industry we examined is a high-end clothing retailer. As a result, customers may not learn much from a single click-through. That is, they are familiar with the retailer and will click a paid search advertisement if it seems relevant, but this does not carry over to future sales. Further Research
Undoubtedly, many of our specific empirical findings are due to the nondigital attributes of products in this particular industry: high-end clothing/accessories retailing. However, the framework and the system of equations can easily be applied to other industries and to measure the impact of other types of advertising or consumer contact types. In addition, one of our theoretical motivations for cross effects—namely, research shopping—has strong theoretical and empirical support and has been found in a variety of industries. In terms of theory, Verhoef, Neslin, and Vroomen (2007) list three reasons for research shopping: (1) attribute advantages, whereby consumers view some channels as better for obtaining information (search) and others as better for purchasing; (2) the inability of a search channel to “lock in” a customer; and (3) cross-channel synergy, whereby searching on one channel enhances the purchase experience on another channel. In terms of empirics, Van Baal and Dach (2005) find that the quintessential industries for research shopping (which they call “free-riding”) include consumer electronics, PC equipment/hardware, and software. Prior literature that has found cross effects (though these studies do not control for endogeneity, competition, and so forth) examines the furniture supply (Wiesel, Pauwels, and Arts 2011) and biotech (Chan, Wu, and Xie 2011) industries. As a result, we believe cross effects generalize across many industries, and future work should aim to identify the factors that make it more or less prevalent, similar to Van Baal and Dach’s work on research shopping. The negative association of traditional advertising with paid search click-throughs is another fruitful area of investigation. Research is needed to find the circumstances under which this effect can be reversed. Our finding that increased paid search expenditures are associated with lower clickthrough rates also warrants further investigation. Are they the result of a long-tail effect or a more complex interaction among competitors, customers, and search engines? Our analysis is based on descriptive data and thus, strictly speaking, finds associations rather than establishes direct causality. Although we attempt to address endogeneity, one can never establish causality with complete certainty or be sure that the consistency promised by IV methods pays off in finite samples. In addition, while we control for many major variables (market-level economy, three types of promotions, seasonality, trend, market-specific fixed effects, and competitive advertising), a key concern is always that there still are omitted variables correlated with our advertising variables. Therefore, further field research in this area would be useful. Another avenue for extending our analysis would be to include more endogeneity in the model. For example, we assume that promotions are exogenous because the focal retailer planned promotion “events” ahead
544
of time, cooperating with particular designers, and so forth. Clearance sales are a part of retailing and were also planned for ahead of time. Therefore, we do not believe that these promotions are due to some unobserved factor that occurred in the same week of the promotion. Because this article is based on aggregate data, it primarily provides macro-level insights into cross-channel advertising effects and the mediating factors for a not-yet-fullyunderstood form of advertising, namely, paid search. As such, although we offer insights at the managerial level of broad strategies, we were not able to address micro-level issues such as consumer heterogeneity and determining exact keyword bidding strategies. We hope that further research will continue to investigate how different forms of advertising affect click-through rates and search impressions. Finally, models optimizing advertising expenditures in light of cross-channel effects require further exploration. What is particularly challenging is that advertising in one channel is driving customers to purchase in other channels, in which the profit margins may be higher or lower. This may induce an optimization to use media that routes the customer to the highest-margin channel. However, companies are multichannel for more strategic reasons, and these reasons need to be taken into account. The important point is that offline and online media must be managed strategically, taking into account their cross-channel effects. REFERENCES
Abraham, Magid (2008), “The Off-Line Impact of Online Ads,” Harvard Business Review, 86 (April), 28. Angrist, Joshua D. and Jörn-Steffen Pischke (2009), Mostly Harmless Econometrics: An Empiricist’s Companion. Princeton, NJ: Princeton University Press. Ansari, Asim, Carl Mela, and Scott A. Neslin (2008), “Customer Channel Migration,” Journal of Marketing Research, 45 (February), 60–76. Assmus, Gert, John U. Farley, and Donald R. Lehmann (1984), “How Advertising Affects Sales: Meta-Analysis of Econometric Results,” Journal of Marketing Research, 21 (February), 650–74. Bradshaw, Tim (2008), “Marketing Budget Cuts Predicted to Deepen,” The Financial Times (July 13), (accessed May 30, 2014), [available at http://www.ft.com/cms/s/0/d76152fc-510111dd-b751-000077b07658.html#axzz33DD4qTiF]. Broadbent, Simon S. (1984), “Modeling with Adstock,” Journal of the Market Research Society, 26 (4), 295–312. Chan, Tat Y., Chunhua Wu, and Ying Xie (2011), “Measuring the Lifetime Value of Customers Acquired from Google Search Advertising,” Marketing Science, 30 (5), 837–50. Danaher, Peter J., André Bonfrer, and Sanjay Dhar (2008), “The Effect of Competitive Advertising Interference on Sales for Packaged Goods,” Journal of Marketing Research, 45 (April), 211–25. ——— and Tracey S. Dagger (2013), “Comparing the Relative Effectiveness of Advertising Channels: A Case Study of a Multimedia Blitz Campaign,” Journal of Marketing Research, 50 (August), 517–34. Ebbes, Peter, Dominik Papies, and Harald J. van Heerde (2011), “The Sense and Non-Sense of Holdout Sample Validation in the Presence of Endogeneity,” Marketing Science, 30 (6), 1115–22. eMarketer (2012), “Paid Search Clickthrough Rates Up Year Over Year,” (January 23), (accessed May 14, 2014), [available at http://www.emarketer.com/Article/Paid-Search-ClickthroughRates-Up-Year-Over-Year/1008791]. Franses, Philip Hans and Richard Paap (2001), Quantitative Models in Marketing Research. Cambridge: Cambridge University Press.
JOURNAL OF MARKETING RESEARCH, OCTOBER 2014 Ghose, Anindya and Sha Yang (2009), “An Empirical Analysis of Search Engine Advertising Sponsored Search in Electronic Markets,” Management Science, 55 (10), 16005–1622. Greene, William H. (2000), Econometric Analysis. Upper Saddle River, NJ: Prentice Hall. Hauser, John R., Glen L. Urban, Guilherme Liberali, and Michael Braun (2009), “Website Morphing,” Marketing Science, 28 (2), 202–223. IAB (2013) “IAB Internet Advertising Revenue Report,” (April 16), (accessed May 30, 2014), [available at http://www.iab.net/ AdRevenueReport]. Lal, Rajiv and Miklos Sarvary (1999), “When and How Is the Internet Likely to Decrease Price Competition?” Marketing Science, 18 (4), 485–503. Lamey, Lien, Barbara Deleersnyder, Marnik G. Dekimpe, and JanBenedict E.M. Steenkamp (2012), “The Effect of Business Cycle Fluctuations on Private-Label Share: What Has Marketing Conduct Got to Do with It?” Journal of Marketing, 76 (January), 1–19. Leone, Robert P. (1995), “Generalizing What Is Known About Temporal Aggregation and Advertising Carryover,” Marketing Science, 14 (3, Part 2 of 2), G141–50. Ma, Yu, Kusum L. Ailawadi, Dinesh K. Gauri, and Dhruv Grewal (2011), “An Empirical Investigation of the Impact of Gasoline Prices on Grocery Shopping Behavior,” Journal of Marketing, 75 (March), 18–35. Macy’s (2013), “Macy’s, Inc. Reports Its Fourth Consecutive Year of Double-Digit Growth in Earnings Per Share,” press release, (February 26), (accessed May 14, 2014), [available at http://phx. corporate-ir.net/phoenix.zhtml?c=84477&p=irol-newsArticle& ID=1789234]. Manchanda, Puneet, Jean-Pierre Dubé, K.Y. Goh, and Pradeep Chintagunta (2006), “The Effect of Banner Advertising on Internet Purchasing,” Journal of Marketing Research, 43 (February), 98–108. Marketing Science Institute (2014), 2014–2016 Research Priorities. Cambridge, MA: Marketing Science Institute. McKinsey (2009), “The Crisis: A New Era in Management,” McKinsey Quarterly, 1. Murphy, David (2008), “A Measured Approach,” Marketing, (March 26), 47–49. Naik, Prasad A. and Kay Peters (2009), “A Hierarchical Marketing Communications Model of Online and Offline Media Synergies,” Journal of Interactive Marketing, 23 (4), 288–99. Nevo, Aviv (2001), “Measuring Market Power in the Ready-to-Eat Cereal Industry,” Econometrica, 69 (2), 307–342. Parks, R. (1967), “Efficient Estimation of a System of Regression Equations When Disturbances Are Both Serially and Contemporaneously Correlated,” Journal of the American Statistical Association, 62 (June), 500–509. Pauwels, Koen, Peter S.H. Leeflang, Marije L. Teerling, and K.R. Eelko Huizingh (2011), “Does Online Information Drive Offline Revenues? Only for Specific Products and Consumer Segments!” Journal of Retailing, 87 (1), 1–17. Plosser, Charles I. and G. William Schwert (1978) “Money, Income and Sunspots: Measuring Economic Relationships and the Effects of Differencing,” Journal of Monetary Economics, 4 (4), 637–60. Rutz, Oliver J. and Randolph E. Bucklin (2011), “From Generic to Branded: A Model of Spillover in Paid Search Advertising,” Journal of Marketing Research, 48 (February), 87–102. ——— and ——— (2013), “Paid Search Advertising,” in Advanced Database Marketing, Kristof Coussement, Koen W. De Bock, and Scott A. Neslin, eds. Farnham, UK: Gower Publishing, 229–46. ———, Michael Trusov, and Randolph E. Bucklin (2011), “Modeling Indirect Effects of Paid Search Advertising: Which Keywords Lead to More Future Visits,” Marketing Science, 30 (4), 646–65.
Driving Online and Offline Sales
Schultz, Randall L. and Dick R. Wittink (1976), “The Measurement of Industry Advertising Effects,” Journal of Marketing Research, 13 (February), 71–75. Sethuraman, Raj, Gerard J. Tellis, and Richard A. Briesch (2011), “How Well Does Advertising Work? Generalizations from Meta-Analysis of Brand Advertising Elasticities,” Journal of Marketing Research, 48 (June), 457–71. Sonnier, Garrett P., Leigh McAlister, and Oliver J. Rutz (2011), “A Dynamic Model of the Effect of Online Communications on Firm Sales,” Marketing Science, 30 (4), 702–716. Trusov, Michael, Randolph E. Bucklin, and Koen Pauwels (2009), “Effects of Word-of-Mouth Versus Traditional Marketing: Findings from an Internet Social Networking Site,” Journal of Marketing, 73 (September), 90–102. Van Baal, Sebastian and Christian Dach (2005), “Free Riding and Customer Retention Across Retailers’ Channels,” Journal of Interactive Marketing, 19 (2), 75–85. Van Heerde, Harald J., Maarten Gijsenberg, Marnik G. Dekimpe, and Jan-Benedict E.M. Steenkamp (2013), “Price and Advertising Effectiveness over the Business Cycle,” Journal of Marketing Research, 50 (April), 177–93. Van Nierop, Erjen J.E.M., Peter S.H. Leeflang, Marije L. Teerling, and Eelko K.R.E. Huizingh (2011), “The Impact of the Introduction and Use of an Informational Website on Offline Customer Buying Behavior,” International Journal of Research in Marketing, 28 (2), 155–65.
545
Verbeek, Marno (2004), A Guide to Modern Econometrics, 2nd ed. Chichester, UK: John Wiley & Sons. Verhoef, Peter C., Scott A. Neslin, and Björn Vroomen (2007), “Multichannel Customer Management: Understanding the Research-Shopper Phenomenon,” International Journal of Research in Marketing, 24 (2), 129–48. Wiesel, Thorsten, Koen Pauwels, and Joep Arts (2011), “Marketing’s Profit Impact: Quantifying Online and Offline Funnel Progression,” Marketing Science, 30 (4), 604–611. Wooldridge, Jeffrey M. (2002), Econometric Analysis of Cross Section and Panel Data. Cambridge, MA: MIT Press. Yang, Sha (2011), Personal correspondence on search advertising ROI, Marshall School of Business, University of Southern California (October 24). Yao, Song and Carl F. Mela (2011), “A Dynamic Model of Sponsored Search Advertising,” Marketing Science, 30 (3), 447–68. Zhang, Jie, Paul W. Farris, John W. Irvin, Tarun Kushwaha, Thomas J. Steenburgh, and Barton A. Weitz (2010), “Crafting Integrated Multichannel Retailing Strategies,” Journal of Interactive Marketing, 24 (2), 168–80.