DAVID DISATNIK and YAEL STEINHART* Investment decisions play a crucial role in the way consumers manage their wealth, and therefore, it is important to understand how consumers make these decisions. This research contributes to this attempt by examining consumers’ investment decisions in response to new information about changes in uncertainty in financial markets. The authors identify possible conditions under which consumers, despite having new information about changes in market uncertainty, are less likely to assimilate the new information and consequently do not make investment decisions that are in line with their risk-aversion levels. Specifically, in a series of studies, the authors show that high rather than low need for cognitive closure can lead to a lack of openness to new information and therefore may dilute consumers’ tendency to update their investment portfolios in a way that reflects their risk preferences. In addition, the authors address possible ways to influence consumers’ assimilation of new information, to help even those with high need for cognitive closure make investment decisions that are in line with their levels of risk aversion. Keywords: financial decision making, need for cognitive closure, risk aversion, investment decisions, market uncertainty Online Supplement: http://dx.doi.org/10.1509/jmr.13.0529
Need for Cognitive Closure, Risk Aversion, Uncertainty Changes, and Their Effects on Investment Decisions Recent research has emphasized the importance of understanding how consumers make financial decisions (Amar et al. 2011; Charness and Gneezy 2010; Galak, Small, and Stephen 2011; Kramer and Weber 2012; Levav and Argo 2010; Raghubir and Das 2010; Townsend and Shu 2010). As part of that effort, the current work sheds new light on consumers’ investment decisions in response to changes in uncertainty in financial markets. We identify possible conditions under which consumers, despite having new informa-
tion about changes in market uncertainty, are less likely to react to the new information and consequently do not update their investment portfolios in a way that reflects their risk-aversion levels. Research has extensively investigated risk aversion and found that it influences attitudes and behaviors (Simonsohn 2009; Slovic 1987). In essence, people with higher levels of risk aversion have lower tolerance for uncertainty than those with lower levels of risk aversion. In particular, risk aversion plays a major role in financial and investment decisions (Markowitz 1952; Merton 1972; Shiv et al. 2005; Zhou and Pham 2004). Thus, we might expect that when making investment decisions, people who receive new information about changes in market uncertainty will respond to such information and update their investment portfolios in a way that corresponds to their levels of risk aversion. We propose, however, that merely receiving the new market information is not enough for people to react to it; their
*David Disatnik is Assistant Professor of Finance and Accounting (e-mail:
[email protected]), and Yael Steinhart is Assistant Professor of Marketing (e-mail:
[email protected]), Recanati Business School, Tel Aviv University. The authors thank Arie Kruglanski, Arne Roets, and the JMR review team for their helpful comments, suggestions, and insights. The authors also gratefully acknowledge the financial support from the Henry Crown Institute of Business Research at Tel Aviv University and the Israel Science Foundation. John G. Lynch served as associate editor for this article. © 2015, American Marketing Association ISSN: 0022-2437 (print), 1547-7193 (electronic)
1
Journal of Marketing Research, Ahead of Print DOI: 10.1509/jmr.13.0529
2
likelihood of assimilating the new information also matters. We identify one factor related to the motivation to process information and make judgments that may affect this likelihood. This factor is need for cognitive closure (NFCC), namely, the desire (either chronic or situational) for a definite opinion, any opinion rather than confusion, ambiguity, or inconsistency (Kardes et al. 2004; Kruglanski 2004; Kruglanski and Webster 1996; Webster and Kruglanski 1994). The NFCC literature suggests that as NFCC increases, people are less likely to consider new evidence after rendering a judgment (De Dreu 2003; Kardes et al. 2004; Kruglanski et al. 2006; Kruglanski and Webster 1996). Therefore, we hypothesize that people with high NFCC, regardless of how risk averse they are, may not assimilate the new information about changes in market uncertainty and consequently may not update their investment portfolios to the extent their risk preferences would suggest. In contrast, we expect people with low NFCC to assimilate the new information and to update their portfolios accordingly. The evidence we obtained from field data indicates that actual financial holdings of people with high NFCC may not necessarily correspond to their risk-aversion levels. Our data source was the 2012 wave of the DNB Household Survey (DHS)—a panel survey that gathers information on the economic behavior of Dutch households, including actual financial holdings, psychological aspects of financial behavior, and personal characteristics. Focusing on 934 respondents ranging in age from 25 to 75 years (Mage = 54, 52% women), we regressed the proportion of safer assets in respondents’ financial holdings on (1) their average scores on a risk-aversion scale, (2) a proxy of their NFCC level, and (3) the interaction between the two variables.1 We obtained a significant interaction between risk aversion and NFCC (b = –1.39; t(930) = –2.63, p < .01). Additional analysis of this interaction revealed that the slope of risk aversion was not significant for high levels (1 standard deviation above the mean) of NFCC (b = –.90; t(930) = –1.23, p > .1) but was significant and positive for low levels (1 standard deviation below the mean) of NFCC (b = 1.64; t(930) = 2.27, p < .05). These field data findings hint that the financial holdings of people with high NFCC do not necessarily correspond to their risk preferences. However, these results reflect a static snapshot of investment allocations, whereas the focus of this article is on investment decisions made in response to changes in market uncertainty. To analyze investment decisions in a setting that involves changes in market uncertainty, we carried out a series of laboratory experiments. The experiments consistently confirmed our predictions, showing that in reaction to new
1While the DHS survey does not include a structured NFCC scale, it does include the item “I like order.” Because a preference for order is one of the manifestations of NFCC (Kruglanski and Webster 1996; Webster and Kruglanski 1994), to examine whether the item “I like order” could indeed serve as a proxy for NFCC, we conducted a pretest among 214 participants. They completed the 15-item NFCC scale of Roets and Van Hiel (2011), which includes three questions about the construct “order.” We computed each participant’s average scores over the entire scale and the three “order” questions. The correlation between the two averages was positive and relatively high (r = .76, p < .01), suggesting that the item “I like order” is a plausible proxy for NFCC in the DHS sample.
JOURNAL OF MARKETING RESEARCH, Ahead of Print
information about a change in market uncertainty, people with high rather than low NFCC are less likely to update their investment portfolios in a way that corresponds to their levels of risk aversion. The last two experiments also address possible ways to influence people’s assimilation of new information, to help even those with high NFCC make investment decisions that are in line with their risk preferences. Collectively, our results reveal that people’s lack of openness to new information, one possible source of which is high NFCC, may result in investment decisions that do not always reflect their risk-aversion levels. THEORETICAL BACKGROUND
A wealth of research has shown that people’s perceptions of the gravity of risks they face influence their decision processes (Kivetz 2003; Leonhardt, Keller, and Pechmann 2011; Simonsohn 2009; Sitkin and Pablo 1992; Slovic 1987; Srinivasan and Ratchford 1991; Steinhart et al. 2013). This also applies to the context of investment decisions (Markowitz 1952; Merton 1972; Shiv et al. 2005; Weber and Milliman 1997; Zhou and Pham 2004) and risk aversion, which refers to people’s preference for a sure thing to a gamble of equal expected value and for a gamble of low variance to a riskier prospect (Kahneman and Lovallo 1993). Previous work has also considered possible moderators of risk aversion, including social and cultural norms (Carvalho et al. 2008), personal experience (Slovic, Fischhoff, and Lichtenstein 1980), and feelings and cognitions (Arkes, Herren, and Isen 1988; Loewenstein et al. 2001; Steinhart et al. 2013). In the context of investment decisions, studies have shown that risk aversion is a function of financial loss (Kahneman, Knetsch, and Thaler 1991), reference points (Kwon and Lee 2009), and the extent of sunk costs (Zeelenberg and Van Dijk 1997). The current study extends this literature by revealing that high NFCC is another possible characteristic that can prevent people from assimilating new information about market conditions and that, as a result, they may make investment decisions that do not reflect their risk-aversion levels. Need for cognitive closure is a psychological construct that manifests itself in various ways, including the need for decisiveness, close-mindedness, desire for predictability, preference for order and structure, and discomfort with ambiguity (Kruglanski 2004; Kruglanski and Webster 1996; Webster and Kruglanski 1994). Research has found that NFCC plays a central role in the way consumers make decisions and choices (Vermeir, Van Kenhove, and Hendrickx 2002). In general, high NFCC is reflected in relatively rapid termination of cognitive information processing related to an issue (Webster and Kruglanski 1994). For example, Kardes et al. (2004) show that as NFCC increases, people consider less evidence and draw snap conclusions that have obvious and immediate implications for action. Specifically, they demonstrate that those with high NFCC are more likely to focus selectively on belief-consistent information—as reflected in the tendency to infer quality from price—and to neglect belief-inconsistent information that could delay closure. In a similar vein, Cronley et al. (2005) show that people with high NFCC are willing to pay more for products. In
Investment Decisions
other cases, research has shown that those with high NFCC are less sensitive to alternative hypotheses (Kruglanski and Mayseless 1988) and more resistant to change (Kruglanski et al. 2006). Kruglanski and Webster (1996) suggest that for people with high NFCC, decision making involves two main processes: seizing on information that is easy to process and freezing, or not changing one’s mind after forming an opinion. In the seizing stage of decision making, people with high NFCC may exert effort to collect and consider information. However, after making a decision, they are likely to “freeze” and pay less attention to additional or new relevant information that could potentially make them change their minds. According to Kruglanski and Webster, this freezing process strengthens the consolidation of the acquired information and safeguards the knowledge system against new, contradictory information. Our research focuses on the freezing process in the context of investment decisions. We examine the extent to which people with high NFCC update their investment choices in reaction to new information about a change in market uncertainty. We rely on prior literature that has shown, in other domains, a decreasing tendency of those with high NFCC to consider new information after they have made a decision. For example, Vermeir, Van Kenhove, and Hendrickx (2002) find that in the context of a purchase situation, in the freezing process, people with high NFCC sought out less information than those with low NFCC. De Dreu (2003) shows that in the context of negotiation, the freezing process decreased the motivation of people with high NFCC to search for additional information and therefore led them to maintain their preexisting and incorrect conclusions. In the context of persuasion, Kruglanski, Webster, and Klem (1993) find that heightened NFCC increased resistance to persuasion in the freezing process. Previous work has also addressed the type of information that inhibits or facilitates closure. For example, Ford and Kruglanski (1995) show that high levels of NFCC involve neglecting information that is difficult to process because it is partial, ambiguous, complex, or confusing. Research has also found that people’s preference for consistent and easyto-use information increases with their NFCC (Kardes et al. 2004; Webster and Kruglanski 1994). The NFCC can be measured as an individual-difference variable (Roets and Van Hiel 2007, 2011; Webster and Kruglanski 1994). It can also be experimentally manipulated by varying information-processing difficulty through the use of, for example, time pressure, ambiguity, or fatigue manipulations (Kardes et al. 2004; Roets et al. 2008) and by creating unpleasant conditions—for example, exposing participants to an unpleasant background noise or leading them to believe that they will perform a more pleasant task after completing an annoying one (Kruglanski and Webster 1991; Roets et al. 2008). Importantly, converging effects of NFCC on judgment and decision making have been observed, regardless of whether NFCC is measured as a personal trait or manipulated by various means (Kruglanski and Webster 1996). In our studies, we use both NFCC scales and manipulations. Similar to Kruglanski and Webster (1996), we acknowledge that these manipulations are also causes of other processes, such as heuristic and peripheral processes.
3
Therefore, we take care to treat these manipulations as causes of NFCC rather than operational definitions of the construct. Furthermore, it is important to emphasize that the premise of this article is that risk aversion and NFCC are different constructs, even though aversion to uncertainty is inherent in the NFCC (Webster and Kruglanski 1994). Risk aversion is a characterization of how people make decisions, given that they have entered the decision process (after, for example, they receive new information). In contrast, aversion to uncertainty, as part of the NFCC construct, influences the likelihood of entering the decision process. In particular, people with high NFCC prefer not to enter the decision process again (after making a previous decision) and therefore are not likely to assimilate new information they receive. In addition, risk aversion, in the context of investment decisions, may represent a cognitive construct because it pertains to the quantitative aspects of investment outcomes and is often measured by curvature in the person’s utility function for money. Aversion to uncertainty (as part of NFCC), however, is more of a motivational construct that influences the desire to enter the process of making the investment decision. CONCEPTUAL FRAMEWORK AND RESEARCH HYPOTHESES
We analyze a common setting from the investment world, in which, given new information about a change in market uncertainty, people have the opportunity to update investment allocations they have previously chosen. In this setting, people could react to the new market information and update their allocations in a way that reflects their risk-aversion levels. We argue, however, that this prediction may not necessarily come true when the likelihood of assimilating the new information is considered. Specifically, we predict that high levels of NFCC, which are reflected in the tendency not to assimilate new information after rendering a judgment (in our case, choosing an initial investment allocation), will dominate risk preferences that are reflected in people’s desire to match the risk levels of their investment portfolios to the uncertainty level of the market. Therefore, we anticipate that higher levels of NFCC will be associated with a lower likelihood of updating the investment portfolio in a way that corresponds to the level of risk aversion. In contrast, for people with low NFCC, a change in market uncertainty is likely to trigger behavior that is in line with their levels of risk aversion. This is because those with low NFCC are likely to assimilate the new information and react to the uncertainty change accordingly. Thus,
H1: In response to new information about a change (either an increase or a decrease) in market uncertainty, people with high rather than low NFCC are less likely to update their investment portfolios in a way that corresponds to their risk preferences.
Next, we offer two possible boundary conditions for the reduced tendency of people with high NFCC to update their investment allocations in a way that corresponds to their levels of risk aversion. The first boundary condition reflects the freezing process of decision making. We suggest that if
4
people with high NFCC do not need to actively make (seize) an initial investment decision, they will be less likely to experience the process of freezing, in which they do not assimilate new information. For example, consider the following scenario: In the first stage, people do not choose their initial investment allocations by themselves; rather, these allocations are chosen for them externally. Then, in the second stage, they receive information about a change in market uncertainty. We predict that, in this setting, people with high NFCC are likely to assimilate the new information because they did not “seize” in the first stage and consequently will update their investment allocations in line with their risk preferences. Note that we refer to a case in which the initial, externally chosen allocation reflects the preferences of people who have not yet been told about the change in market uncertainty. Therefore, the allocations they choose after being exposed to the new information can be attributed to their reliance on the new information and not to dissatisfaction with the initial allocations. Thus, H2: In response to new information about a change in market uncertainty, people with high NFCC are more likely to update their investment allocations in a way that corresponds to their risk preferences, if their initial allocations were determined for them rather than chosen by them.
The second boundary condition that we suggest pertains to the type of information people with high NFCC are more likely to disregard. As we mentioned previously, people with high NFCC prefer information that can be easily used, while they neglect information that is difficult to process, especially when it is ambiguous, complex, or confusing. Therefore, we predict that these people will be less likely to disregard clear action-oriented information, which includes specific guidance on how to update their investments, than ambiguous action-oriented information, which simply communicates the change in uncertainty level. Thus,
H3: In response to new information about a change in market uncertainty, people with high NFCC are more likely to update their investment allocations in a way that corresponds to their risk preferences if the new information is clearly action oriented rather than ambiguously action oriented.
STUDY 1: INVESTMENT DECISIONS IN RESPONSE TO CHANGES IN UNCERTAINTY
Method
Participants. We recruited 242 participants (Mage = 39 years, 49% women) to take part in an online survey in return for $.50 each. We used an older population rather than a university student sample because we wanted to approach those who, on average, would be likely to have more experience with investment decisions. Procedure and measures. We randomly assigned each participant to one of four conditions in a 2 (noise: with or without) × 2 (uncertainty change indicator: decrease or increase) experimental design. All participants were told that they were part of an experiment on investment decision making and asked to complete a risk-aversion scale. We informed them that bonds are safer than stocks and that when comparing two portfolios, each consisting of stocks and bonds, the portfolio with the higher proportion of bonds
JOURNAL OF MARKETING RESEARCH, Ahead of Print
is considered safer. We then randomly assigned participants to the “with noise” and “without noise” conditions. Afterward, all participants reported the optimal allocation (summed to 100%) between stocks and bonds they would choose for their own investment portfolios. We told half the participants that new information about an increase in market uncertainty had become available and informed the other half that new information about a decrease in market uncertainty had become available. Then, we gave all participants the option to stick with their previously chosen investment allocations or to change them. Last, we asked them to report their updated allocations between stocks and bonds (even if they decided to stay with their initial choices). (For the complete stimuli and measures, see Web Appendix A.) Dependent variable. The dependent variable was the difference between the proportion of bonds in participants’ updated and initial investment portfolios (hereinafter, the change in proportion of bonds). A positive value of this variable represents an increase in the proportion of bonds, and a negative value represents a decrease in the proportion of bonds. Note that it is sufficient to discuss only the proportion of bonds because the stocks’ proportion in the portfolios is the “complement to 100%.” For example, if a participant chose an initial allocation of 80% bonds and 20% stocks and then an updated allocation of 70% bonds and 30% stocks, the value of the change in proportion of bonds used in our regression analysis would be –10. Independent variables. First, we measured risk aversion on a seven-point scale (1 = “strongly disagree,” and 7 = “strongly agree”) taken from Bruner, Hensel, and James (2005) (a = .79). Second, following Kruglanski and Webster (1991) and Roets et al. (2008), we used noise as a cause of NFCC. Specifically, half the participants heard a dull beep (1,000 Hz) during the experiment, and the other half did not. At the start of the experiment, we told participants who would be exposed to the noise that they had to keep the sound on during the experiment. To confirm that they had not turned off the sound, we played a specific name and immediately afterward asked them to report which name they had heard. A pretest confirmed that the presence of the noise caused higher levels of NFCC than its absence. (For additional information about the pretest, see Web Appendix B.) Third, we included an uncertainty change indicator, either an increase or a decrease. Fourth, we measured the proportion of bonds in participants’ investment portfolios before they were told about the change in market uncertainty (hereinafter, the initial proportion of bonds). We used this variable as a control variable in our model because it affects the change in proportion of bonds. Again, it is sufficient to discuss only the proportion of bonds because the stocks’ proportion in the initial portfolio is the “complement to 100%.” For example, if a participant chose an initial allocation of 60% bonds and 40% stocks, 60 would be the value of the initial proportion of bonds used in our regression analysis. Results and Discussion
We used a regression analysis, in line with Fitzsimons’s (2008) and Irwin and McClelland’s (2003) recommendations. Specifically, we regressed the change in proportion of bonds on the average score of the risk-aversion scale (mean
Investment Decisions
centered; Mrisk aversion = 5.51), the dummy variable of the NFCC conditions (1 = high NFCC, 0 = low NFCC), the uncertainty change indicator (1 = decrease in uncertainty, 0 = increase in uncertainty), and all two-way interactions between the three variables. We included the initial proportion of bonds as a control variable. Web Appendix C provides a comparison of the results of this model and those of a model that also includes the three-way interaction of risk aversion, NFCC, and the uncertainty change indicator. As the first column of Table 1 shows, we found a significant simple effect of risk aversion (b = 2.06; t(234) = 2.42, p < .05), a significant simple effect of the uncertainty change indicator (b = –6.46; t(234) = –3.72, p < .001), a significant main effect of the initial proportion of bonds (b = –.14; t(234) = –5.30, p < .001), and a marginally significant simple effect of NFCC (b = –3.15; t(234) = –1.70, p = .09). Importantly, the risk aversion × NFCC interaction was significant (b = –2.69; t(234) = –2.32, p < .05).2
2Because NFCC and the uncertainty change indicator are dummy variables (that take the values of 1 and 0), the regression coefficient of risk aversion represents the simple effect of risk aversion on the change in proportion of bonds when both NFCC and the uncertainty change indicator are at zero (low NFCC and increase in uncertainty, respectively). Because we mean-center risk aversion, the coefficient of NFCC represents the simple effect of NFCC on the change in proportion of bonds when risk aversion is at its mean level and the uncertainty change indicator is at zero (increase in uncertainty). Similarly, the coefficient of the uncertainty change indicator represents the simple effect of the uncertainty change indicator on the change in proportion of bonds when risk aversion is at its mean level and NFCC is at zero (low NFCC). Regression coefficients in Studies 2–4 should be interpreted in a similar way. (For more details on the interpretation of coefficients in moderated regression, see Spiller et al. 2013.)
Table 1
REGRESSION RESULTS OF STUDIES 1 AND 2
Intercept Risk aversion NFCC Risk aversion × NFCC Initial proportion of bonds Uncertainty change indicator Risk aversion × uncertainty change indicator NFCC × uncertainty change indicator R2 Overall F d.f.
Study 1: Change in Proportion of Bonds
13.48*** 2.06** –3.15* –2.69** –.14*** –6.46*** .31
(2.07) (.85) (1.86) (1.16) (.03) (1.74)
(1.12)
2.61 (2.60) .18 7.30*** 7, 234
Study 2: Change in Proportion of Bonds
26.07*** 1.28 –3.28* –3.76** –.31***
(5.20) (1.81) (1.94) (1.47) (.08)
.37 6.48*** 4, 45
*p < .1. **p < .05. ***p < .01. Notes: In the two regressions, the change in proportion of bonds is the dependent variable. For the predictors, risk aversion is a continuous variable that takes values from 1 to 7 and is mean centered, NFCC is a dummy variable (1 = high NFCC, 0 = low NFCC) in Study 1 and a continuous variable that takes values from 1 to 7 and is mean centered in Study 2, the uncertainty change indicator is a dummy variable (1 = decrease in uncertainty, 0 = increase in uncertainty), and the initial proportion of bonds is a continuous variable that takes values from 0 to 100. Entries represent unstandardized coefficients. Standard errors are in parentheses.
5
To gain a deeper understanding of the results, we followed Aiken and West (1991), Fitzsimons (2008), Irwin and McClelland (2001), and Spiller et al. (2013) and examined the effect of risk aversion on the change in proportion of bonds in all four possible conditions of NFCC and the uncertainty change indicator. In line with H1, when participants were told about an increase in market uncertainty, the slope of risk aversion was not significant in the high NFCC condition (b = –.64; t(234) = –.56, p > .1). In contrast, the slope of risk aversion was significant and positive in the low NFCC condition (b = 2.06; t(234) = 2.42, p < .05). Likewise, when participants were told about a decrease in market uncertainty, the results were also consistent with H1. The slope of risk aversion was not significant in the high NFCC condition (b = –.33; t(234) = –.32, p > .1), but it was significant and positive in the low NFCC condition (b = 2.36; t(234) = 2.51, p < .05). Taken together, the findings suggest that in reaction to information about a change (either an increase or a decrease) in market uncertainty, people with high NFCC do not update their investment portfolios in a way that corresponds to their risk-aversion levels, while those with low NFCC do. STUDY 2: ACTUAL INVESTMENT DECISIONS IN THE LAB
Method
Participants. We recruited 50 participants (Mage = 38 years, 46% women) to take part in an online survey. The amount we paid each participant was a function of the investment decisions he or she made during the experiment, as we describe subsequently. Participants were approached through the same online survey database as in Study 1. Procedure and measures. Participants were told that they were part of an experiment on investment decision making and that they were assigned an initial amount of $5. In addition, they were told that at the end of the experiment, the amount they would receive would be the outcome of their subsequent investment decisions with regard to their $5; they were given the following example: “If you make a 10% profit, you will receive $5.50, whereas if you lose 10%, you will receive $4.50.” The participants then completed a riskaversion scale and an NFCC scale. We informed them that bonds are safer than stocks and that when comparing two portfolios, each consisting of stocks and bonds, the portfolio with the higher proportion of bonds is considered safer. Afterward, all participants allocated their $5 between stocks and bonds. We specifically informed them that the proportion they assigned to bonds and stocks had to sum to 100%. After two days, we contacted the participants again and reminded them of the investment allocations they had made in the first part of the experiment. We then told them that new information about an increase in market uncertainty had become available and gave them the option to stick with their previously chosen investment allocations or to change them. We asked them to report their updated allocations between stocks and bonds (even if they decided to stay with their initial choices). Last, after determining arbitrarily that bonds had increased by 2% and stocks had decreased by 5%, we paid the participants in accordance with their
6
updated allocations between stocks and bonds. (For the complete stimuli and measures, see Web Appendix A.) Dependent variable. The dependent variable was the change in proportion of bonds, as in Study 1. Independent variables. First, we measured risk aversion on the same scale (a = .84) as in Study 1. Second, we measured NFCC on a seven-point scale (1 = “strongly disagree,” and 7 = “strongly agree”) using Roets and Van Hiel’s (2011) scale (a = .92). Third, we used the initial proportion of bonds as a control variable, as in Study 1.
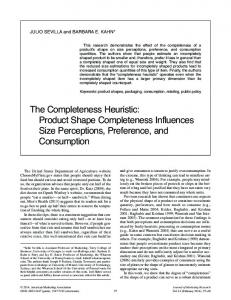
Results and Discussion We regressed the change in proportion of bonds on the average score of the risk-aversion scale (mean centered; Mrisk aversion = 5.41), the average score of the NFCC scale (mean centered; MNFCC = 4.66), and the interaction between the two variables. We included the initial proportion of bonds as a control variable. As the second column of Table 1 shows, we found a significant main effect of the initial proportion of bonds (b = –.31; t(45) = –3.89, p < .001) and a marginally significant simple effect of NFCC (b = –3.28; t(45) = –1.70, p = .10). Importantly, the risk aversion × NFCC interaction was significant (b = –3.76; t(45) = –2.56, p < .05). Because NFCC was a continuous variable in this study, to explore the interaction, we used the Johnson–Neyman “floodlight” approach that Spiller et al. (2013) recommend. As Figure 1 depicts, there was a significant, positive effect of risk aversion on the change in proportion of bonds for NFCC levels lower than 3.57 (BJN = 5.35, SE = 2.66, p = .05; MNFCC = 4.66, SDNFCC = 1.07) but not for NFCC levels higher than 3.57, and there was even a significant, negative effect of risk aversion on the change in proportion of bonds for NFCC levels higher than 6.65 (BJN = –6.24, SE = 3.10, p = .05; MNFCC = 4.66, SDNFCC = 1.07) (see also Table W3 in Web Appendix D). These findings provide support for H1 and are in line with Study 1, which also showed that, unlike participants with low NFCC, those with high NFCC did not Figure 1
The Effect of Risk Aversion on the Change in Proportion of Bonds
STUDY 2: FLOODLIGHT ANALYSIS 20
3.57
16 12
6.65
8 4 0
–4 –8
–12 –16
0
1
2
3
NFCC
4
5
6
7
Notes: The graph, drawn on the basis of a floodlight analysis (Spiller et al. 2013), illustrates the effect of risk aversion on the change in proportion of bonds for any NFCC value. Confidence bands are also presented, and the Johnson–Neyman points are obtained at NFCC = 3.57 and NFCC = 6.65 (p = .05).
JOURNAL OF MARKETING RESEARCH, Ahead of Print
rebalance their investment portfolios in a way that corresponded to their risk-aversion levels. We found similar results in an additional study (88 participants, Mage = 39, 49% women), in which we again measured NFCC as a dispositional trait. A floodlight analysis revealed a significant, positive effect of risk aversion on the change in proportion of bonds for NFCC levels lower than 3.92 (BJN = 2.13, SE = 1.07, p = .05; MNFCC = 4.32, SDNFCC = 1.13) but not for NFCC levels higher than 3.92. Participants were also asked to rate the importance of the new information about the increase in uncertainty. An additional floodlight analysis showed a significant, positive effect of risk aversion on the perceived importance of the new information for NFCC levels lower than 4.60 (BJN = .33, SE = .17, p = .05; MNFCC = 4.32, SDNFCC = 1.13) but not for NFCC levels higher than 4.60. Using a moderation– mediation analysis (Preacher, Rucker, and Hayes 2007), we also found that among participants with high NFCC, the perceived importance of the new information did not mediate the effect of risk aversion on the change in proportion of bonds (95% confidence interval: –1.01 to 1.98), while there was such a mediation effect among participants with low NFCC (95% confidence interval: .52 to 2.90). STUDY 3: EXTERNAL VERSUS INTERNAL INITIAL ALLOCATION
Study 3 introduces a possible boundary condition related to the freezing process of decision making. Unlike in Studies 1 and 2, half the participants do not choose the initial investment allocations by themselves, but rather these allocations are chosen for them. In this case, we predict that in response to new information about a change in market uncertainty, participants with high NFCC will update their investment allocations in accordance with their risk preferences (H2). Method
Participants. We recruited 174 participants (Mage = 34 years, 41% women) from Amazon.com’s Mechanical Turk to complete an online survey in return for $.50. Procedure and measures. We randomly assigned each participant to one of four conditions in a 2 (time limit: with or without) × 2 (type of initial allocation: internal or external) experimental design. We used a procedure similar to that in Study 1, with three major differences. First, we used a time-limit manipulation instead of a noise manipulation. Second, we asked only half the participants to determine the optimal allocation between stocks and bonds for their own initial investment portfolios (the internal-initial-allocation condition). We told the other half to imagine that they had unexpectedly inherited an existing portfolio from a distant relative, containing 60% bonds and 40% stocks (the externalinitial-allocation condition).3 Third, we informed all participants that there was an increase in market uncertainty. (For the complete stimuli and measures, see Web Appendix A.) 3We selected the allocation of the inherited portfolio to fit the preferences of people with high risk aversion, based on a pretest conducted with 111 participants in Mechanical Turk. The pretest findings revealed that, on average, highly risk-averse participants are likely to choose an initial allocation consisting of 62% bonds and 38% stocks.
Investment Decisions
Dependent variable. The dependent variable was the change in proportion of bonds, as in Studies 1 and 2. Independent variables. First, for risk aversion, we used the same scale (a = .82) as in Studies 1 and 2. Second, following Kardes et al. (2004) and Roets et al. (2008), we used a time limit as a way to cause NFCC. Specifically, we told participants who would receive a time limit, “It is not necessary to spend a great deal of time pondering the questions you are about to see. In fact, please answer the questions as quickly as possible (while still providing an accurate answer) without taking a lot of time to ponder each one— simply provide your initial, honest opinion.” In addition, when response latencies exceeded five seconds, participants were asked to “Please respond faster.” Third, we measured the type of initial allocation, either internal or external. Fourth, we used the initial proportion of bonds as a control variable, as in Studies 1 and 2. Pretests. We conducted three pretests. The first pretest helped us determine the external initial allocation (as mentioned in footnote 3) and to confirm the awareness of participants of the time limit. The second pretest confirmed that the presence of the time limit caused higher levels of NFCC than its absence. In the third pretest, we ensured that our analysis was not confounded by a different “perception of ownership” among those who inherited the initial allocation compared with those who chose it by themselves. (For additional information about the pretests, see Web Appendix B.) Results and Discussion
We regressed the change in proportion of bonds on the average score of the risk-aversion scale (mean centered; Mrisk aversion = 4.11), the dummy variable of the NFCC conditions (1 = high NFCC, 0 = low NFCC), the dummy variable of the type of initial allocation (1 = external, 0 = internal), all the two-way interactions between the three variables, and the three-way interaction between them. We included the initial proportion of bonds as a control variable. As Panel A of Table 2 shows, there was a significant main effect of the initial proportion of bonds (b = –.15; t(165) = –2.06, p < .05) and a significant three-way interaction between risk aversion, NFCC, and the type of initial allocation (b = 7.66; t(165) = 2.02, p < .05). To probe the results, we first examined the two-way interaction between risk aversion and NFCC in the two possible conditions of the type of initial allocation. As in Studies 1 and 2, when the initial allocation was internal, the coefficient of the interaction was significant and negative (b = –4.92; t(165) = –2.00, p < .05). In contrast, the interaction between risk aversion and NFCC was not significant in the case of the external initial allocation (b = 2.74; t(165) = .95, p > .1), providing initial indication of the validity of H2. To further test H2, we examined the effect of risk aversion on the change in proportion of bonds in all four possible conditions of NFCC and the type of initial allocation. Consistent with H2, in the high NFCC condition, the slope of risk aversion was significant and positive when the initial allocation was external (b = 6.50; t(165) = 2.71, p < .01). In contrast, and in line with Studies 1 and 2, the slope of risk aversion was not significant among participants in the high NFCC condition whose initial allocation was internal (b = –2.86; t(165) = –1.62, p > .1). Among participants in the low
7
Table 2
REGRESSION RESULTS OF STUDIES 3 AND 4 A: Study 3
Intercept Risk aversion NFCC Type of initial allocation Initial proportion of bonds Risk aversion × NFCC Risk aversion × type of initial allocation NFCC × type of initial allocation Risk aversion × NFCC × type of initial allocation R2 Overall F d.f. B: Study 4
Intercept Risk aversion Information clarity Risk aversion × information clarity Initial proportion of bonds R2 Overall F d.f.
Change in Proportion of Bonds 11.44** (3.93) 2.06 (1.88) –1.43 (3.28) –5.82 (3.52) –.15* (.07) –4.92* (2.46) 1.70 (2.49) .98 (4.84) 7.66* (3.80) .16 3.99** 8, 165
Change in Proportion of Bonds 10.20** (3.27) –1.46 (1.43) 3.05 (1.98) 3.37* (1.67) –.11* (.05) .12 3.21* 4, 97
*p < .05. ** p < .01. Notes: In the two regressions, the change in proportion of bonds is the dependent variable. For the predictors, risk aversion is a continuous variable that takes values from 1 to 7 and is mean centered, NFCC is a dummy variable (1 = high NFCC, 0 = low NFCC), the type of initial allocation is a dummy variable (1 = external, 0 = internal), information clarity is a dummy variable (1 = clear guidance, 0 = no clear guidance), and the initial proportion of bonds is a continuous variable that takes values from 0 to 100. Entries represent unstandardized coefficients. Standard errors are in parentheses.
NFCC condition, the slope of risk aversion was significant and positive when the initial allocation was external (b = 3.76; t(165) = 2.31, p < .05). When the initial allocation was internal, consistent with Studies 1 and 2, the slope of risk aversion was positive (b = 2.06). However, this time it was not significant (t(165) = 1.10, p > .1). In summary, Study 3 offers a possible boundary condition. The findings suggest that if the initial investment decision is made by someone else, people with high NFCC rebalance their investment portfolios in a way that corresponds to their risk preferences. STUDY 4: INFORMATION CLARITY
In Study 4, we explore an additional possible boundary condition related to the type of new information to which people are exposed. Unlike in the previous studies, half the participants learn not only that market uncertainty has increased but also that investment experts therefore recommend investing more in bonds in lieu of stocks. In this case, we predict that in response to new information about a change in market uncertainty, people with high NFCC will be more likely to update their investment allocations in line with their risk preferences (H3).
8
JOURNAL OF MARKETING RESEARCH, Ahead of Print
Method
Participants. We recruited 102 participants to complete an online survey in return for $.50 (Mage = 39 years, 46% women). Participants were approached through the same online survey database as in Studies 1 and 2. Procedure and measures. We used a procedure similar to the one employed in Study 1, with three major differences. First, all participants were exposed to the noise manipulation described in Study 1. Second, we randomly assigned each participant to one of two conditions: no clear guidance and clear guidance. Participants in the no-clear-guidance condition were told, after choosing the initial allocation, only that the market uncertainty had increased. Participants in the clear-guidance condition not only were informed about the increase in market uncertainty but also were told that investment experts therefore recommended increasing the proportion of bonds in investment portfolios. Third, all participants were informed that there was an increase in market uncertainty. (For the complete stimuli and measures, see Web Appendix A.) Dependent variable. The dependent variable was the change in proportion of bonds, as in Studies 1–3. Independent variables. First, we measured risk aversion using the same scale (a = .82) as in Studies 1–3. Second, we measured information clarity, either no clear guidance or clear guidance. Third, we used the initial proportion of bonds as a control variable, as in Studies 1–3.
Results and Discussion
We regressed the change in proportion of bonds on the average score of the risk-aversion scale (mean centered; Mrisk aversion = 5.48), the dummy variable of the information clarity conditions (1 = clear guidance, 0 = no clear guidance), and the interaction between the two variables. We included the initial proportion of bonds as a control variable. As Panel B of Table 2 shows, there was a significant main effect of the initial proportion of bonds (b = –.11; t(97) = –2.21, p < .05). Importantly, the risk aversion × information clarity interaction was significant (b = 3.37; t(97) = 2.01, p < .05). To gauge the interaction, we examined the effect of risk aversion on the change in proportion of bonds for the two possible levels of information clarity. In line with H3, the slope of risk aversion was marginally significant and positive among participants in the clear-guidance condition (b = 1.91; t(97) = 1.92, p = .06). In contrast, and in line with the findings of the previous studies, among participants in the no-clear-guidance condition, the slope of risk aversion was not significant (b = –1.46; t(97) = –1.02, p > .1). This study offers an additional possible boundary condition. The findings indicate that if people with high NFCC receive clear guidance about what to do, they are more likely to update their investment allocations in a way that corresponds to their risk preferences. A QUANTITATIVE SIMULATION
To provide a quantitative assessment of how the phenomenon we identified might affect a real investor, we conducted a follow-up simulation. We used the annual returns of the S&P 500 index from 1999 to 2013 as a proxy for stock returns and the 1999–2013 annual returns of the Barclays
U.S. Treasury Bond 1-3 Year Term Index as a proxy for bond returns. We assumed an initial allocation consisting of 60% bonds and 40% stocks, as in the external-initial-allocation condition of Study 3. For the change in proportion of bonds, we used the average changes of participants with high and low NFCC in the incentive-compatible Study 2 (participants were tagged as having either high or low NFCC on the basis of a median split of their NFCC levels). These changes were 2.36% and 9.08%, respectively. Thus, in the simulation, the allocation representing the updated portfolio of participants with high NFCC was 62.36% bonds and 37.64% stocks, and that of participants with low NFCC was 69.08% bonds and 30.92% stocks. Using the standard deviation of returns, which is the classical measure of risk in finance literature (Markowitz 1952; Merton 1972), we obtained striking results. From 1999 to 2013, the standard deviation of the annual returns of the updated portfolio of those with high NFCC was 28.26% higher than that of the updated portfolio of those with low NFCC (6.03% vs. 4.70%). Similarly, from 2004 to 2013, the standard deviation of the returns associated with the updated portfolio of those with high NFCC was 26.73% higher than that of the portfolio of those with low NFCC (5.87% vs. 4.63%), and from 2009 to 2013, the standard deviation of the returns associated with the updated portfolio of those with high NFCC was 24.31% higher than that of the portfolio of those with low NFCC (3.67% vs. 2.95%). Collectively, these results indicate that people with high NFCC take on substantially more risk because they do not update their investment portfolios in a way that corresponds to their risk-aversion levels. GENERAL DISCUSSION
This research challenges the assumption that consumers always react to new market information when they make investment decisions. We specify conditions, caused by high NFCC, under which consumers may not assimilate the new information and consequently make investment decisions that do not reflect their risk preferences. Specifically, Study 1 shows that in response to new information about a change in market uncertainty, people with high rather than low NFCC are less likely to rebalance their investment portfolios in a way that reflects their risk-aversion levels. In Study 2, we add a feature of actual investment decisions to our laboratory setting and confirm the existence of the phenomenon. The findings in Study 3 suggest that a way to help people with high NFCC make investment decisions that are in line with their risk preferences is to choose the initial investment allocations for them. In Study 4, we show an additional scenario in which the inconsistency between investment decisions and risk preferences is less likely to occur—namely, when the new information about the change in market uncertainty also includes clear guidance on how to cope with the change. Last, using real data from 1999 to 2013, our quantitative simulation demonstrates that people with high NFCC are likely to take on substantially more risk than those with low NFCC because they do not update their portfolios in a way that corresponds to their risk preferences. The insights we derive in this article can be considered in the broader context of omission bias (Baron and Ritov 2004; Ritov and Baron 1990) or inertia (Hershey, Kunreuther, and Schoemaker 1982) in financial decisions. That
Investment Decisions
is, the lack of a match between investment behavior and risk preferences is but one context in which a failure to rebalance might occur. Other possible financial contexts include corporate dividend payout policies (Michaely, Thaler, and Womack 1995) and an entrepreneur’s decision of whether to continue to invest in a venture (Sandri et al. 2010). Our results are also relevant to consumption decisions, such as choosing a health or life insurance program, deciding which pharmaceutical drugs to use, or buying a car or a house. The current work also corresponds to the study of Kay et al. (2014), who show that perceiving structure, even in domains unrelated to the current behavioral context, can enhance willingness to take goal-directed actions. Our results suggest that the opposite may also be true. When people perceive a setting as unstructured (as in the case of a market in which changes in uncertainty are taking place), the need for structure, one of the components of NFCC, may diminish their likelihood of rebalancing investment portfolios in a way that reflects risk preferences. Another possible avenue to explore is whether our results regarding risk aversion also apply to ambiguity aversion (Heath and Tversky 1991; Muthukrishnan and Kardes 2001). One of the premises of this article is that a rebalancing of investment portfolios is recommended when market uncertainty changes. By no means, however, are we advocating frequent trading, which Barber and Odean (2000) show can significantly harm portfolio returns, nor are we encouraging churning—excessive buying and selling of securities largely to generate commissions—a practice that is illegal in many jurisdictions. Signals in the market that indicate that the uncertainty level has changed include changes in the VIX index, which is a popular measure of the volatility of the U.S. stock market, and changes in macroeconomic variables, such as gross domestic product, the unemployment rate, and the University of Michigan Consumer Sentiment Index. Note, however, that it is often difficult to tell whether a certain change in uncertainty will have a short- or long-term effect. Nonetheless, future research could explore situations in which participants are specifically informed that the change in uncertainty has either a short- or a long-term effect. In Study 4, we discuss a possible boundary condition linked to the clarity level of the new information provided to people with high NFCC. We find that when the information is clearly action oriented rather than ambiguously action oriented, people with high NFCC are more likely to assimilate it when making investment decisions. Further research could examine an opposite boundary condition, by presenting new information that should be discounted or ignored (e.g., information characterized as coming from an unreliable source). Such an examination might further show whether people with high NFCC are able to identify the nature of new information and thus decide whether to rely on its content. Finally, the observation that people with high rather than low NFCC are less likely to update their investment portfolios in a way that corresponds to their risk preferences has important implications for practice. First and foremost, people should be aware that they can experience this phenomenon. At the same time, the results of Study 4 suggest that investment experts’ clear guidance can eliminate the phe-
9
nomenon. Thus, professional money managers may be able to create value for their clients, lending support to money managers in the frequent debate in finance literature (Fama and French 2010; Kosowski et al. 2006). In addition, it is common for professional money managers to ask their clients to complete risk-aversion questionnaires to best match investment allocations to their preferences. Our findings indicate that it would be beneficial to use an NFCC questionnaire as well. Further research might also explore the investment decisions of professional money managers themselves in the context of the current research. REFERENCES
Aiken, Leona S. and Stephen G. West (1991), Multiple Regression: Testing and Interpreting Interactions. Newbury Park, CA: Sage Publications. Amar, Moty, Dan Ariely, Shahar Ayal, Cynthia E. Cryder, and Scott I. Rick (2011), “Winning the Battle but Losing the War: The Psychology of Debt Management,” Journal of Marketing Research, 48 (Special Issue), S38–S50. Arkes, Hal R., Lisa T. Herren, and Alice M. Isen (1988), “The Role of Potential Loss in the Influence of Affect on Risk-Taking Behavior,” Organizational Behavior and Human Decision Processes, 42 (2), 181–93. Barber, Brad M. and Terrance Odean (2000), “Trading Is Hazardous to Your Wealth: The Common Stock Investment Performance of Individual Investors,” Journal of Finance, 55 (2), 773–806. Baron, Jonathan and Ilana Ritov (2004), “Omission Bias, Individual Differences, and Normality,” Organizational Behavior and Human Decision Processes, 94 (2), 74–85. Bruner, Gordon C., Paul J. Hensel, and Karen E. James (2005), Marketing Scales Handbook: A Compilation of Multi-Item Measures for Consumer Behavior & Advertising, Vol. 4. Chicago: AMA and Thomson/South-Western. Carvalho, Sergio W., Lauren G. Block, Subramanian Sivaramakrishnan, Rajesh V. Manchanda, and Chrissy Mitakakis (2008), “Risk Perception and Risk Avoidance: The Role of Cultural Identity and Personal Relevance,” International Journal of Research in Marketing, 25 (4), 319–26. Charness, Gary and Uri Gneezy (2010), “Portfolio Choice and Risk Attitudes: An Experiment,” Economic Inquiry, 48 (1), 133– 46. Cronley, Maria L., Steven S. Posavac, Tracy Meyer, Frank R. Kardes, and James J. Kellaris (2005), “A Selective Hypothesis Testing Perspective on Price-Quality Inference and Inference-Based Choice,” Journal of Consumer Psychology, 15 (2), 159–69. De Dreu, Carsten K.W. (2003), “Time Pressure and Closing of the Mind in Negotiation,” Organizational Behavior and Human Decision Processes, 91 (2), 280–95. Fama, Eugene F. and Kenneth R. French (2010), “Luck Versus Skill in the Cross-Section of Mutual Fund Returns,” Journal of Finance, 65 (5), 1915–47. Fitzsimons, Gavan J. (2008), “Death to Dichotomizing,” Journal of Consumer Research, 35 (1), 5–8. Ford, Thomas E. and Arie W. Kruglanski (1995), “Effects of Epistemic Motivations on the Use of Accessible Constructs in Social Judgment,” Personality and Social Psychology Bulletin, 21 (9), 950–62. Galak, Jeff, Deborah Small, and Andrew T. Stephen (2011), “Microfinance Decision Making: A Field Study of Prosocial Lending,” Journal of Marketing Research, 48 (Special Issue), S130–S137. Heath, Chip and Amos Tversky (1991), “Preference and Belief: Ambiguity and Competence in Choice under Uncertainty,” Journal of Risk and Uncertainty, 4 (1), 5–28.
10
Hershey, John C., Howard C. Kunreuther, and Paul J.H. Schoemaker (1982), “Sources of Bias in Assessment Procedures for Utility Functions,” Management Science, 28 (8), 936–54. Irwin, Julie R. and Gary H. McClelland (2001), “Misleading Heuristics and Moderated Multiple Regression Models,” Journal of Marketing Research, 38 (February), 100–109. ——— and ——— (2003), “Negative Consequences of Dichotomizing Continuous Predictor Variables,” Journal of Marketing Research, 40 (August), 366–71. Kahneman, Daniel, Jack L. Knetsch, and Richard H. Thaler (1991), “Anomalies: The Endowment Effect, Loss Aversion, and Status Quo Bias,” Journal of Economic Perspectives, 5 (1), 193–206. ——— and Dan Lovallo (1993), “Timid Choices and Bold Forecasts: A Cognitive Perspective on Risk Taking,” Management Science, 39 (1), 17–31. Kardes, Frank R., Maria L. Cronley, James J. Kellaris, and Steven S. Posavac (2004), “The Role of Selective Information Processing in Price-Quality Inference,” Journal of Consumer Research, 31 (2), 368–74. Kay, Aaron C., Kristin Laurin, Grainne M. Fitzsimons, and Mark J. Landau (2014), “A Functional Basis for Structure-Seeking: Exposure to Structure Promotes Willingness to Engage in Motivated Action,” Journal of Experimental Psychology: General, 143 (2), 486–91. Kivetz, Ran (2003), “The Effects of Effort and Intrinsic Motivation on Risky Choice,” Marketing Science, 22 (4), 477–502. Kosowski, Robert, Allan Timmermann, Russ Wermers, and Hal White (2006), “Can Mutual Fund ‘Stars’ Really Pick Stocks? New Evidence from a Bootstrap Analysis,” Journal of Finance, 61 (6), 2551–95. Kramer, Lisa A. and J. Mark Weber (2012), “This Is Your Portfolio on Winter: Seasonal Affective Disorder and Risk Aversion in Financial Decision Making,” Social Psychological and Personality Science, 3 (2), 193–99. Kruglanski, Arie W. (2004), The Psychology of Closed Mindedness. New York: Psychology Press. ——— and Ofra Mayseless (1988), “Contextual Effects in Hypothesis Testing: The Role of Competing Alternatives and Epistemic Motivations,” Social Cognition, 6 (1), 1–20. ———, Antonio Pierro, Lucia Mannetti, and Eraldo De Grada (2006), “Groups as Epistemic Providers: Need for Closure and the Unfolding of Group-Centrism,” Psychological Review, 113 (1), 84–100. ——— and Donna M. Webster (1991), “Group Members’ Reactions to Opinion Deviates and Conformists at Varying Degrees of Proximity to Decision Deadline and of Environmental Noise,” Journal of Personality and Social Psychology, 61 (2), 212–25. ——— and ——— (1996), “Motivated Closing of the Mind: ‘Seizing’ and ‘Freezing,’” Psychological Review, 103 (2), 263–83. ———, ———, and Adena Klem (1993), “Motivated Resistance and Openness to Persuasion in the Presence or Absence of Prior Information,” Journal of Personality and Social Psychology, 65 (5), 861–76. Kwon, Kyoung-Nan and Jinkook Lee (2009), “The Effects of Reference Point, Knowledge, and Risk Propensity on the Evaluation of Financial Products,” Journal of Business Research, 62 (7), 719–25. Leonhardt, James M., L. Robin Keller, and Cornelia Pechmann (2011), “Avoiding the Risk of Responsibility by Seeking Uncertainty: Responsibility Aversion and Preference for Indirect Agency When Choosing for Others,” Journal of Consumer Psychology, 21 (4), 405–413. Levav, Jonathan and Jennifer J. Argo (2010), “Physical Contact and Financial Risk Taking,” Psychological Science, 21 (6), 804– 810.
JOURNAL OF MARKETING RESEARCH, Ahead of Print Loewenstein, George F., Elke U. Weber, Christopher K. Hsee, and Ned Welch (2001), “Risk as Feelings,” Psychological Bulletin, 127 (2), 267–86. Markowitz, Harry M. (1952), “Portfolio Selection,” Journal of Finance, 7 (1), 77–91. Merton, Robert C. (1972), “An Analytic Derivation of the Efficient Portfolio Frontier,” Journal of Financial and Quantitative Analysis, 7 (4), 1851–72. Michaely, Roni, Richard H. Thaler, and Kent L. Womack (1995), “Price Reactions to Dividend Initiations and Omissions: Overreaction or Drift?” Journal of Finance, 50 (2), 573–608. Muthukrishnan, A.V. and Frank R. Kardes (2001), “Persistent Preferences for Product Attributes: The Effects of the Initial Choice Context and Uninformative Experience,” Journal of Consumer Research, 28 (1), 89–104. Preacher, Kristopher J., Derek D. Rucker, and Andrew F. Hayes (2007), “Addressing Moderated Mediation Hypotheses: Theory, Methods, and Prescriptions,” Multivariate Behavioral Research, 42 (1), 185–227. Raghubir, Priya and Sanjiv R. Das (2010), “The Long and Short of It: Why Are Stocks with Shorter Runs Preferred?” Journal of Consumer Research, 36 (6), 964–82. Ritov, Ilana and Jonathan Baron (1990), “Reluctance to Vaccinate: Omission Bias and Ambiguity,” Journal of Behavioral Decision Making, 3 (4), 263–77. Roets, Arne and Alain Van Hiel (2007), “Separating Ability from Need: Clarifying the Dimensional Structure of the Need for Closure Scale,” Personality and Social Psychology Bulletin, 33 (2), 266–80. ——— and ——— (2011), “Item Selection and Validation of a Brief, 15-Item Version of the Need for Closure Scale,” Personality and Individual Differences, 50 (1), 90–94. ———, ———, Ilse Cornelis, and Barbara Soetens (2008), “Determinants of Task Performance and Invested Effort: A Need for Closure by Relative Cognitive Capacity Interaction Analysis,” Personality and Social Psychology Bulletin, 34 (6), 779–92. Sandri, Serena, Christian Schade, Oliver Mußhoff, and Martin Odening (2010), “Holding On for Too Long? An Experimental Study on Inertia in Entrepreneurs’ and Non-Entrepreneurs’ Disinvestment Choices,” Journal of Economic Behavior and Organization, 76 (1), 30–44. Shiv, Baba, George F. Loewenstein, Antoine Bechara, Hanna Damasio, and Antonio R. Damasio (2005), “Investment Behavior and the Negative Side of Emotion,” Psychological Science, 16 (6), 435–39. Simonsohn, Uri (2009), “Direct Risk Aversion: Evidence from Risky Prospects Valued Below Their Worst Outcome,” Psychological Science, 20 (6), 686–92. Sitkin, Sim B. and Amy L. Pablo (1992), “Reconceptualizing the Determinants of Risk Behavior,” Academy of Management Review, 17 (1), 9–38. Slovic, Paul (1987), “Perception of Risk,” Science, 236 (4799), 280–85. ———, Baruch Fischhoff, and Sarah Lichtenstein (1980), “Facts and Fears: Understanding Perceived Risk,” in Societal Risk Assessments: How Safe Is Safe Enough? Richard C. Schwing and Walter A. Albers Jr., eds. New York: Plenum Press, 181–216. Spiller, Stephen A., Gavan J. Fitzsimons, John G. Lynch Jr., and Gary H. McClelland (2013), “Spotlights, Floodlights, and the Magic Number Zero: Simple Effects Tests in Moderated Regression,” Journal of Marketing Research, 50 (April), 277– 88. Srinivasan, Narasimhan and Brian T. Ratchford (1991), “An Empirical Test of a Model of External Search for Automobiles,” Journal of Consumer Research, 18 (2), 233–42.
Investment Decisions
Steinhart, Yael, Michael A. Kamins, David Mazursky, and Avraham Noy (2013), “Thinking or Feeling the Risk in Online Auctions: The Effects of Priming Auction Outcomes and the Dual System on Risk Perception and Amount Bid,” Journal of Interactive Marketing, 27 (1), 47–61. Townsend, Claudia and Suzanne B. Shu (2010), “When and How Aesthetics Influences Financial Decisions,” Journal of Consumer Psychology, 20 (4), 452–58. Vermeir, Iris, Patrick Van Kenhove, and Hendrik Hendrickx (2002), “The Influence of Need for Closure on Consumer’s Choice Behavior,” Journal of Economic Psychology, 23 (6), 703–727.
11
Weber, Elke U. and Richard A. Milliman (1997), “Perceived Risk Attitudes: Relating Risk Perception to Risky Choice,” Management Science, 43 (2), 123–44. Webster, Donna M. and Arie W. Kruglanski (1994), “Individual Differences in Need for Cognitive Closure,” Journal of Personality and Social Psychology, 67 (6), 1049–1062. Zeelenberg, Marcel and Eric Van Dijk (1997), “A Reverse Sunk Cost Effect in Risky Decision Making: Sometimes We Have Too Much Invested to Gamble,” Journal of Economic Psychology, 18 (6), 677–91. Zhou, Rongrong and Michael T. Pham (2004), “Promotion and Prevention Across Mental Accounts: When Financial Products Dictate Consumers’ Investment Goals,” Journal of Consumer Research, 31 (1), 125–35.